. 2017 Aug 25;12(8):e0183781.
doi: 10.1371/journal.pone.0183781. eCollection 2017.

Infection with purified Piscine orthoreovirus demonstrates a causal relationship with heart and skeletal muscle inflammation in Atlantic salmon

Affiliations

Infection with purified Piscine orthoreovirus demonstrates a causal relationship with heart and skeletal muscle inflammation in Atlantic salmon

Øystein Wessel et al. PLoS One. .

Abstract

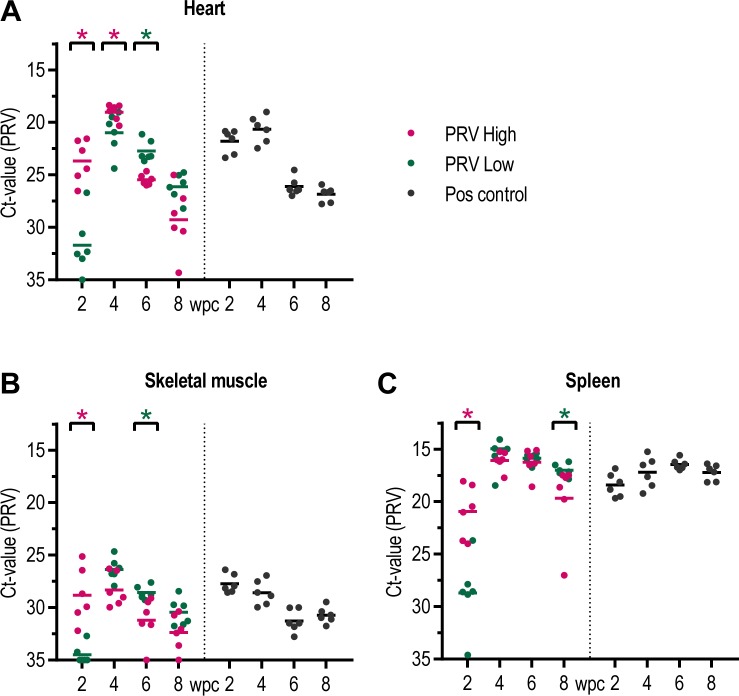
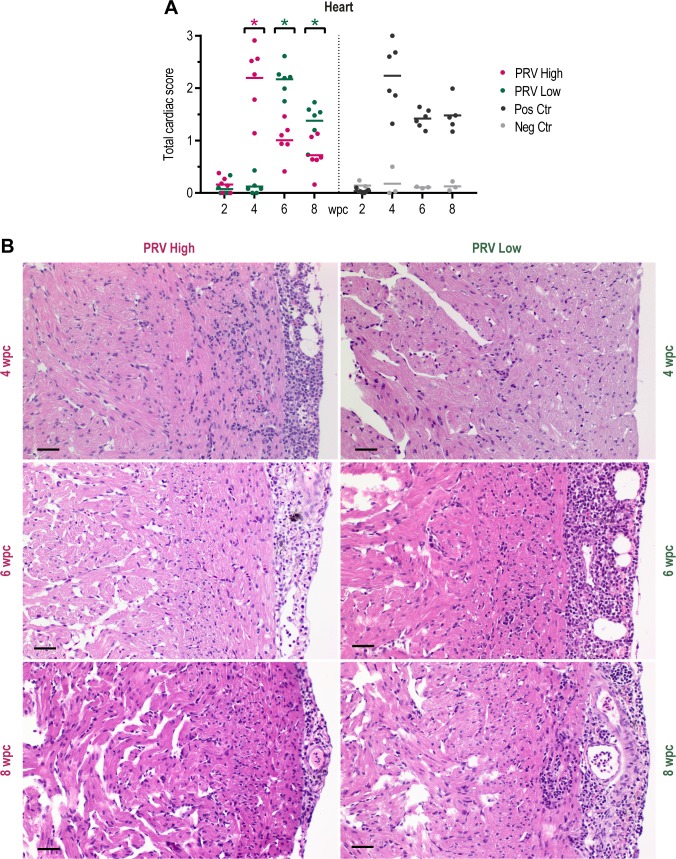
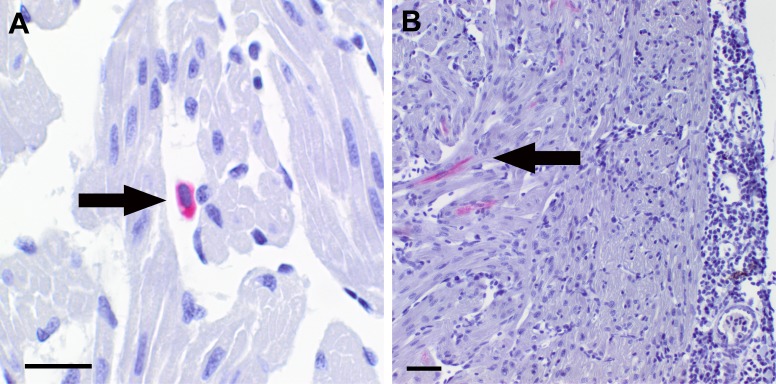
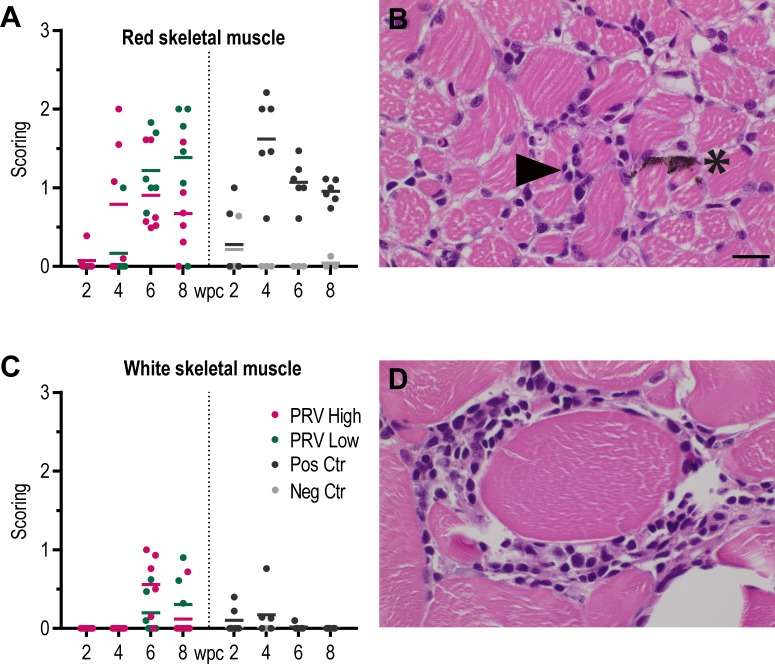
Viral diseases pose a significant threat to the productivity in aquaculture. Heart- and skeletal muscle inflammation (HSMI) is an emerging disease in Atlantic salmon (Salmo salar) farming. HSMI is associated with Piscine orthoreovirus (PRV) infection, but PRV is ubiquitous in farmed Atlantic salmon and thus present also in apparently healthy individuals. This has brought speculations if additional etiological factors are required, and experiments focusing on the causal relationship between PRV and HSMI are highly warranted. A major bottleneck in PRV research has been the lack of cell lines that allow propagation of the virus. To bypass this, we propagated PRV in salmon, bled the fish at the peak of the infection, and purified virus particles from blood cells. Electron microscopy, western blot and high-throughput sequencing all verified the purity of the viral particles. Purified PRV particles were inoculated into naïve Atlantic salmon. The purified virus replicated in inoculated fish, spread to naïve cohabitants, and induced histopathological changes consistent with HSMI. PRV specific staining was demonstrated in the pathological lesions. A dose-dependent response was observed; a high dose of virus gave earlier peak of the viral load and development of histopathological changes compared to a lower dose, but no difference in the severity of the disease. The experiment demonstrated that PRV can be purified from blood cells, and that PRV is the etiological agent of HSMI in Atlantic salmon.


Conflict of interest statement

Competing Interests: The authors have declared that no competing interests exist.

Figures

Fig 1
Fig 1. In vivo propagation of PRV and selection of samples with high viral load.
Viral loads in blood cells and plasma from 4 to 8 weeks post PRV challenge (wpc) in a cohabitation challenge experiment. (A) Blood cells: PRV RNA measured by RT-qPCR, shown as individual and mean Ct-values. (B) Blood cells: Amount of σ1- (left Y axis) and μNS-protein (right Y-axis) measured by flow cytometry, shown as mean fluorescence intensity (MFI) for individual fish and group mean. (C) Plasma: PRV RNA measured by RT-qPCR, shown as individual and mean Ct-values. Color coding: samples selected for PRV purification colored red (A, B: blood cells) or orange (C: plasma). At 7 wpc, two samplings were performed, referred to as 7 and 7* respectively.
Fig 2
Fig 2. Gradient purification, electron micrographs and immunogold labeling of PRV.
(A) Virus band (arrow) detected after CsCl gradient centrifugation. (B) Reovirus-like particles detected by transmission electron microscopy with outer diameter of about 70 nm and inner electron dense core of 39 nm diameter. Scale bar 100 nm. (C) Immunogold labeling of PRV σ1-protein and (D) σ3-protein, both detected in the outer capsid. Scale bar 100 nm.
Fig 3
Fig 3. Phylogenetic analysis.
Phylogenetic analysis of concatenated coding sequences from nine PRV genomes available in GenBank. The tree was constructed using maximum likelihood and the T92+G model of nucleotide substitution. Bootstrap support for all branches are indicated. PRV-2 was chosen as outgroup. Strain from present study in bold.
Fig 4
Fig 4. PRV genome and major structural proteins.
(A) PRV genomic segments visualized by electrophoresis of RNA extracted from purified PRV, obtained from pelleted blood cells (blood) and plasma, resulting in five separate bands in three molecular weight classes, suggesting co-migration of L1-L3, M1/M3, M2, S2 and S1/S3/S4. Length of each segment as determined by high throughput sequencing is shown on the right. Ladder from 500–6000 bp on the left. (B) PRV particles purified from plasma analyzed by western blotting using protein specific antibodies detecting σ1, σ3, μ1 and λ1 at their predicted full-length size (arrowheads) of 34.6 kDa, 37.0 kDa, 74.2 kDa and 141.5 kDa, respectively. A rabbit antiserum raised against purified PRV particles (PRV) detected the putative full-length μ1 protein in addition to one or both of the σ1- σ3-proteins.
Fig 5
Fig 5. Analysis of blood from injected fish in challenge experiment #2.
(A) Blood cells, (B) Plasma: PRV RNA measured by RT-qPCR, shown as individual and mean Ct-values from 2 to 8 weeks post challenge (wpc) (C) Amount of σ1-protein in blood cells measured by flow cytometry, shown as mean fluorescence intensity (MFI) for individual fish and group mean. (D) The results from one individual at 2, 4 and 6wpc from PRV-Low (green) and negative control (grey) groups are presented to illustrate the staining pattern. The fluorescence intensity on X-axis and cell count on y-axis, counting 30 000 cells per sample. (E) Fluorescent labeling of the PRV ơ1-protein (green) in blood cells at 4wpc from PRV-Low. Nuclei stained with Hoechst (blue). The results from μNS staining are presented as for σ1; (F, G) Flow cytometry, (H) Immunofluoresence staining observed by IF microscopy. Statistical analysis comparing PRV-High and PRV-Low was performed using Mann-Whitney test at each time point, *p < 0.05, asterisk color (red and green) indicate the significantly higher group (n = 6).
Fig 6
Fig 6. Expression of innate antiviral genes in blood cells in challenge experiment #2.
Relative expression of type I interferon (IFNab) (A) and Mx (B) in controls (grey), the PRV-High (red) and the PRV-Low (green) group (n = 6). Target Ct values are normalized against the expression level of elongation factor (EF)1α, and fold induction relative to the mean level of control fish (0 wpc) is shown. Statistical analysis comparing PRV-High and PRV-Low was performed using Mann-Whitney test at each time point, *p < 0.05, asterisk color (red and green) indicate the significantly higher group.
Fig 7
Fig 7. Analysis of PRV RNA in fish injected in challenge experiment #2.
(A) Heart, (B) Skeletal muscle, (C) Spleen. PRV RNA measured by RT-qPCR, shown as individual Ct-values and mean from 2 to 8 week post challenge (wpc). PRV-High shown in red, PRV-Low in green and the positive control group in black (n = 6). Statistical analysis comparing PRV-High and PRV-Low was performed using Mann-Whitney test at each time point, *p < 0.05, asterisk color (red and green) indicate the significantly higher group.
Fig 8
Fig 8. Histopathological lesions consistent with HSMI detected in the heart.
Histopathology in the heart of fish injected with purified PRV in challenge experiment #2. (A) Histopathological score shown as individual score (total cardiac score) and group mean from 2 to 8 weeks post challenge (wpc) for the PRV-High (red), PRV-Low (green), positive control (black) and negative control (grey) group (n = 6). Statistical analysis comparing PRV-High and PRV-Low was performed using Mann-Whitney test at each time point, *p < 0.05, asterisk color (red and green) indicate the significantly higher group. (B) Light microscopic images of cardiac histopathology in representative fish at 4, 6 and 8 wpc from PRV-High (red) and PRV-Low (green) to illustrate development of HSMI. Ventricle showing epicarditis and myocardial inflammation in the compact myocardium. Scale bar 20 μm.
Fig 9
Fig 9. Immunohistochemical detection of PRV in heart sections of infected fish.
Immunohistochemical staining of PRV in heart sections from the PRV-High group in challenge experiment #2, using σ1-antibodies. (A) Positive erythrocyte (arrow) detected at 2 wpc as even cytoplasmic staining (red). Scale bar 10 μm. (B) PRV antigen (red) detected in cardiomyotes (arrow) in the heart ventricle at 4 wpc. Scale bar 20 μm.
Fig 10
Fig 10. Histopathological lesions consistent with HSMI detected in skeletal muscle.
Histopathology in the skeletal muscle of fish injected with purified PRV in challenge experiment #2. (A) Histopathological score in red skeletal muscle shown as individual and mean score from 2 to 8 weeks post challenge (wpc) for the PRV-High (red), PRV-Low (green), positive control (black) and negative control (grey) group (n = 6). Statistical analysis comparing PRV-High and PRV-Low was performed using Mann-Whitney test at each time point, p < 0.05. No significant difference observed. (B) Light microscopic image of red skeletal muscle, 6 wpc, PRV-Low group. Mild myositis (arrowhead) and presence of melanin (*). Scale bar 10 μm. (C) Histopathological score in white skeletal muscle shown as individual and mean score, presented as for red skeletal muscle. (D) Cross section of white skeletal muscle, 6 wpc, PRV–High; Mild inflammation around white muscle fiber.
Fig 11
Fig 11. Summary cohabitant group.
(A) PRV RNA in blood cells and heart measured by RT-qPCR, shown as individual and mean Ct-values from 2 to 8 weeks post challenge (wpc). (B) Amount of σ1- and μNS -protein measured by flow cytometry, shown as mean fluorescence intensity (MFI) for individual fish and group mean. (C) Histopathological score in the heart (total cardiac score) and red skeletal muscle shown as individual and group mean from 4 to 8 wpc. (D) Light microscopic images at 8 wpc in PRV-Low; (D) Heart lesions in the ventrical including severe epicarditis (arrowhead) and inflammation in the compact (*) and spongy myocardium (**) consistent with HSMI. (E) Mild inflammation in the red skeletal muscle (arrowhead), presence of melanin (*). Scale bar 20 μm. Color coding: PRV-High (red), PRV-Low (green), positive control (black) and negative control (grey). n = 6.

Similar articles

Cited by

References

    1. Walker PJ, Winton JR. Emerging viral diseases of fish and shrimp. Vet Res. 2010;41(6):51 doi: 10.1051/vetres/2010022 - DOI - PMC - PubMed
    1. Kongtorp RT, Taksdal T, Lyngøy A. Pathology of heart and skeletal muscle inflammation (HSMI) in farmed Atlantic salmon Salmo salar. Dis Aquat Organ. 2004;59(3):217–24. doi: 10.3354/dao059217 - DOI - PubMed
    1. Kongtorp RT, Halse M, Taksdal T, Falk K. Longitudinal study of a natural outbreak of heart and skeletal muscle inflammation in Atlantic salmon, Salmo salar L. J Fish Dis. 2006;29(4):233–44. doi: 10.1111/j.1365-2761.2006.00710.x - DOI - PubMed
    1. Kongtorp RT, Kjerstad A, Taksdal T, Guttvik A, Falk K. Heart and skeletal muscle inflammation in Atlantic salmon, Salmo salar L.: a new infectious disease. J Fish Dis. 2004;27(6):351–8. doi: 10.1111/j.1365-2761.2004.00549.x - DOI - PubMed
    1. Palacios G, Løvoll M, Tengs T, Hornig M, Hutchison S, Hui J, et al. Heart and skeletal muscle inflammation of farmed salmon is associated with infection with a novel reovirus. PLoS One. 2010;5(7):e11487 doi: 10.1371/journal.pone.0011487 - DOI - PMC - PubMed

MeSH terms