. 2017 Sep 20;37(38):9222-9238.
doi: 10.1523/JNEUROSCI.1076-17.2017. Epub 2017 Aug 21.

Dedicated Hippocampal Inhibitory Networks for Locomotion and Immobility

Affiliations

Dedicated Hippocampal Inhibitory Networks for Locomotion and Immobility

Moises Arriaga et al. J Neurosci. .

Abstract

Network activity is strongly tied to animal movement; however, hippocampal circuits selectively engaged during locomotion or immobility remain poorly characterized. Here we examined whether distinct locomotor states are encoded differentially in genetically defined classes of hippocampal interneurons. To characterize the relationship between interneuron activity and movement, we used in vivo, two-photon calcium imaging in CA1 of male and female mice, as animals performed a virtual-reality (VR) track running task. We found that activity in most somatostatin-expressing and parvalbumin-expressing interneurons positively correlated with locomotion. Surprisingly, nearly one in five somatostatin or one in seven parvalbumin interneurons were inhibited during locomotion and activated during periods of immobility. Anatomically, the somata of somatostatin immobility-activated neurons were smaller than those of movement-activated neurons. Furthermore, immobility-activated interneurons were distributed across cell layers, with somatostatin-expressing cells predominantly in stratum oriens and parvalbumin-expressing cells mostly in stratum pyramidale. Importantly, each cell's correlation between activity and movement was stable both over time and across VR environments. Our findings suggest that hippocampal interneuronal microcircuits are preferentially active during either movement or immobility periods. These inhibitory networks may regulate information flow in "labeled lines" within the hippocampus to process information during distinct behavioral states.SIGNIFICANCE STATEMENT The hippocampus is required for learning and memory. Movement controls network activity in the hippocampus but it's unclear how hippocampal neurons encode movement state. We investigated neural circuits active during locomotion and immobility and found interneurons were selectively active during movement or stopped periods, but not both. Each cell's response to locomotion was consistent across time and environments, suggesting there are separate dedicated circuits for processing information during locomotion and immobility. Understanding how the hippocampus switches between different network configurations may lead to therapeutic approaches to hippocampal-dependent dysfunctions, such as Alzheimer's disease or cognitive decline.

Keywords: behavior; calcium imaging; circuits; hippocampus; interneurons; virtual reality.


Figures

Figure 1.
Figure 1.
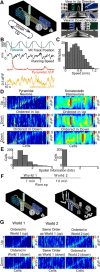
Experimental setup. A, Schematic of imaging configuration. Inset, Schematic of imaged area in CA1. ETL rapidly switches focal plane. Different curvatures of the ETL alter laser divergence resulting in different focal plane depths (represented by different colors). For simplicity, the ETL is shown above the objective. In reality, it is in the excitation light path, before the laser scanners, and does not impinge on the collection pathway. B, Sample in vivo imaging planes from animals with all neurons labeled with AAV-Syn-jRGECO1a or somatostatin interneurons labeled with cre-dependent AAV-Flex-Syn-GCaMP6f in somatostatin-cre mice. Four planes are imaged sequentially starting with the most dorsal plane and this sequence repeats until the end of the imaging session. Time shown is the elapsed time for one imaging cycle. Scale bar, 20 μm. C, Schematic of VR set up. Head-fixed mice can run freely on a spherical treadmill floating on a cushion of air. Ball movement is tracked by an optical computer mouse (data not shown) and fed into the VR engine, which updates the visual scene on a curved-screen computer monitor positioned in front of the animal.
Figure 2.
Figure 2.
Spatial activity of neurons and remapping in VR. A, Overview of VR track. Mice run to one end of the VR track and then to the opposite end to receive water rewards. Mice are restricted to the central corridor surrounded by local wall cues and distal landmarks. Arrows indicate up-direction and down-direction runs. Right, Monitor views in up and down directions. B, Data collected during VR behavior. Mouse position in VR track and timing of water rewards (transients). Ball speed during VR task. ΔF/F of jRGECO1a-labeled pyramidal neuron. ΔF/F of simultaneously recorded jRGECO1a-labeled interneuron. C, Binned distribution of ball speed for five mice during VR behavior. D, Top, Left, Heatmap of pyramidal neuron mean ΔF/F versus track position, specifically for up-direction runs. Each column represents the activity of an individual neuron. To generate the heatmap, ΔF/F in each spatial bin was summed and divided by occupancy time. Cell order is sorted by track position of peak ΔF/F. Reward zones at the ends of the track have been excluded. Top, Right, From a separate experiment, heatmap of somatostatin interneuron mean ΔF/F versus track position. Middle, Left, Heatmap of pyramidal neuron activity in down-direction runs, but with cell order set by up-direction runs. Note that spatial pattern of activity is lost, indicating direction-sensitive spatial activity of pyramidal neurons in this VR task. Middle, Right, Heatmap of somatostatin interneuron activity in down-direction runs, but with cell order set by up-direction runs. Bottom, Left, Pyramidal neuron heatmap in down-direction runs and sorted by position of peak ΔF/F. Bottom, Right, Somatostatin interneuron heatmap in down-direction runs and sorted by position of peak ΔF/F. E. Left, Distribution of spatial information from 479 pyramidal neurons in four mice. Right, Distribution of spatial information from 192 somatostatin interneurons from five mice. F, Timeline of remapping experiment. Animals spend 7 min in World 1, which is then instantaneously replaced with World 2, where they run for an additional 14 min. Data shown is after 4–5 d training in the remapping paradigm so animals are familiar with World 2. G, Top, Left, World 1 heatmap of pyramidal neuron mean ΔF/F versus track position, in up-direction runs. Top, Middle, World 2 heatmap for up-direction runs with same cell order as World 1. Note that spatial activity of neurons in World 1 is not maintained in World 2, indicating remapping. Top, Right, World 2 heatmap with cells sorted by World 2 spatial activity. Bottom, Left, World 1 heatmap of pyramidal neuron mean ΔF/F versus track position in down-direction runs. Bottom, Middle, World 2 heatmap in down-direction runs with same cell order as World 1. Bottom, Right, World 2 heatmap with cells sorted by World 2 spatial activity.
Figure 3.
Figure 3.
Activity correlation and anticorrelation in somatostatin interneurons. A, Left, Flex-Syn-GCaMP6f-labeled neurons in somatostatin-cre transgenic mouse. Right, ROIs overlaid on cells. Out-of-focus cells were analyzed in another plane (Fig. 1A, Plane 2). Scale bar, 20 μm. B, ΔF/F of five somatostatin interneurons shown in A while performing the VR track running task. Cell with activity anticorrelated to other cells in red trace. C, Correlation matrix of pairwise comparisons of ΔF/F for all somatostatin interneuron neurons from four imaging planes of a single experiment (single plane shown in A). Cells in matrix are ordered from most ventral plane first to most dorsal plane last with random ordering of cells within plane. D, Distribution of r values of pairwise comparisons of activity correlations from C (single experiment). Here and all other figures: significant correlations in dark gray; nonsignificant in white; overlap of significant and nonsignificant in light gray. E, Distribution of r values of pairwise comparisons of activity correlations for all somatostatin interneuron experiments (N = 5 mice). F, Left, Syn-jRGECO1a-labeled pyramidal neurons. Right, ROIs overlaid on five sample cells. Scale bar, 20 μm. G, ΔF/F of five pyramidal neurons shown in F. H, Correlation matrix of pairwise comparisons of ΔF/F for all pyramidal neurons from four imaging planes (single plane shown in F). Cells in matrix are ordered from most ventral plane first to most dorsal plane last with random ordering of cells within plane. I, Distribution of r values of activity correlation from H (single experiment). J, Distribution of r values of pairwise comparisons of activity correlations for all pyramidal neuron experiments (N = 3 mice).
Figure 4.
Figure 4.
Locomotion-activated and immobility-activated somatostatin interneurons. A, ΔF/F of five somatostatin interneurons from a single imaging plane, plotted with ball speed (top), VR position, and rewards (bottom). Right, Correlation plot of ΔF/F versus ball speed (binned to match the frame rate of imaging) for cells shown in A for entire imaging session. Line is linear regression. B, Five somatostatin interneurons from a single imaging plane from another mouse. C, ΔF/F-to-speed correlations for all cells from two mice shown in A and B. Colored bars match individual cells shown in A and B. Solid bar (either dark gray or colored) is a significant relationship, either correlation or anticorrelation. D, Distribution of activity-to-speed correlation r values for neurons in individual somatostatin-cre mice. E, Pooled distribution of activity-to-speed correlation r values for all somatostatin interneurons.
Figure 5.
Figure 5.
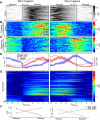
Somatostatin interneuron activity is organized at locomotion transitions. A, Transitions between immobility and movement were identified and used to align locomotion start-triggered and stop-triggered events in one experiment. Shown is the heatmap of ball speed over time for each detected event in one experiment. Left, Start-triggered events (immobile to moving). Right, Stop-triggered events (moving to immobile). Black line running through A–E marks time of locomotion transition. The same speed threshold was used for start-triggered and stop-triggered events (15 cm/s). B, ΔF/F heatmap for each start-triggered (left) or stop-triggered (right) event from a single cell with a positive activity-to-speed correlation. C, ΔF/F heatmap for each start-triggered (left) or stop-triggered (right) event from a cell with a negative activity-to-speed correlation. D, Line plot of average ΔF/F over all events for cells in B and C, plotted together with ball speed. Shaded area is SEM. E, Heatmap of mean ΔF/F over time during start-triggered and stop-triggered events for somatostatin interneurons from experiments with >10 start–stop transitions (166 of 192 neurons). Cells with positive activity-to-speed correlation are shown at top and negative activity-to-speed correlation at bottom. Within each class, neuron order is sorted from low to high magnitude of correlation or anticorrelation. Neuron order is the same for start-triggered and stop-triggered heatmaps. Red and blue arrows mark positively correlated cell shown in B, and negatively correlated cell in C, respectively. F, Comparison of mean ΔF/F (±SEM) between moving and stopped periods for all positively (red) and negatively (blue) correlated cells. *p ≤ 1.7 × 10⁻⁵.
Figure 6.
Figure 6.
Two functionally defined populations of somatostatin interneurons A, Left, Cross-correlation of ΔF/F versus ball speed during start-triggered events, for positively (red) and negatively (blue) correlated sample cells shown in Figure 5B,C. Numbers at peak or nadir of traces indicate cross-correlation lag of ΔF/F behind speed in seconds. The peak ΔF/F of the positively correlated cell lags behind speed by 0.8 s. The minimum ΔF/F of the negatively correlated cell precedes speed by 1 s in start-triggered events. Right, cross-correlation of stop-triggered events. B, Heatmap of the cross-correlation function of ΔF/F versus ball speed for somatostatin neurons. Cells are sorted in the same order as Figure 5E. Time 0 is the zero-lag correlation. Positively correlated cells have activity that peaks close to speed in time (yellow) while negatively correlated cells have activity minima near peak speed (blue). Red and blue arrows mark positively correlated cell shown in B, and negatively correlated cell in C, respectively. C, Rose plot of distribution of cells binned by phase angle (by Hilbert transform) of cross-correlation between activity and ball speed. Bars are color-coded by each cell's zero-lag correlation color map of cells in B, left. Positively correlated cells have activity that peaks shortly after speed, while negatively correlated cell activity peaks ∼180° out of phase. D, Linear distribution of C with cells binned from 0 to 180°, and then folding back over from 180 to 360/0°. The overlaid trace is the kernel density probability estimate of distribution, which smooths histogram bins.
Figure 7.
Figure 7.
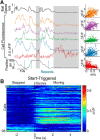
Activity during immobility is not tied to rewards. A, Example of activity in neurons during pauses in movement >4 s after rewards (shaded boxes). B, Locomotion start-triggered events that were >4 s from a reward were identified. Rasters of mean ΔF/F during these events for cells with >10 events are shown.
Figure 8.
Figure 8.
Locomotion-activated and immobility-activated parvalbumin (PV) interneurons. A, ΔF/F of five sample parvalbumin interneurons plotted with ball speed (top), VR position, and rewards (bottom). Right, Correlation plot of ΔF/F versus ball speed. Line is linear regression. B, ΔF/F-to-speed correlations for all cells from mouse shown in A. Colored bars match individual cells shown in A. Solid bar (either dark gray or colored) is a significant relationship, either correlation or anticorrelation. C, Distribution of activity-to-speed correlation r values for neurons in individual parvalbumin-cre mice. D, Distribution of activity-to-speed correlation r values for all parvalbumin interneurons. E, Left, Heatmap of mean of ΔF/F over time, during start-triggered events for parvalbumin interneurons from experiments with >10 start–stop transitions (64 of 125 neurons). Cells with positive activity-to-speed correlation shown at top and negative activity-to-speed correlation at bottom. Within each class, neuron order is sorted from low to high magnitude of correlation or anticorrelation. Right, Heatmap of mean of ΔF/F over time, during stop-triggered events. Neuron order is the same for start-triggered and stop-triggered heatmaps. F, Comparison of mean ΔF/F (±SEM) between moving and stopped periods for all positively (red) and negatively (blue) correlated cells. *p ≤ 9.7 × 10⁻⁴. G, Left, Heatmap of the cross-correlation function of ΔF/F versus ball speed in start-triggered events for parvalbumin neurons shown in E. Cells are sorted in the same order as E. Time 0 is the zero-lag correlation. Positively correlated cells have activity that peaks close to speed in time (yellow), while negatively correlated cells have activity minima near peak speed (blue). Right, Heatmap of the cross-correlation function of ΔF/F versus ball speed in stop-triggered events. H, Rose plot of distribution of cells binned by phase angle (by Hilbert transform) of cross-correlation between activity and ball speed. Bars are color-coded by zero-lag correlation color map of cells in F. Positively correlated cells have activity that peaks shortly before speed, while negatively correlated cell activity peaks ∼180° out of phase.
Figure 9.
Figure 9.
Anatomical distribution and somatic morphology of positively and negatively correlated neurons. A. Left, Anti-somatostatin immunofluorescence in coronal section from WT mouse. Right, Anti-parvalbumin immunofluorescence in coronal section from WT mouse. B, Left, GCaMP-labeled neurons from somatostatin-cre mouse (coronal section in fixed tissue). Note that SP is dark, indicating the lack of GCaMP-labeled axons targeting cell somata. Right, GCaMP-labeled neurons from parvalbumin-cre mouse. Scale bar, 40 μm. C, Distribution of cell bodies across cell layers comparing anti-somatostatin immunofluorescence (black) to GCaMP-labeled cells (green). For comparisons in CF, distributions of GCaMP-labeled cells were taken directly from imaging datasets, not post hoc fixed tissue. Cell location was scored by examining imaging planes to see whether cells were in contact with SP, along with detailed z series of imaged cells taken in vivo (z steps of 3 μm through the imaged areas). Differences in C–F were tested by Wilcoxon rank sum, with Bonferroni correction. D, Distribution of cell bodies in cell layers from GCaMP-labeled cells in somatostatin-cre animals comparing positively correlated cells (red) to negatively correlated cells (blue). E, Distribution of cell bodies across cell layers comparing anti-parvalbumin immunofluorescence (black) to GCaMP-labeled cells (green). F, Distribution of cell bodies across cell layers from GCaMP-labeled cells in parvalbumin-cre animals comparing positively correlated cells (red) to negatively correlated cells (blue). G, Plot of mean activity correlation versus distance for pairs of somatostatin neurons, either all possible pairs (All, black) or pairs restricted to the positively correlated population (Positive, red). There was no significant relationship between activity correlation and distance, tested with Spearman's rank correlation, for either all pairs of somatostatin neurons, or just the positively correlated population. H, Plot of mean activity correlation versus distance for pairs of parvalbumin neurons, either all possible pairs (All, black) or pairs restricted to the positively correlated population (Positive, red). There was a significant relationship between activity correlation and distance, with closer cell pairs having more similar activity than distant pairs, for all pairs of parvalbumin neurons and for just the positively correlated population. *p = 0.0002. I, Left, Imaging plane of somatostatin interneurons. Right, Somatic ROIs color-coded by activity correlation to speed, with positive correlations in red and negative correlations in blue. ROIs shown here are used to calculate morphology comparisons in J. J, Comparison of cross-sectional area of somatostatin somata between positively correlated and negatively correlated neurons. Areas of somata of negatively correlated somatostatin interneurons were significantly smaller. *p = 0.025. All error bars are ±SEM.
Figure 10.
Figure 10.
Cellular correlation between activity and locomotion is stable. A, Top, Imaging planes of same somatostatin cells imaged over 5 consecutive days. Scale bar, 20 μm. Middle, Somata of cells above, color-coded by activity correlation to ball speed over 5 d. Red is positive correlation; blue is negative. Bottom, ΔF/F correlation to speed for all cells in sample experiment, over 5 d. Cell order is the same across all days. B, Scatter plot of ΔF/F correlation to speed for all cells comparing day 1 to all other days. Inset, Histogram shows distribution of differences between each cell's correlation value between days. Bin size, 0.05. C, Left, Schematics of World 1 and World 2. Middle, Somata of cells color-coded by activity correlation to ball speed in World 1 and World 2. Red is positive correlation, blue is negative. Scale bar, 20 μm. Right, ΔF/F correlation to speed for all cells in sample experiment, in World 1 and World 2. Cell order is the same across worlds. D, Scatter plot of ΔF/F correlation to speed for all cells comparing World 1 to World 2. Inset, Histogram shows distribution of differences between each cell's correlation value between worlds. Bin size, 0.05.

References

    1. Acsády L, Görcs TJ, Freund TF (1996) Different populations of vasoactive intestinal polypeptide-immunoreactive interneurons are specialized to control pyramidal cells or interneurons in the hippocampus. Neuroscience 73:317–334. 10.1016/0306-4522(95)00609-5 - DOI - PubMed
    1. Aghajan ZM, Acharya L, Moore JJ, Cushman JD, Vuong C, Mehta MR (2015) Impaired spatial selectivity and intact phase precession in two-dimensional virtual reality. Nat Neurosci 18:121–128. 10.1038/nn.3884 - DOI - PubMed
    1. Ahmed OJ, Mehta MR (2012) Running speed alters the frequency of hippocampal gamma oscillations. J Neurosci 32:7373–7383. 10.1523/JNEUROSCI.5110-11.2012 - DOI - PMC - PubMed
    1. Aronov D, Tank DW (2014) Engagement of neural circuits underlying 2D spatial navigation in a rodent virtual reality system. Neuron 84:442–456. 10.1016/j.neuron.2014.08.042 - DOI - PMC - PubMed
    1. Bargmann CI, Marder E (2013) From the connectome to brain function. Nat Methods 10:483–490. 10.1038/nmeth.2451 - DOI - PubMed

Publication types

LinkOut - more resources