. 2017 Sep 27;37(39):9361-9379.
doi: 10.1523/JNEUROSCI.0084-17.2017. Epub 2017 Aug 21.

Repulsive Guidance Molecule a (RGMa) Induces Neuropathological and Behavioral Changes That Closely Resemble Parkinson's Disease

Affiliations

Repulsive Guidance Molecule a (RGMa) Induces Neuropathological and Behavioral Changes That Closely Resemble Parkinson's Disease

Joanna A Korecka et al. J Neurosci. .

Abstract

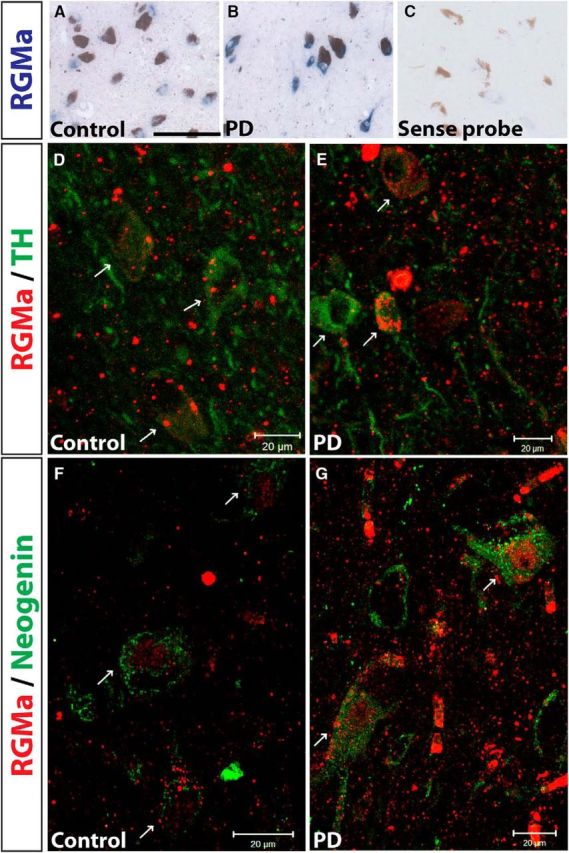
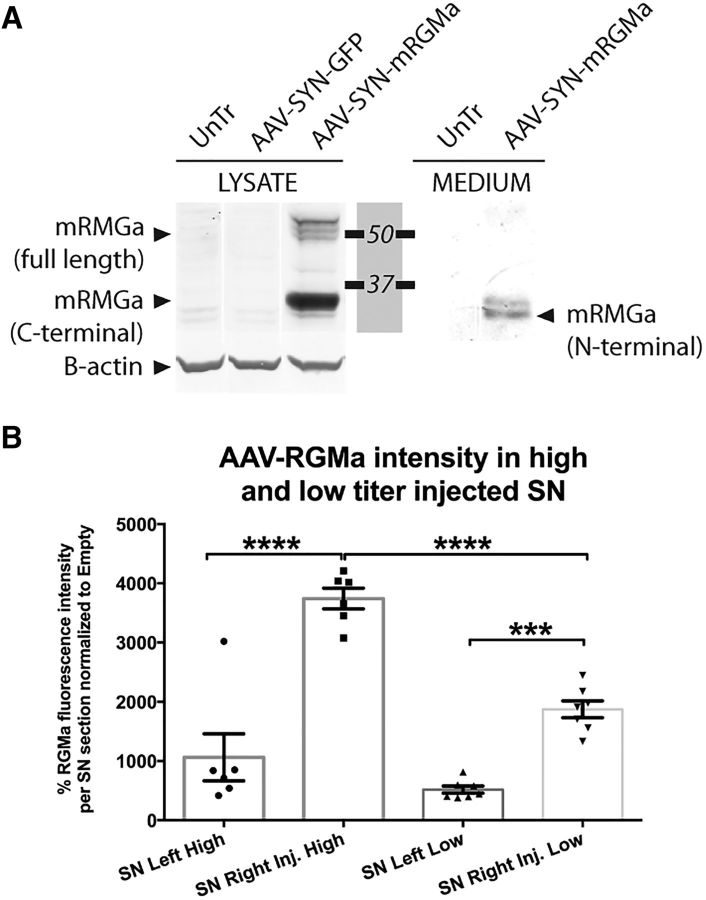
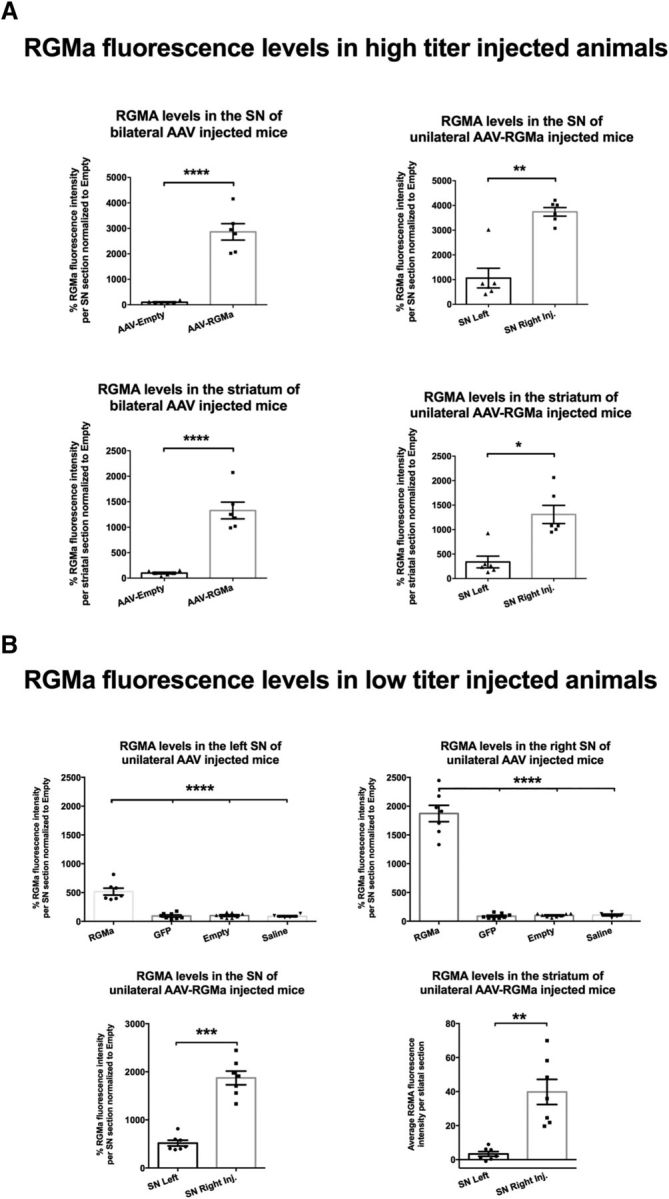
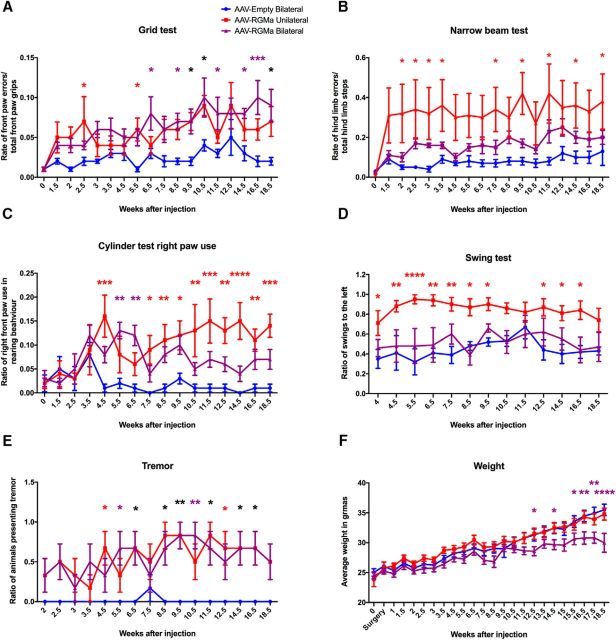
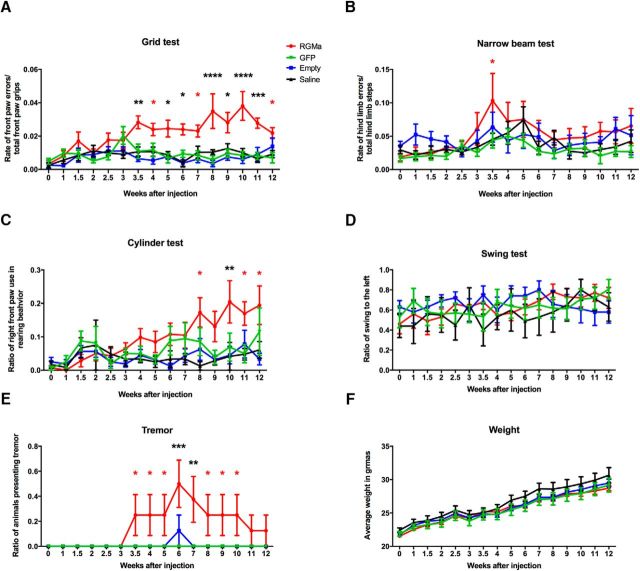
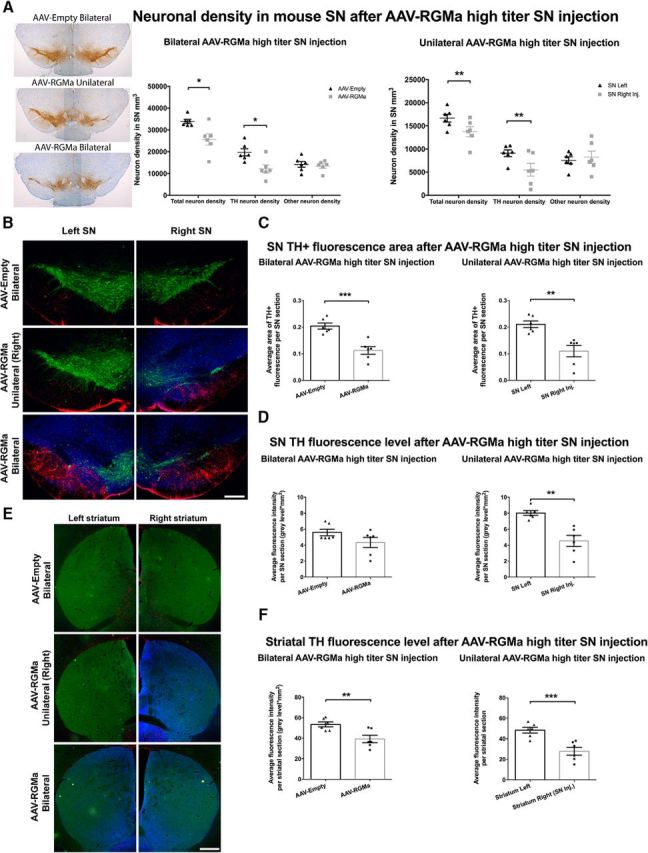
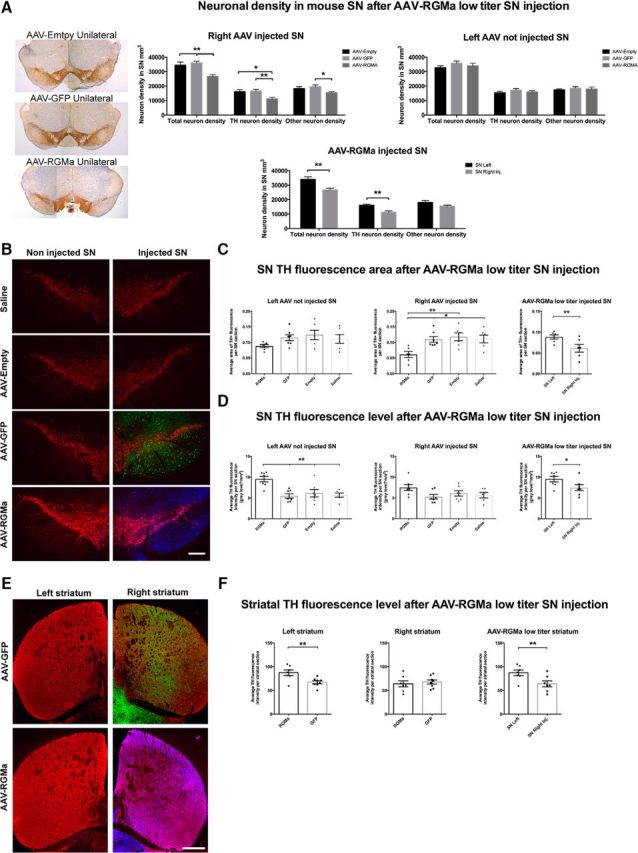
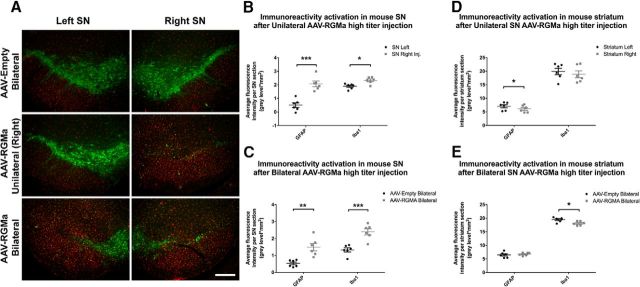
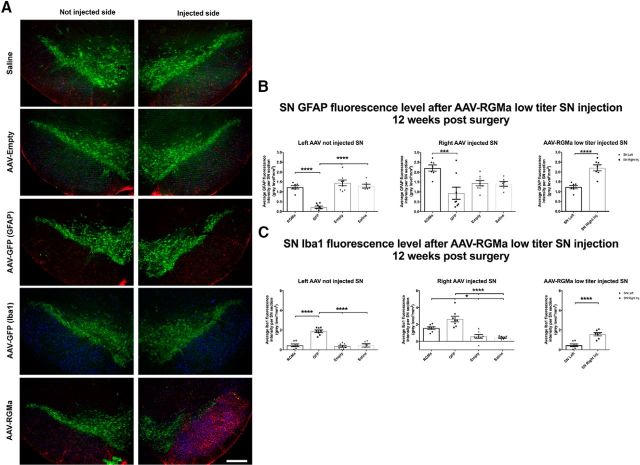
Repulsive guidance molecule member a (RGMa) is a membrane-associated or released guidance molecule that is involved in axon guidance, cell patterning, and cell survival. In our previous work, we showed that RGMa is significantly upregulated in the substantia nigra of patients with Parkinson's disease. Here we demonstrate the expression of RGMa in midbrain human dopaminergic (DA) neurons. To investigate whether RGMa might model aspects of the neuropathology of Parkinson's disease in mouse, we targeted RGMa to adult midbrain dopaminergic neurons using adeno-associated viral vectors. Overexpression of RGMa resulted in a progressive movement disorder, including motor coordination and imbalance, which is typical for a loss of DA release in the striatum. In line with this, RGMa induced selective degeneration of dopaminergic neurons in the substantia nigra (SN) and affected the integrity of the nigrostriatal system. The degeneration of dopaminergic neurons was accompanied by a strong microglia and astrocyte activation. The behavioral, molecular, and anatomical changes induced by RGMa in mice are remarkably similar to the clinical and neuropathological hallmarks of Parkinson's disease. Our data indicate that dysregulation of RGMa plays an important role in the pathology of Parkinson's disease, and antibody-mediated functional interference with RGMa may be a disease modifying treatment option.SIGNIFICANCE STATEMENT Parkinson's disease (PD) is a neurodegenerative disease characterized by severe motor dysfunction due to progressive degeneration of mesencephalic dopaminergic (DA) neurons in the substantia nigra. To date, there is no regenerative treatment available. We previously showed that repulsive guidance molecule member a (RGMa) is upregulated in the substantia nigra of PD patients. Adeno-associated virus-mediated targeting of RGMa to mouse DA neurons showed that overexpression of this repulsive axon guidance and cell patterning cue models the behavioral and neuropathological characteristics of PD in a remarkable way. These findings have implications for therapy development as interfering with the function of this specific axon guidance cue may be beneficial to the survival of DA neurons.

Keywords: AAV-mediated overexpression; Parkinson's disease; RGMa; dopamine neuron degeneration.


Figures

Figure 1.
Figure 1.
RGMa is expressed in human dopaminergic neurons in the SN of both control subjects and PD patients. A–C, In situ hybridization for human RGMa mRNA (blue staining) is exclusively present in cellular structures morphologically identified as neurons (large cells with a nucleolus in the center of the nucleus) in a control (A) and PD patient (B). Note the absence of staining in the sense probe (C). Most neurons contained neuromelanin (brown pigmentation), indicating their DA phenotype (best visible in C). Sections were used from the following NBB donors: control 00–049 (A), PD 02–064 (B), and control 00–050 (C). Scale bar, 0.1 mm. D, E, Immunofluorescent staining for RGMa protein (red; antibody SC-46482) in the SN of control (D) and PD (E) brains is mainly localized to DA neurons counterstained for TH (green). Arrows point to TH+ neurons also positive for punctate RGMa protein expression. Sections were used from NBB donors: control 98–126 and PD 00–115. F, G, Immunohistochemical staining for RGMA protein (red) and its receptor neogenin (green) in control (F) and PD (G) SN tissue. Arrows point to neogenin-positive neurons also showing punctate RGMa protein expression. Sections were used from NBB donors: control 00–142 and PD 02–003. Scale bar, 20 μm.
Figure 2.
Figure 2.
AAV vectors direct RGMa expression and secretion in a neuronal cell line and dose-dependent expression in the mouse brain. A, AAV plasmid-mediated overexpression of mouse RGMa in N2A cells results in the production and secretion of RGMa protein. N2A cells were either untreated (UnTr) or transfected with the expression plasmids pAAV-SYN-GFP or pAAV-SYN-mRGMa. Anti-mouse RGMa antibody (R&D Systems, AF2458) was used to detect mouse RGMa protein in the cell lysate (LYSATE samples) or the culture medium (MEDIUM samples) 3 d after transfection. N2A cells produce mouse RGMa after transfection of the expected molecular weight: multiple bands are visible ∼49–55 kDa representing the full-length form, and one prominent band at 33 kDa representing the cleaved membrane bound C-terminal form. RGMa is also released from the transfected N2A cells, which results in the N-terminal 30 kDa form of RGMa in the medium samples. β-actin was used as loading control. B, Comparison of RGMa protein levels in the SN of mouse injected with a high titer (9.0 × 10¹² gc/ml) and low titer (3.0 × 10¹² gc.ml). The RGMa fluorescence was twice as high in the high-titer-injected mice compared with the low-titer-injected mice (p < 0.0001, F(3,22) = 41.21). Data are represented in percentages of RGMa fluorescence levels relative to the AAV-Empty RGMa. Tissue from 6 mice was quantified in the high-titer treatment group, and from 7–8 mice in low-titer treatment group. Example images used for the quantification of RGMa are shown in Figure 6B (high-dose experiment) and Figure 7B (low-dose experiment). Statistical analysis was performed using one-way ANOVA with Tukey's post hoc multiple testing correction: ***p < 0.001; ****p < 0.0001. All data are expressed as mean with bars representing SEM.
Figure 3.
Figure 3.
AAV vectors drive RGMa expression and secretion in the mouse brain. A, Quantification of the percentage of RGMa fluorescence intensity in SN and the striatum of the bilateral and unilateral high-titer-injected animals. RGMa protein levels were significantly increased in the injected SN compared with AAV-Empty-injected (p < 0.0001) and noninjected SN (p = 0.003). Similarly, striatal RGMa levels were significantly higher in the bilaterally AAV-RGMa-injected animals compared with the AAV-Empty-injected animals (p < 0.0001) and in the ipsilateral striatum versus the contralateral striatum of the unilaterally AAV-RGMa-injected animals (p = 0.0126). B, Quantification of RGMA fluorescence intensity in SN and striatum in low-titer AAV-RGMa-injected animals. The percentage of RGMa fluorescence intensity was significantly increased in the right SN injected with AAV-RGMa and, to a smaller extent, in the left noninjected SN, compared with all control groups (GFP, saline, or Empty, SN right, p < 0.0001, F(3,25) = 159.0; SN left, p < 0.0001, F(3,25) = 42.9). Both striatal (p = 0.001) and SN (p = 0.0001) levels of RGMa were significantly higher on the right transduced side of the nigrostriatal tract. Data are represented in percentages of fluorescence relative to the AAV-Empty RGMa fluorescence. For representative images of the RGMa immunohistochemical stained mouse SN and striatum, see Figures 6B, E and 7B, E. Tissue from 6 mice was measured in the high-titer treatment group, and from 7–8 mice in low-titer treatment group. Statistical analysis was performed using Student's t test and one-way ANOVA with Tukey's post hoc multiple testing correction: *p < 0.05; **p < 0.01; ***p < 0.001; ****p < 0.0001. All data are expressed as mean with bars representing SEM.
Figure 4.
Figure 4.
High-dose AAV-mediated overexpression of RGMa in the mouse SN results in a progressive and severe induction of motor deficits. A, Grid test performance showed a progressive increase of front paw placement errors in both unilateral (red) and bilateral (purple) RGMa-overexpressing mice compared with the AAV-Empty-injected animals (blue) (p < 0.0001, F(2,270) = 46.52). Starting at week 2.5 after surgery, RGMa-overexpressing mice displayed significantly higher error rates compared with the control with variations at different time points (see colored asterisks). B, Hindlimb placement measurements on the narrow beam test showed significant increase in the number of hindpaw placement errors between the injection groups (p < 0.0001, F(2,270) = 49.97) with post hoc test indicating unilaterally RGMa-injected mice to develop an increase in hindlimb slips compared with the AAV-Empty-injected animals (red asterisks). C, Preference of bilateral or unilateral front paw use was measured by a cylinder test. The ratio of single right paw use during rearing over total rearing events was determined (p < 0.0001, F(2,240) = 46.96). Both bilateral and unilateral RGMa-overexpressing mice showed increased right paw use at different time points compared with the AAV-Empty control group. D, The swing test revealed a significant difference between the injected groups (p < 0.0001, F(2,195) = 57.19), with an increase in the rotation preference toward the left in animals injected unilaterally with AAV-RGMa compared with AAV-Empty animals. Animals receiving a bilateral injection of AAV-RGMa or AAV-Empty did not develop a swing preference over time. E, Increased events of tremor were observed during the time of the experiment in the RGMa-overexpressing mice (p < 0.0001, F(2,240) = 55.58), with both unilaterally and bilaterally injected RGMa animals compared with the AAV-Empty-injected animals starting from week 4.5 onwards. F, Mice bilaterally overexpressing RGMa showed a significant decrease in body weight toward the end of the experiment (p < 0.0001, F(2,360) = 42.86). For all tests, week 0 is the baseline measurement performed 2 d before the AAV injection. Each treatment group consists of 6 animals. Statistical analysis was performed with a two-way ANOVA with Tukey's post hoc multiple testing correction: *p < 0.05; **p < 0.01; ***p < 0.001; ****p < 0.0001. Within each panel, different colored asterisks indicate significance between different treatment groups compared with the AAV-Empty group: black asterisks, both RGMa groups; red asterisks, unilateral RGMa group; purple asterisks, bilateral RGMa group. All data are expressed as mean with bars representing SEM.
Figure 5.
Figure 5.
Low-dose AAV-mediated overexpression of RGMa in the mouse SN results in a mild but progressive induction of motor behavioral deficits. A, A significant increase in front paw placement errors was observed in the grid test in the RGMa group (red) compared with the three control groups (AAV-Empty, blue; AAV-GFP, green; and saline, black) (p < 0.0001, F(3,400) = 61.31). Post hoc testing showed an increase in error rates in RGMa-overexpressing mice from 3.5 weeks after surgery compared with all three control groups (black asterisks) with some variation at different testing time points (red asterisks). B, Hindlimb placement was measured by the narrow beam test. Mice treated with AAV-RGMa showed small but significant increased error rate in this test compared with the controls (p = 0.0002, F(3,416) = 6.586). C, Preference of bilateral or unilateral front paw use was measured in a cylinder test. The ratio of right paw use over total rearing events was determined. RGMa-overexpressing mice progressively increased their preference for only right paw use compared with control groups (p < 0.0001, F(3,375) = 12.37). Post hoc testing indicated more right paw use in RGMa animals compared with either one or two control treatment groups (red asterisks) or to all control groups (black asterisk) starting from 8 weeks after surgery. D, The swing test revealed no significant differences in the rotation preference of the mice between any of the treatment groups. E, Tremor was observed in RGMa-overexpressing mice (p < 0.0001, F(3,416) = 20.71) starting at 3.5 weeks after surgery. F, None of the treatment groups showed any significant differences in weight gain. For all tests, week 0 is the baseline measurement performed 2 d before the AAV injection. Each treatment group includes 7–8 animals per quantification, with the saline group containing 6 animals. Statistical analysis was performed with a two-way ANOVA with Tukey's post hoc multiple testing correction: *p < 0.05; **p < 0.01; ***p < 0.001; ****p < 0.0001. All data are expressed as mean with bars representing SEM.
Figure 6.
Figure 6.
High-dose AAV-mediated overexpression of RGMa in the mouse SN induces a decline in the number of DA neurons and affects TH expression in the surviving neurons. A, Quantification of the neuronal density in the SN in AAV-Empty (bilateral), AAV-RGMa (unilateral), and AAV-RGMa (bilateral) injected SN. Bilateral RGMa overexpression resulted in a decrease in both the total (24%, p = 0.0136) and TH+ (38%, p = 0.012) neuronal density in the SN compared with the AAV-Empty bilateral injected SN (total SN neuron count combined from both SN). Unilateral AAV-RGMa-mediated overexpression also induced a significant decrease in total number of neurons (18%, p = 0.004) and in TH+ neurons (40%, p = 0.0072) in the right-injected SN compared with the left, noninjected SN. Other (TH) neuronal profiles were not affected by RGMa overexpression. B, Immunohistochemical staining for TH (green), GFAP (red), and RGMa (blue) in mouse SN injected with AAV-Empty (bilateral), AAV-RGMA (unilateral), and AAV-RGMA (bilateral). C, Quantification of TH fluorescence-positive area in the SN. Bilateral overexpression of RGMa in the SN is associated with a decrease of TH+ area in the SN compared with bilateral AAV-Empty-injected SN (p = 0.0005; values from both left and right SN are pooled). TH fluorescence area in the right SN of animals unilaterally injected with AAV-RGMa is also decreased compared with the left, noninjected SN (p = 0.0026). D, Quantification of TH fluorescence levels in the SN. Despite the TH+ neuronal loss, TH fluorescence intensity is not significantly different in the SN of animals bilaterally injected with AAV-RGMa compared with the AAV-Empty-injected animals (p = 0.1261). In the unilaterally AAV-RGMa-injected animals, the left, noninjected SN shows a significant increase in TH fluorescence intensity compared with the right injected SN (p = 0.006), suggesting a compensatory mechanism. E, Immunohistochemical staining for TH (green), GFAP (red), and RGMa (blue; antibody SC-46482) in the striatum following the transduction of the SN with AAV-Empty (bilateral), AAV-RGMa (unilateral), and AAV-RGMa (bilateral). RGMa protein is shown to be transported from the transduced SN to the nigrostriatal projection target sites in the striatum. F, Quantification of TH fluorescence levels in the striatum. Overexpression of RGMa in the SN is associated with a decrease in TH fluorescence intensity in the striatum in bilateral RGMa injection paradigm compared with the AAV-Empty-injected animals (p = 0.0085). Similarly, the striatal TH intensity levels are decreased in the right striatum of the right SN-injected animals compared with the left striatum (p = 0.0004). Each treatment group includes 6 animals per quantification. Statistical analysis was performed using Student's t test: *p < 0.05; **p < 0.01; ***p < 0.001. Scale bars: B, 0.25 mm; E, 0.5 mm. All data are expressed as mean with bars representing SEM.
Figure 7.
Figure 7.
Low-dose AAV-mediated overexpression of RGMa induced a decline in DA neurons and increase in TH protein levels indicative of a compensation mechanism. A, Quantification of the neuronal density in AAV-Empty, AAV-GFP, and AAV-RGMa-injected and noninjected SN. RGMa overexpression resulted in a decrease in both the total (23% and 26%) and TH+ (30% and 33%) neuronal density in the AAV-RGMa-injected SN compared with the AAV-Empty and AAV-GFP injected SN (total neurons: p = 0.0015, F(2,19) = 9.318; TH neurons: p = 0.0041, F(2,19) = 7.449). TH neurons were generally not affected by RGMa overexpression, with an exception compared with AAV-GFP-injected SN (p = 0.0488, F(2,19) = 3.555). Total and TH+ neuronal density was significantly decreased in the AAV-RGMa-injected SN compared with the not injected SN (p = 0.0029 and p = 0.0018, respectively). B, Immunohistochemical staining for TH (red), GFP (green), and RGMa (blue) in the SN injected with saline, AAV-Empty, AAV-GFP, or AAV-RGMA virus. C, Quantification of TH+ area in the SN. The TH+ area was significantly decreased in the SN injected with AAV-RGMa compared with all control groups (p = 0.0063, F(3,21) = 5.44) as well as to the contralateral (noninjected) SN of the RGMa-treated animals (p = 0.0073). D, Quantification of TH fluorescence levels in the SN. Overexpression of RGMa in the SN is associated with an increase in TH fluorescence in the noninjected contralateral SN compared with all control groups (p = 0.0006, F(3,23) = 8.3). TH fluorescence intensity in the AAV-RGMa-injected SN is not altered compared with the control treatment groups. E, Immunohistochemical staining for TH (red), GFP (green), and RGMa (blue; antibody SC-46482) in the striatum following the transduction of the SN with AAV-GFP or AAV-RGMa. Both GFP and RGMa protein is transported from the injected (right) SN to the nigrostriatal projection target sites in the right striatum. F, Quantification of TH fluorescence intensity in the striatum. Overexpression of RGMa in the SN is associated with an increase in TH fluorescence intensity in the left contralateral striatum compared with the AAV-GFP control striatum (p = 0.0082) and compared with the right AAV-RGMa striatum (p = 0.0037). TH fluorescent levels in the right striatum were not different in the AAV-RGMa group compared with all three control treatment groups (p = 0.6139). Each treatment group includes 7–8 animals per quantification, with the saline group containing 6 animals. Statistical analysis was performed using one-way ANOVA with Tukey's post hoc multiple testing correction and Student's t test: *p < 0.05; **p < 0.01; ***p < 0.001; ****p < 0.0001. All data are expressed as mean with bars representing SEM. Scale bars: B, 0.25 mm; E, 0.5 mm.
Figure 8.
Figure 8.
High-dose AAV-mediated overexpression of RGMa in the mouse SN induced a gliotic response. A, Immunohistochemical staining for TH (green) and Iba1 (red) in the SN injected with high-titer AAV-Empty bilaterally, AAV-RGMa unilaterally, and AAV-RGMa bilaterally. Scale bar, 0.25 mm. Immunohistochemical stanining for GFAP (red) in the injected SN has been visualized in Fig. 6B. B, Quantification of fluorescence signal in the SN of mice receiving a unilateral injection of high-titer AAV-RGMa. GFAP and Iba1 fluorescence intensities are increased in the AAV-RGMa-injected (right) SN compared with the noninjected (left) SN. C, Quantification of fluorescence signal in the SN of mice receiving a bilateral injection of high-titer AAV-Empty or the AAV-RGMa viral vector. GFAP and Iba1 intensities are increased in the AAV-RGMa-injected SN compared with the AAV-Empty-injected animals. Fluorescence intensities from right and left SN were averaged across both SN to provide the total fluorescence intensity per entire SN in each bilateral AAV treatment. D, Quantification of fluorescence signal in the striatum of mice receiving a unilateral injection of high-titer AAV-RGMa in the SN. GFAP fluorescence intensity is slightly decreased in the right (injected) striatum compared with the left (p = 0.027). We observed no differences in Iba1 levels between the two hemispheres. E, Quantification of fluorescence signal in the striatum of mice receiving a bilateral injection of high-titer AAV-Empty or AAV-RGMa virus in the SN. We observed no differences in GFAP fluorescence intensities between the two groups. Iba1 fluorescence intensity is slightly decreased in the striatum of AAV-RGMa-injected mice compared with the AAV-Empty-injected animals (p = 0.015). Fluorescence intensities from right and left striata were averaged across both striata to provide the total fluorescence intensity per AAV treatment. Each treatment group includes 6 animals per quantification. Statistical analysis was performed using Student's t test: *p < 0.05; **p < 0.01; ***p < 0.001. All data are expressed as mean with bars representing SEM.
Figure 9.
Figure 9.
Low-dose AAV-mediated overexpression of RGMa induced a gliotic response. A, Immunohistochemical staining for TH (green), GFAP (red), and Iba1 (blue) in mouse SN injected with saline, AAV-Empty, AAV-GFP, or AAV-RGMA. The two panels represent the injected and noninjected SN for each animal. Because of a limitation of the available number of fluorescence channels, two series of SN tissue were used for animals injected with AAV-GFP: one to stain for GFAP and one to stain for Iba1. B, Quantification of GFAP fluorescence signal in the SN 12 weeks after injection. Overexpression of RGMa in the SN is associated with an increase in GFAP fluorescence intensity in the injected SN compared with the AAV-GFP group (p = 0.0020, F(3,25) = 6.583) and to the noninjected SN in AAV-RGMa-treated animals (p < 0.0001). GFAP fluorescence is decreased in the noninjected SN of AAV-GFP-treated animals compared with the noninjected SN of the AAV-RGMa, AAV-Empty, and saline-treated groups (p < 0.0001, F(3,25) = 32.97). C, Quantification of Iba1 fluorescence signal in the SN 12 weeks after injection. Overexpression of RGMa in the SN is associated with an increase in Iba1 fluorescence intensity in the injected SN compared with the contralateral noninjected SN in RGMA-treated animals (p < 0.0001), as well as to the injected SN of the AAV-Empty and saline-treated animals (p < 0.0001, F(3,25) = 19.66). Iba1 fluorescence is significantly increased in both SN of animals injected with AAV-GFP compared with both SN of AAV-RGMa, AAV-Empty, and saline-treated animals (not injected SN, p < 0.0001, F(3,25) = 35.26; injected SN, p < 0.0001, F(3,25) = 19.66). AAV-RGMa treatment group consists of 7 animals, AAV-GFP and AAV-Empty consist of 8 animals per group, and the saline treatment group contains 6 animals. Statistical analysis was performed using one-way ANOVA with Tukey's post hoc multiple testing correction and Student's t test: *p < 0.05; **p < 0.01; ***p < 0.001; ****p < 0.0001. Scale bars, 0.25 mm. All data are expressed as mean with bars representing SEM.
Figure 10.
Figure 10.
Akt and pAkt levels in SN DA neurons upon high-dose RGMa overexpression. A, Quantification of Akt and pAkt fluorescence signal in the SN DA neurons. Overexpression of RGMa in the SN is not associated with an increase in either the total Akt or the Ser473 phosphorylated Akt (pAkt) fluorescence intensity in the DA neurons of the AAV-RGMa-injected animals compared with AAV-Empty group (p = 0.174 and p = 0.333, respectively). Total Akt analysis was performed on 6 animals in the AAV-Empty-injected group and 4 animals in the AAV-RGMa-injected group. PhosphoAkt analysis was performed on 6 animals in the AAV-Empty-injected group and 5 animals in the AAV-RGMa-injected group. B, Quantification of pAkt fluorescence signal in the SN DA neurons corrected for the total Akt signal. Overexpression of RGMa in the SN is not associated with an increase in pAkt fluorescence intensity in the DA neurons of the AAV-RGMa-injected animals compared with AAV-Empty group (p = 0.895). PhosphoAkt analysis was performed on 6 animals in the AAV-Empty-injected group and 4 animals in the AAV-RGMa-injected group. Statistical analysis was performed using Student's t test. All data are expressed as mean with bars representing SEM.

Similar articles

Cited by

References

    1. Bao AM, Hestiantoro A, Van Someren EJ, Swaab DF, Zhou JN (2005) Colocalization of corticotropin-releasing hormone and oestrogen receptor-alpha in the paraventricular nucleus of the hypothalamus in mood disorders. Brain 128:1301–1313. 10.1093/brain/awh448 - DOI - PubMed
    1. Barcia C, Fernández Barreiro A, Poza M, Herrero MT (2003) Parkinson's disease and inflammatory changes. Neurotox Res 5:411–418. 10.1007/BF03033170 - DOI - PubMed
    1. Barrett T, Wilhite SE, Ledoux P, Evangelista C, Kim IF, Tomashevsky M, Marshall KA, Phillippy KH, Sherman PM, Holko M, Yefanov A, Lee H, Zhang N, Robertson CL, Serova N, Davis S, Soboleva A (2013) NCBI GEO: archive for functional genomics data sets–update. Nucleic Acids Res 41:D991–D995. - PMC - PubMed
    1. Bossers K, Meerhoff G, Balesar R, van Dongen JW, Kruse CG, Swaab DF, Verhaagen J (2009) Analysis of gene expression in Parkinson's disease: possible involvement of neurotrophic support and axon guidance in dopaminergic cell death. Brain Pathol 19:91–107. 10.1111/j.1750-3639.2008.00171.x - DOI - PMC - PubMed
    1. Braak H, Del Tredici K, Rüb U, de Vos RA, Jansen Steur EN, Braak E (2003) Staging of brain pathology related to sporadic Parkinson's disease. Neurobiol Aging 24:197–211. 10.1016/S0197-4580(02)00065-9 - DOI - PubMed

Publication types

MeSH terms