

Photoacoustic imaging for in vivo quantification of placental oxygenation in mice
- PMID: 28842425
- PMCID: PMC5690392
- DOI: 10.1096/fj.201700047RR
Photoacoustic imaging for in vivo quantification of placental oxygenation in mice
Abstract
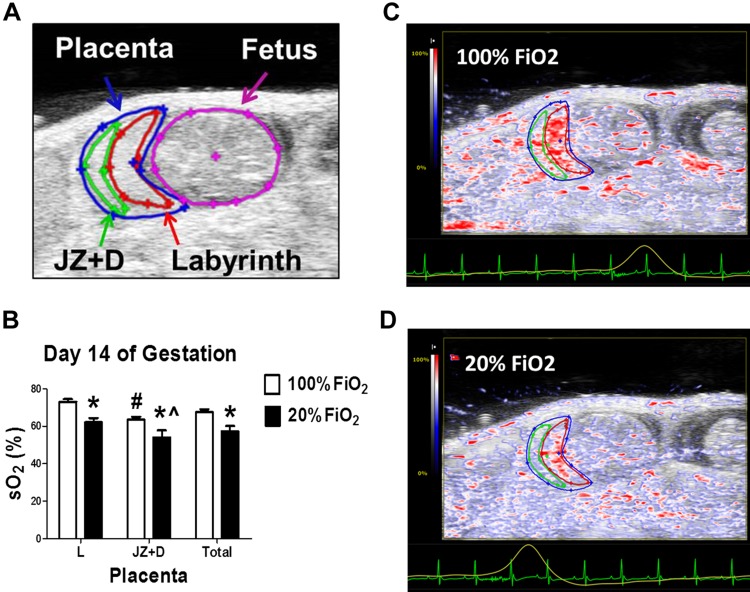
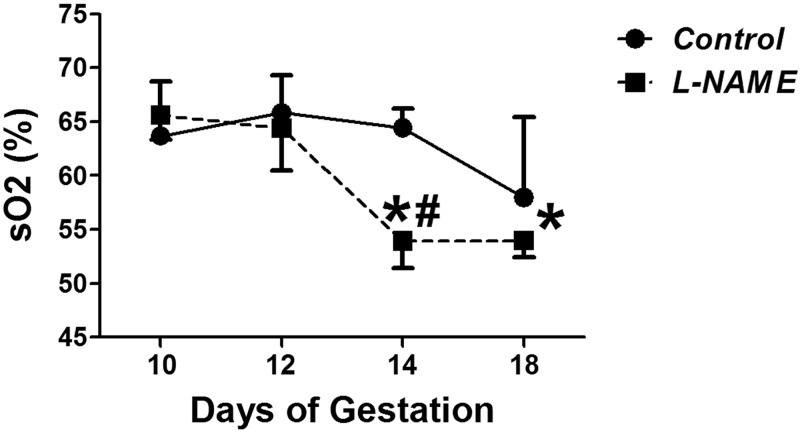
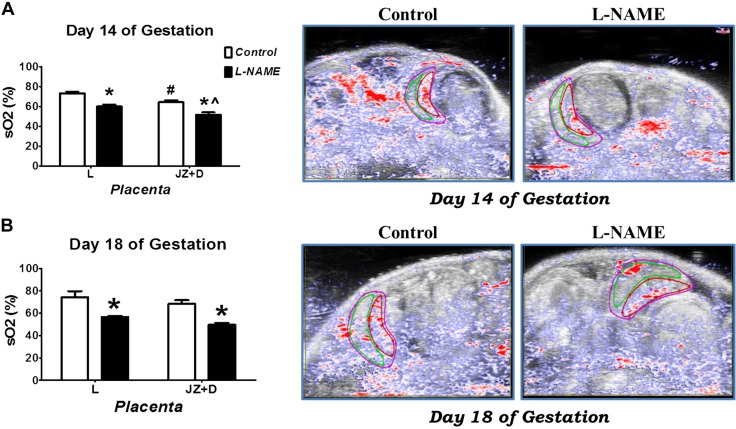
Accurate analysis of placental and fetal oxygenation is critical during pregnancy. Photoacoustic imaging (PAI) combines laser technology with ultrasound in real time. We tested the sensitivity and accuracy of PAI for analysis of placental and fetal oxygen saturation (sO2) in mice. The placental labyrinth (L) had a higher sO2 than the junctional zone plus decidua region (JZ+D) in C57Bl/6 mice. Changing maternal O2 from 100 to 20% in C57Bl/6 mice lowered sO2 in these regions. C57Bl/6 mice were treated with the NO synthase inhibitor L-NG-nitroarginine methyl ester (L-NAME) from gestational day (GD) 11 to GD18 to induce hypertension. L-NAME decreased sO2 in L and JZ+D at GD14 and GD18 in association with fetal growth restriction and higher blood pressure. Hypoxia-inducible factor 1α immunostaining was higher in L-NAME vs control mice at GD14. Fetal sO2 levels were similar between l-NAME and control mice at GD14 and GD18. In contrast to untreated C57Bl/6, L-NAME decreased placental sO2 at GD14 and GD18 vs GD10 or GD12. Placental sO2 was lower in fetal growth restriction in an angiotensin-converting enzyme 2 knockout mouse model characterized by placental hypoxia. On phantom studies, patterns of sO2 measured directly correlated with those measured by PAI. In summary, PAI enables the detection of placental and fetal oxygenation during normal and pathologic pregnancies in mice.-Yamaleyeva, L. M., Sun, Y., Bledsoe, T., Hoke, A., Gurley, S. B., Brosnihan, K. B. Photoacoustic imaging for in vivo quantification of placental oxygenation in mice.
Keywords: HIF-1α; fetal growth restriction; hypertensive pregnancy; oxygen saturation; placental hypoxia.
© FASEB.
Figures


Similar articles
-
Spectral photoacoustic imaging to estimate in vivo placental oxygenation during preeclampsia.Sci Rep. 2019 Jan 24;9(1):558. doi: 10.1038/s41598-018-37310-2. Sci Rep. 2019. PMID: 30679723 Free PMC article.
-
Use of Photoacoustic Imaging to Study the Effects of Anemia on Placental Oxygen Saturation in Normoxic and Hypoxic Conditions.Reprod Sci. 2024 Apr;31(4):966-974. doi: 10.1007/s43032-023-01395-6. Epub 2023 Nov 27. Reprod Sci. 2024. PMID: 38012522
-
Inflammation-induced fetal growth restriction in rats is associated with increased placental HIF-1α accumulation.PLoS One. 2017 Apr 19;12(4):e0175805. doi: 10.1371/journal.pone.0175805. eCollection 2017. PLoS One. 2017. PMID: 28423052 Free PMC article.
-
Beyond oxygen: complex regulation and activity of hypoxia inducible factors in pregnancy.Hum Reprod Update. 2010 Jul-Aug;16(4):415-31. doi: 10.1093/humupd/dmp046. Epub 2009 Nov 19. Hum Reprod Update. 2010. PMID: 19926662 Free PMC article. Review.
-
Oxygen and lack of oxygen in fetal and placental development, feto-placental coupling, and congenital heart defects.Birth Defects Res. 2018 Dec 1;110(20):1517-1530. doi: 10.1002/bdr2.1430. Birth Defects Res. 2018. PMID: 30576091 Review.
Cited by
-
Photoacoustic-Ultrasound Tomography: A New Window into Developmental Toxicity.Environ Health Perspect. 2022 Apr;130(4):44003. doi: 10.1289/EHP11126. Epub 2022 Apr 21. Environ Health Perspect. 2022. PMID: 35446675 Free PMC article.
-
Non-invasive determination of murine placental and foetal functional parameters with multispectral optoacoustic tomography.Light Sci Appl. 2019 Aug 14;8:71. doi: 10.1038/s41377-019-0181-7. eCollection 2019. Light Sci Appl. 2019. PMID: 31666944 Free PMC article.
-
Spectral photoacoustic imaging to estimate in vivo placental oxygenation during preeclampsia.Sci Rep. 2019 Jan 24;9(1):558. doi: 10.1038/s41598-018-37310-2. Sci Rep. 2019. PMID: 30679723 Free PMC article.
-
New Frontiers in Placenta Tissue Imaging.EMJ Radiol. 2020 Sep;1(1):54-62. doi: 10.33590/emjradiol/19-00210. EMJ Radiol. 2020. PMID: 35949207 Free PMC article.
-
Photoacoustic imaging of the human placental vasculature.J Biophotonics. 2020 Apr;13(4):e201900167. doi: 10.1002/jbio.201900167. Epub 2019 Nov 25. J Biophotonics. 2020. PMID: 31661594 Free PMC article.
References
-
- World Health Organization (2016) World health statistics 2016: monitoring health for the SDGs. WHO, Geneva, Switzerland
-
- Heazell A. E., Worton S. A., Higgins L. E., Ingram E., Johnstone E. D., Jones R. L., Sibley C. P. (2015) IFPA Gábor Than Award Lecture: Recognition of placental failure is key to saving babies’ lives. Placenta 36(Suppl 1), S20–S28 - PubMed
-
- Kaur J., Kaur K. (2012) Conditions behind fetal distress. Annals of Biological Research 3, 4845–4851
Publication types
MeSH terms
Substances
Grants and funding
LinkOut - more resources
Full Text Sources
Other Literature Sources
Molecular Biology Databases
