

Multicohort analysis reveals baseline transcriptional predictors of influenza vaccination responses
- PMID: 28842433
- PMCID: PMC5800877
- DOI: 10.1126/sciimmunol.aal4656
Multicohort analysis reveals baseline transcriptional predictors of influenza vaccination responses
Abstract
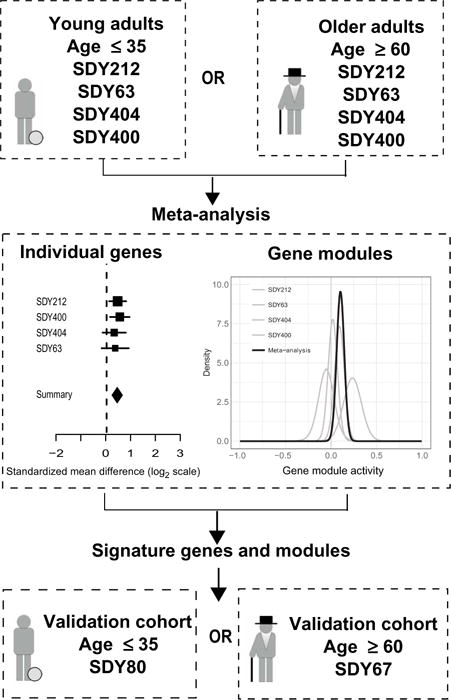
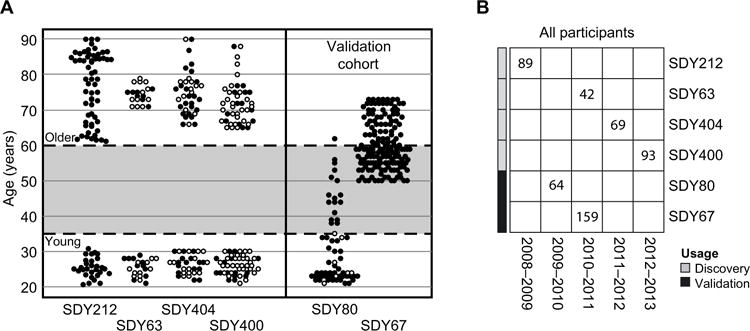
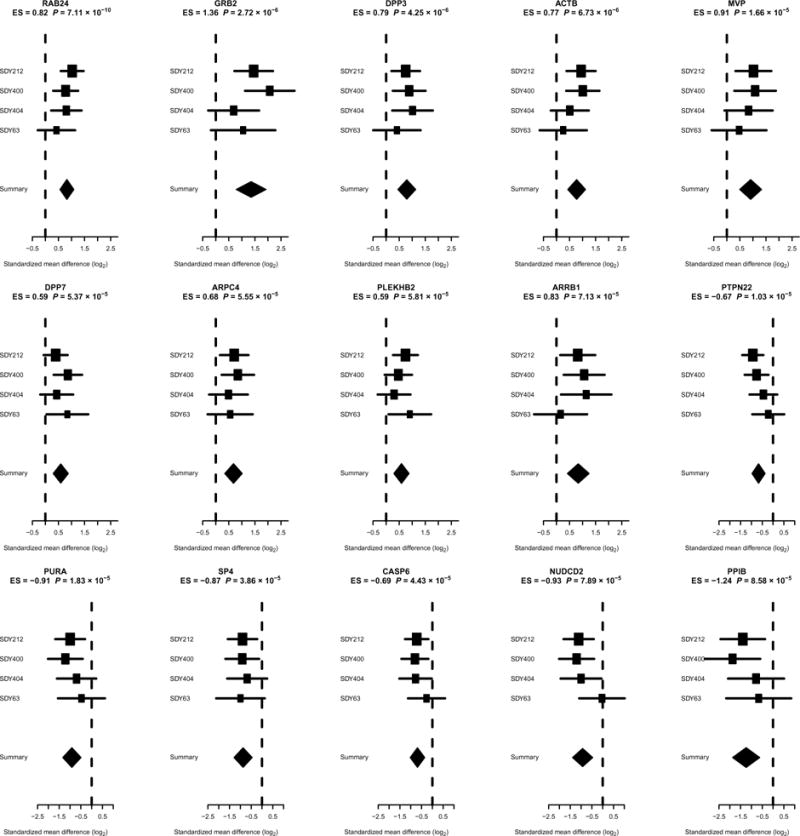
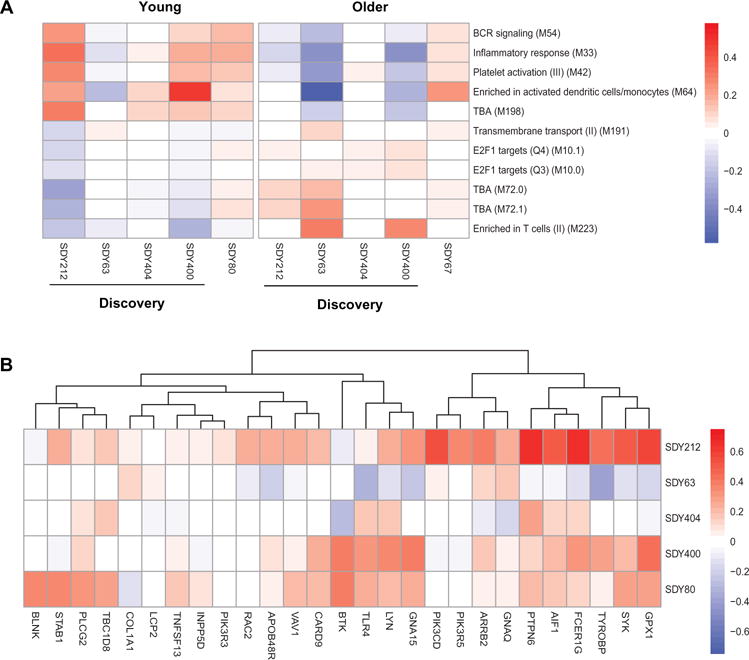
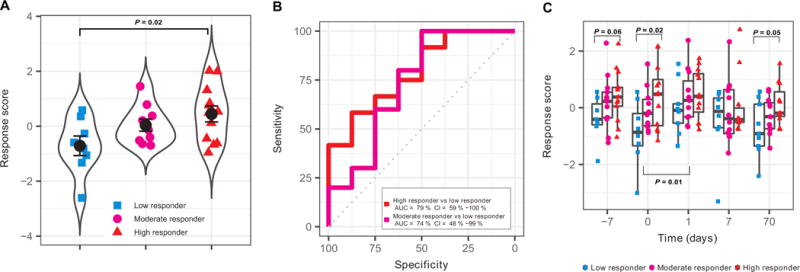
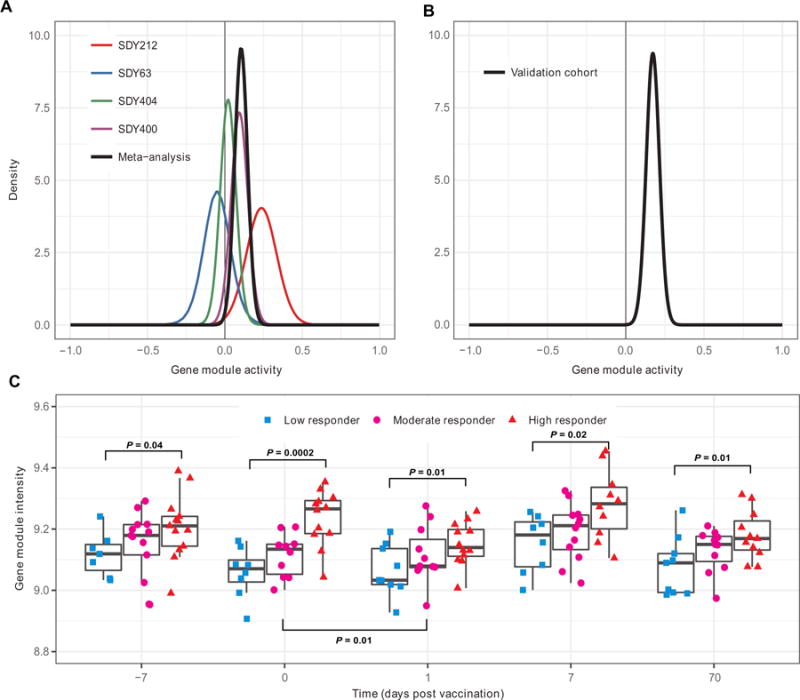
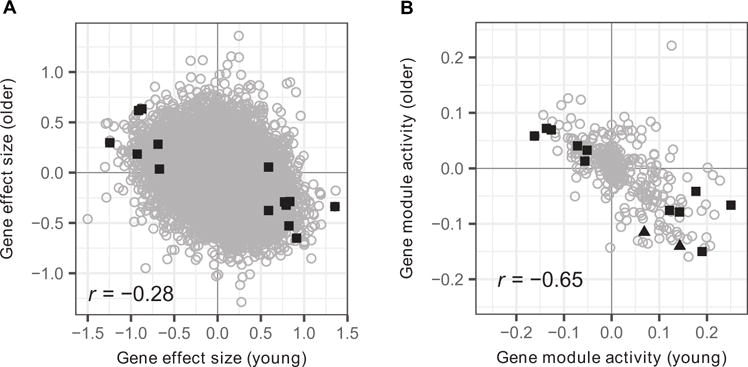
Annual influenza vaccinations are currently recommended for all individuals 6 months and older. Antibodies induced by vaccination are an important mechanism of protection against infection. Despite the overall public health success of influenza vaccination, many individuals fail to induce a substantial antibody response. Systems-level immune profiling studies have discerned associations between transcriptional and cell subset signatures with the success of antibody responses. However, existing signatures have relied on small cohorts and have not been validated in large independent studies. We leveraged multiple influenza vaccination cohorts spanning distinct geographical locations and seasons from the Human Immunology Project Consortium (HIPC) and the Center for Human Immunology (CHI) to identify baseline (i.e., before vaccination) predictive transcriptional signatures of influenza vaccination responses. Our multicohort analysis of HIPC data identified nine genes (RAB24, GRB2, DPP3, ACTB, MVP, DPP7, ARPC4, PLEKHB2, and ARRB1) and three gene modules that were significantly associated with the magnitude of the antibody response, and these associations were validated in the independent CHI cohort. These signatures were specific to young individuals, suggesting that distinct mechanisms underlie the lower vaccine response in older individuals. We found an inverse correlation between the effect size of signatures in young and older individuals. Although the presence of an inflammatory gene signature, for example, was associated with better antibody responses in young individuals, it was associated with worse responses in older individuals. These results point to the prospect of predicting antibody responses before vaccination and provide insights into the biological mechanisms underlying successful vaccination responses.
Copyright © 2017 The Authors, some rights reserved; exclusive licensee American Association for the Advancement of Science. No claim to original U.S. Government Works.
Conflict of interest statement
Figures
Similar articles
-
Seasonal Variability and Shared Molecular Signatures of Inactivated Influenza Vaccination in Young and Older Adults.J Immunol. 2020 Mar 15;204(6):1661-1673. doi: 10.4049/jimmunol.1900922. Epub 2020 Feb 14. J Immunol. 2020. PMID: 32060136 Free PMC article.
-
Metabolomic and transcriptomic signatures of influenza vaccine response in healthy young and older adults.Aging Cell. 2022 Sep;21(9):e13682. doi: 10.1111/acel.13682. Epub 2022 Aug 23. Aging Cell. 2022. PMID: 35996998 Free PMC article.
-
T Cell Transcriptional Signatures of Influenza A/H3N2 Antibody Response to High Dose Influenza and Adjuvanted Influenza Vaccine in Older Adults.Viruses. 2022 Dec 11;14(12):2763. doi: 10.3390/v14122763. Viruses. 2022. PMID: 36560767 Free PMC article. Clinical Trial.
-
Predictive signatures of immune response to vaccination and implications of the immune setpoint remodeling.mSphere. 2025 Feb 25;10(2):e0050224. doi: 10.1128/msphere.00502-24. Epub 2025 Jan 24. mSphere. 2025. PMID: 39853092 Free PMC article. Review.
-
Human genetics and responses to influenza vaccination: clinical implications.Am J Pharmacogenomics. 2004;4(5):293-8. doi: 10.2165/00129785-200404050-00002. Am J Pharmacogenomics. 2004. PMID: 15462607 Review.
Cited by
-
Robust prediction of clinical outcomes using cytometry data.Bioinformatics. 2019 Apr 1;35(7):1197-1203. doi: 10.1093/bioinformatics/bty768. Bioinformatics. 2019. PMID: 30169745 Free PMC article.
-
Investigating the aetiology of adverse events following HPV vaccination with systems vaccinology.Cell Mol Life Sci. 2019 Jan;76(1):67-87. doi: 10.1007/s00018-018-2925-6. Epub 2018 Oct 16. Cell Mol Life Sci. 2019. PMID: 30324425 Free PMC article. Review.
-
Pre-vaccination transcriptomic profiles of immune responders to the MUC1 peptide vaccine for colon cancer prevention.medRxiv [Preprint]. 2024 May 10:2024.05.09.24305336. doi: 10.1101/2024.05.09.24305336. medRxiv. 2024. Update in: Front Immunol. 2024 Oct 10;15:1437391. doi: 10.3389/fimmu.2024.1437391. PMID: 38766010 Free PMC article. Updated. Preprint.
-
A pilot metabolomic study of drug interaction with the immune response to seasonal influenza vaccination.NPJ Vaccines. 2023 Jun 12;8(1):92. doi: 10.1038/s41541-023-00682-2. NPJ Vaccines. 2023. PMID: 37308481 Free PMC article.
-
Foundations for improved vaccine correlate of risk analysis using positive-unlabeled learning.Hum Vaccin Immunother. 2023 Dec 31;19(1):2204020. doi: 10.1080/21645515.2023.2204020. Epub 2023 May 3. Hum Vaccin Immunother. 2023. PMID: 37133899 Free PMC article.
References
-
- Osterholm MT, Kelley NS, Sommer A, Belongia EA. Efficacy and effectiveness of influenza vaccines: A systematic review and meta-analysis. Lancet Infect Dis. 2012;12:36–44. - PubMed
-
- Goodwin K, Viboud C, Simonsen L. Antibody response to influenza vaccination in the elderly: A quantitative review. Vaccine. 2006;24:1159–1169. - PubMed
-
- Thakar J, Mohanty S, West AP, Joshi SR, Ueda I, Wilson J, Meng H, Blevins TP, Tsang S, Trentalange M, Siconolfi B, Park K, Gill TM, Belshe RB, Kaech SM, Shadel GS, Kleinstein SH, Shaw AC. Aging-dependent alterations in gene expression and a mitochondrial signature of responsiveness to human influenza vaccination. Aging. 2015;7:38–52. - PMC - PubMed
Grants and funding
- R38 AI140299/AI/NIAID NIH HHS/United States
- U19 AI090023/AI/NIAID NIH HHS/United States
- U01 AI089859/AI/NIAID NIH HHS/United States
- U01 AI090043/AI/NIAID NIH HHS/United States
- T32 AI007517/AI/NIAID NIH HHS/United States
- U19 AI089986/AI/NIAID NIH HHS/United States
- U19 AI057229/AI/NIAID NIH HHS/United States
- U19 AI090019/AI/NIAID NIH HHS/United States
- U19 AI089992/AI/NIAID NIH HHS/United States
- U19 AI089987/AI/NIAID NIH HHS/United States
- U19 AI128914/AI/NIAID NIH HHS/United States
- K12 HL120001/HL/NHLBI NIH HHS/United States
LinkOut - more resources
Full Text Sources
Other Literature Sources
Research Materials
Miscellaneous
