Chimeric rabbit/human Fab antibodies against the hepatitis Be-antigen and their potential applications in assays, characterization, and therapy
- PMID: 28842495
- PMCID: PMC5633136
- DOI: 10.1074/jbc.M117.802272
Chimeric rabbit/human Fab antibodies against the hepatitis Be-antigen and their potential applications in assays, characterization, and therapy
Abstract
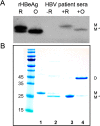
Hepatitis B virus (HBV) infection afflicts millions worldwide, causing cirrhosis and liver cancer. HBV e-antigen (HBeAg), a clinical marker for disease severity, is a soluble variant of the viral capsid protein. HBeAg is not required for viral replication but is implicated in establishing immune tolerance and chronic infection. The structure of recombinant e-antigen (rHBeAg) was recently determined, yet to date, the exact nature and quantitation of HBeAg still remain uncertain. Here, to further characterize HBeAg, we used phage display to produce a panel of chimeric rabbit/human monoclonal antibody fragments (both Fab and scFv) against rHBeAg. Several of the Fab/scFv, expressed in Escherichia coli, had unprecedentedly high binding affinities (Kd ∼10-12 m) and high specificity. We used Fab/scFv in the context of an enzyme-linked immunosorbent assay (ELISA) for HBeAg quantification, which we compared with commercially available kits and verified with seroconversion panels, the WHO HBeAg standard, rHBeAg, and patient plasma samples. We found that the specificity and sensitivity are superior to those of existing commercial assays. To identify potential fine differences between rHBeAg and HBeAg, we used these Fabs in microscale immunoaffinity chromatography to purify HBeAg from individual patient plasmas. Western blotting and MS results indicated that rHBeAg and HBeAg are essentially structurally identical, although HBeAg from different patients exhibits minor carboxyl-terminal heterogeneity. We discuss several potential applications for the humanized Fab/scFv.
Keywords: ELISA; Fab; antibody engineering; core antigen (HBcAg); e-antigen (HBeAg); hepatitis B virus (HBV, Hep B); phage display; single-domain antibody; surface plasmon resonance (SPR); viral immunology.
Conflict of interest statement
The authors declare that they have no conflicts of interest with the contents of this article
Figures


Similar articles
-
Production and characterization of monoclonal antibodies against hepatitis B e-antigen and their potential application for development of HBeAg detection ELISA.Biologicals. 2025 May;90:101819. doi: 10.1016/j.biologicals.2025.101819. Epub 2025 Jan 31. Biologicals. 2025. PMID: 39892062
-
Serological detection of hepatitis B viral infection by a panel of solid-phase enzyme-linked immunosorbent assays (ELISA).J Pharm Biomed Anal. 2004 Mar 1;34(4):811-22. doi: 10.1016/S0731-7085(03)00563-6. J Pharm Biomed Anal. 2004. PMID: 15019059
-
The impact of hepatitis B virus precore/core gene carboxyl terminal mutations on viral biosynthesis and the host immune response.J Infect Dis. 2014 May 1;209(9):1374-81. doi: 10.1093/infdis/jit638. Epub 2013 Nov 22. J Infect Dis. 2014. PMID: 24273041
-
[Molecular aspects of the seroconversion from HBeAg -->anti-Hbe in the course of type B viral hepatitis caused by mutant strains the virus].Pol Arch Med Wewn. 1997 May;97(5):473-9. Pol Arch Med Wewn. 1997. PMID: 9411426 Review. Polish. No abstract available.
-
[Mechanisms of hepatitis B e antigen seroconversion from the aspect of viral mutation].Nihon Rinsho. 2004 Aug;62 Suppl 8:93-7. Nihon Rinsho. 2004. PMID: 15453294 Review. Japanese. No abstract available.
Cited by
-
Capsids of hepatitis B virus e antigen with authentic C termini are stabilized by electrostatic interactions.FEBS Lett. 2020 Mar;594(6):1052-1061. doi: 10.1002/1873-3468.13706. Epub 2019 Dec 16. FEBS Lett. 2020. PMID: 31792961 Free PMC article.
-
Structures of Hepatitis B Virus Core- and e-Antigen Immune Complexes Suggest Multi-point Inhibition.Structure. 2018 Oct 2;26(10):1314-1326.e4. doi: 10.1016/j.str.2018.06.012. Epub 2018 Aug 9. Structure. 2018. PMID: 30100358 Free PMC article.
-
Virus Assembly Antagonists from Redesigned Antibodies.Structure. 2018 Oct 2;26(10):1297-1299. doi: 10.1016/j.str.2018.09.002. Structure. 2018. PMID: 30282016 Free PMC article.
-
Probing the Hepatitis B Virus E-Antigen with a Nanopore Sensor Based on Collisional Events Analysis.Biosensors (Basel). 2022 Aug 4;12(8):596. doi: 10.3390/bios12080596. Biosensors (Basel). 2022. PMID: 36004992 Free PMC article.
-
Phage Display Technology in Biomarker Identification with Emphasis on Non-Cancerous Diseases.Molecules. 2024 Jun 25;29(13):3002. doi: 10.3390/molecules29133002. Molecules. 2024. PMID: 38998954 Free PMC article. Review.
References
-
- Maini M. K., and Bertoletti A. (2017) HBV in 2016: Global and immunotherapeutic insights into hepatitis B. Nat. Rev. Gastroenterol. Hepatol. 14, 71–72 - PubMed
-
- Vanlandschoot P., and Leroux-Roels G. (2003) Viral apoptotic mimicry: an immune evasion strategy developed by the hepatitis B virus? Trends Immunol. 24, 144–147 - PubMed
-
- Brunetto M. R. (2010) A new role for an old marker, HBsAg. J. Hepatol. 52, 475–477 - PubMed
Publication types
MeSH terms
Substances
LinkOut - more resources
Full Text Sources
Other Literature Sources
Medical

