. 2017 Sep 29;292(39):16351-16359.
doi: 10.1074/jbc.M117.783936. Epub 2017 Aug 23.

The glycosyltransferase GnT-III activates Notch signaling and drives stem cell expansion to promote the growth and invasion of ovarian cancer

Affiliations

The glycosyltransferase GnT-III activates Notch signaling and drives stem cell expansion to promote the growth and invasion of ovarian cancer

Heba Allam et al. J Biol Chem. .

Abstract

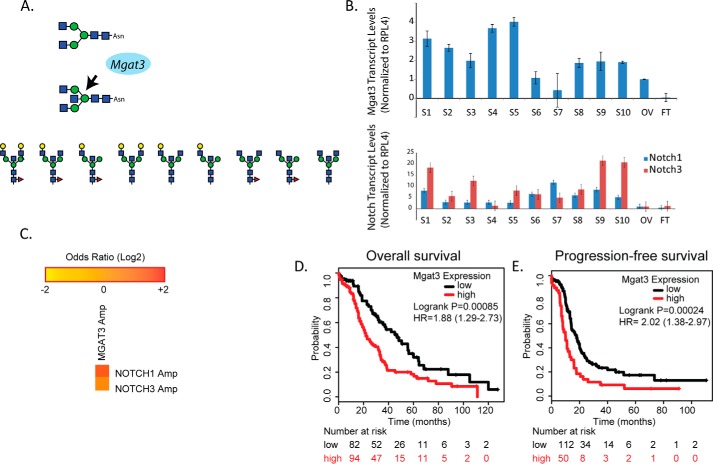
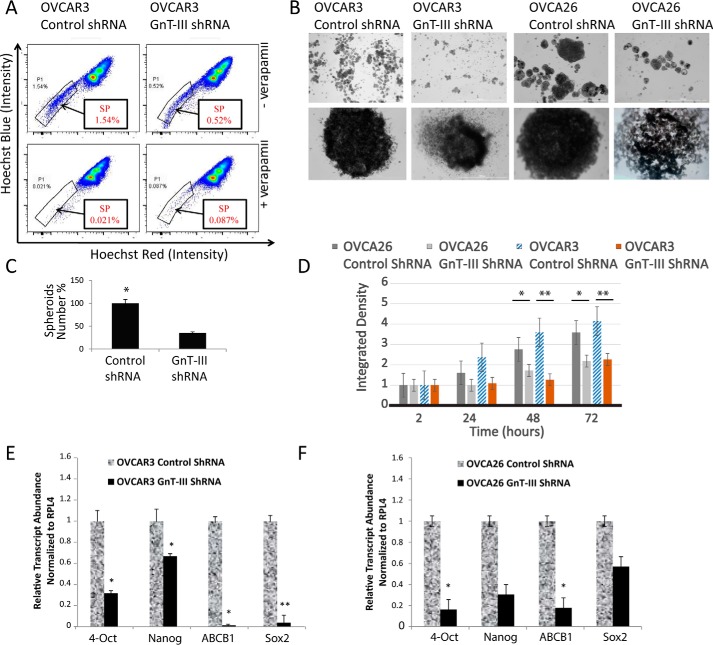
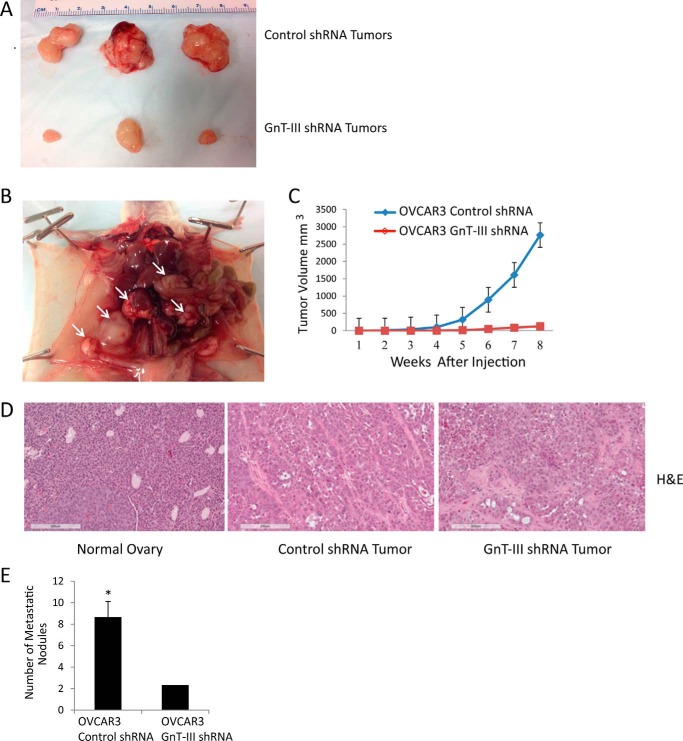
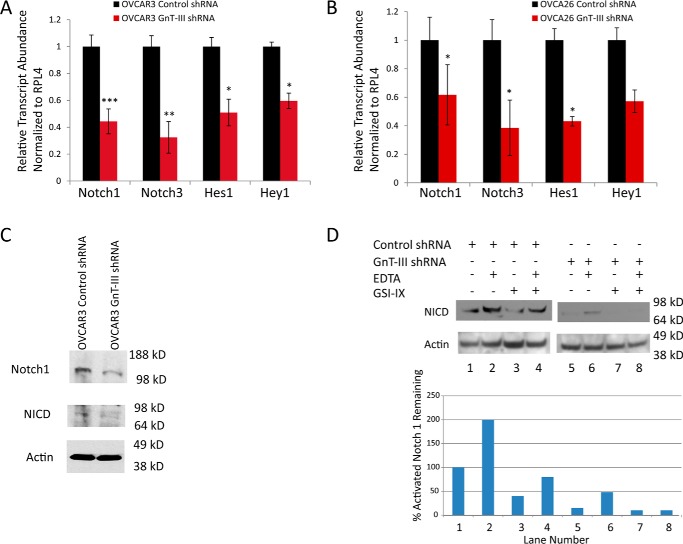
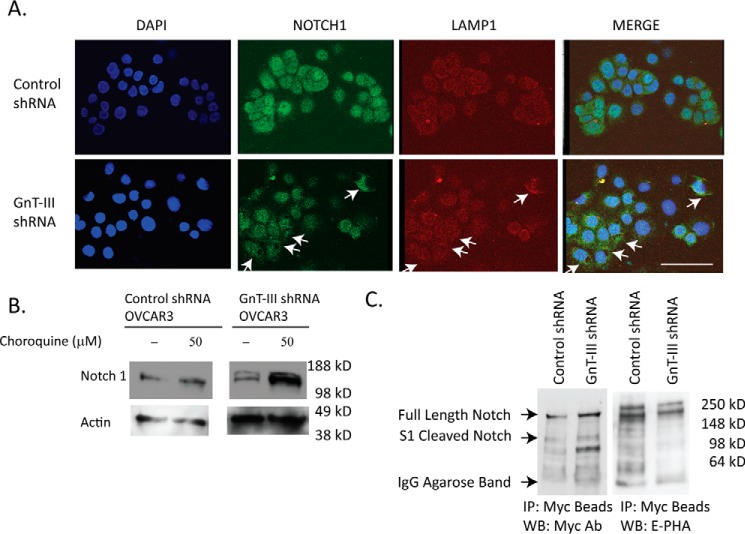
Glycosylation changes associated with cellular transformation can facilitate the growth and progression of tumors. Previously we discovered that the gene Mgat3 encoding the glycosyltransferase GnT-III is elevated in epithelial ovarian carcinomas (EOCs) and leads to the production of abnormal truncated N-linked glycan structures instead of the typical bisected forms. In this study, we are interested in discovering how these abnormal glycans impact the growth and progression of ovarian cancer. We have discovered using stable shRNA gene suppression that GnT-III expression controls the expansion of side-population cells, also known as cancer stem cells. More specifically, we found that GnT-III expression regulates the levels and activation of the heavily glycosylated Notch receptor involved in normal and malignant development. Suppression of GnT-III in EOC cell lines and primary tumor-derived cells resulted in an inhibition of Notch signaling that was more potent than pharmacologic blockage of Notch activation via γ-secretase inhibition. The inhibition resulted from the redirection of the Notch receptor to the lysosome, a novel mechanism. These findings demonstrate a new role for bisecting glycosylation in the control of Notch transport and demonstrate the therapeutic potential of inhibiting GnT-III as a treatment for controlling EOC growth and recurrence.

Keywords: N-linked glycosylation; Notch pathway; cancer; glycosylation; ovarian cancer.


Conflict of interest statement

The authors declare that they have no conflicts of interest with the contents of this article

Figures

Figure 1.
Figure 1.
GnT-III expression levels are elevated in high-grade serous ovarian carcinoma tissues and correlate with reduced survival. A, Mgat3 encodes for the glycosyltransferase GnT-III that catalyzes the transfer of N-acetylglucosamine (blue box) to the trimannosyl core in β 1,4 linkage to form the bisecting N-linked glycan structure. Shown below are examples of the abnormal truncated bisecting N-linked structures previously identified in ovarian cancer tissues (4). B, Mgat3, NOTCH1, and NOTCH3 expression levels are increased in primary high grade serous ovarian carcinoma tissues. The data are ± S.E., n = 3 experiments using primers and analysis as previously described (3). Sample pathology, grade, and origin of tumors S1–S10 are indicated in supplemental Table S1. OV and FT correspond to normal ovary and normal fallopian tube. C, the multidimensional cancer genome browser, cBioportal, was used to analyze trends in mutual exclusivity or co-occurrence between NOTCH1, NOTCH3, and Mgat3 in the TCGA Ovarian Serous Cystadenocarcinoma database (10, 11). **, p values were derived using a Fisher exact test; Logs odds ratio was utilized to quantify how robustly the presence or absence of gene A alterations associated with the presence or absence of gene B alterations from selected tumors. The co-occurrence of Mgat3 with Notch 3 has a p value of 0.007 and a log odds ratio of 1.4, whereas Mgat3 with Notch 1 has a p value of 0.019 and a log odds ratio of 1.6. D, Kaplan–Meier analysis (http://kmplot.com/analysis/index) of OS was plotted for stage IV ovarian cancer patients (n = 176). The OS was significantly longer in the Mgat3 low expression group than in the Mgat3 high expression group. A cutoff value of 140 was chosen by auto select in the analysis configuration, with the expression value of the probe (209764_at) ranging from 4 to 587. E, Kaplan–Meier analysis of PFS was plotted for stage IV ovarian cancer patients (n = 162). The PFS was significantly longer in the Mgat3 low expression group than in the Mgat3 high expression group. A cutoff value of 183 was chosen by auto select in the analysis configuration, with the expression value of the probe (209764_at) ranging from 4 to 700. HR, hazard ratio.
Figure 2.
Figure 2.
GnT-III expression maintains the SP and promotes spheroid formation in ovarian cancer cells. A, stable OVCAR3 control shRNA and OVCAR3 GnT-III shRNA cells were labeled with Hoechst 33342 dye and analyzed by flow cytometry before and after verapamil treatment. Representative results shown from n = 3 experiments. B, OVCAR3 and OVCA26 cell lines generated 3D independent, self-renewing spheroid cells under stem cell selection medium. Upper row, lower magnification; lower row, zoom in on individual spheroid. Bar, 100 μm. C, cumulative spheroids formed were counted, and data from n = 3 experiments are shown as a percentage. *, p < 0.05. D, spheroid growth and formation were evaluated by dispersing cells from spheroids that had been grown in ultralow adhesion plates in stem cell selective media for 3 weeks. Spheroid density was calculated using ImageJ from five fields for each sample at 2, 24, 48, and 72 h after seeding. The data shown are results from three independent experiments with the density of the OVCA26 GnT-III ShRNA spheroids being set at 1.0. *, p < 0.05; **, p < 0.005. E, total RNA isolated from OVCAR3 spheroid cells were examined for expression of various stemness genes as indicated (primer sequences in supplemental Table S2). Relative expression levels normalized to RPL4 are shown for GnT-III shRNA levels compared with control shRNA set to 1.0 for comparison. The data are means ± S.E., n = 3. *, p < 0.05; **, p < 0.01. F, total RNA isolated from OVCA26 spheroid cells were examined for expression of various stemness genes as indicated (primer sequences in supplemental Table S2). Relative expression levels normalized to RPL4 are shown for GnT-III shRNA levels compared with control shRNA set to 1.0 for comparison. The data are means ± S.E., n = 3. *, p < 0.05.
Figure 3.
Figure 3.
GnT-III suppression inhibits tumor growth and metastasis in a xenograft model. A, OVCAR3 control shRNA or GnT-III shRNA were injected subcutaneously in the right and left flanks of NOD/SCID mice. The sizes of selected resected tumors are shown. B, control OVCAR3 tumor invasion into the abdominal cavity with multiple masses on the peritoneum and mesentery are marked with white arrows. C, cumulative growth curves for OVCAR3 control shRNA and OVCAR3 GnT-III shRNA xenografts. D, hematoxylin and eosin (H&E) staining for normal ovary (left), control shRNA xenograft tumor (middle), and GnT-III shRNA xenograft tumor (right). Bar, 200 μm. E, cumulative number of metastatic nodules for control siRNA and GnT-III siRNA xenografts. n = 12 per cell line. *, p < 0.05.
Figure 4.
Figure 4.
GnT-III expression regulates Notch levels and activity. A, Notch 1, Notch 3, Hes 1, and Hey 1 expression levels were significantly reduced in OVCAR3 GnT-III shRNA cells compared with control shRNA levels. The data are means ± S.E., n = 3 experiments. ***, p < 0.001; **, p < 0.01; *, p < 0.05, respectively. B, Notch 1, Notch 3, and Hes 1 levels were significantly reduced in OVCA26 GnT-III shRNA cells compared with control cells. The data are means ± S.E., n = 3 experiments. *, p < 0.05. C, Western blot analysis of Notch 1 and active NICD for OVCAR3 cell lines. D, Western blot analysis of cleaved NICD in OVCAR3 control shRNA and OVCAR3 Gnt-III shRNA cells treated with EDTA and or GSI-IX. The graph represents the percentage of activated Notch remaining following normalization to actin levels; the blot shown is representative of n = 2 experiments.
Figure 5.
Figure 5.
Notch 1 receptor has altered localization and glycosylation following GnT-III suppression. A, immunofluoresnce staining of Notch 1 (green) and LAMP1 (red) in OVCAR3 control shRNA and GnT-III shRNA cells. Bar, 100 μm. Significant areas of co-localization are shown with arrows. B, Western blot analysis of Notch 1 from lysates of cells in the absence or presence of the lysosome inhibitor chloroquine overnight. C, to analyze bisecting glycosylation of Notch 1 in ovarian cancer, mNotch 1/6× Myc was transfected into OVCAR3 control and GnT-III ShRNA cells. The mNotch 1 was isolated using anti-Myc-agarose resin prior to Western blot (WB) detection using Myc antibody or E-PHA. IP, immunoprecipitation.

References

    1. Siegel R., Ma J., Zou Z., and Jemal A. (2014) Cancer statistics, 2014. CA Cancer J. Clin. 64, 9–29 - PubMed
    1. McCluggage W. G. (2011) Morphological subtypes of ovarian carcinoma: a review with emphasis on new developments and pathogenesis. Pathology 43, 420–432 - PubMed
    1. Abbott K. L., Nairn A. V., Hall E. M., Horton M. B., McDonald J. F., Moremen K. W., Dinulescu D. M., and Pierce M. (2008) Focused glycomic analysis of the N-linked glycan biosynthetic pathway in ovarian cancer. Proteomics 8, 3210–3220 - PMC - PubMed
    1. Allam H., Aoki K., Benigno B. B., McDonald J. F., Mackintosh S. G., Tiemeyer M., and Abbott K. L. (2015) Glycomic analysis of membrane glycoproteins with bisecting glycosylation from ovarian cancer tissues reveals novel structures and functions. J. Proteome Res. 14, 434–446 - PMC - PubMed
    1. Narasimhan S. (1982) Control of glycoprotein synthesis. UDP-GlcNAc:glycopeptide β 4-N-acetylglucosaminyltransferase III, an enzyme in hen oviduct which adds GlcNAc in β1–4 linkage to the β-linked mannose of the trimannosyl core of N-glycosyl oligosaccharides. J. Biol. Chem. 257, 10235–10242 - PubMed

Publication types

MeSH terms

Substances