

Simultaneous Gene Delivery and Tracking through Preparation of Photo-Luminescent Nanoparticles Based on Graphene Quantum Dots and Chimeric Peptides
- PMID: 28842617
- PMCID: PMC5573361
- DOI: 10.1038/s41598-017-09890-y
Simultaneous Gene Delivery and Tracking through Preparation of Photo-Luminescent Nanoparticles Based on Graphene Quantum Dots and Chimeric Peptides
Abstract
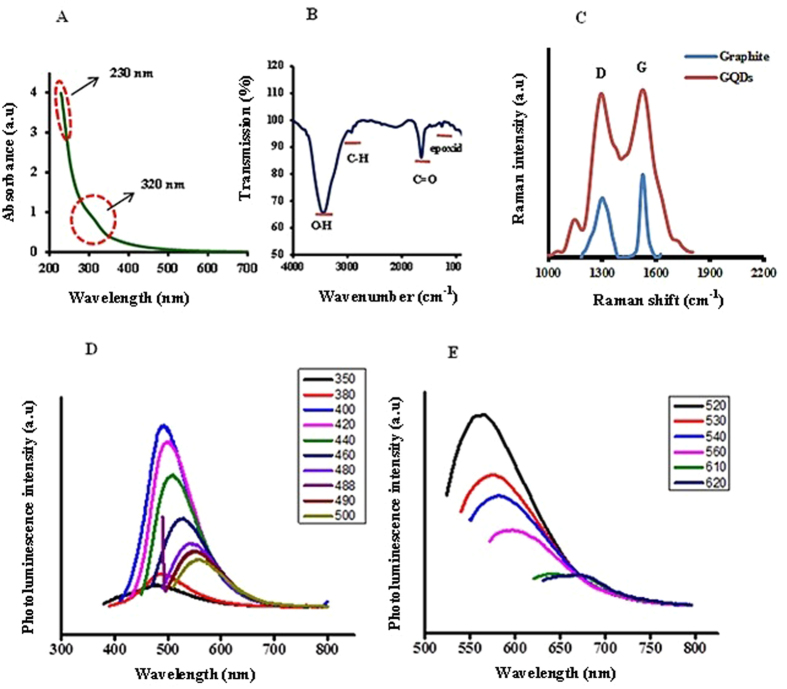
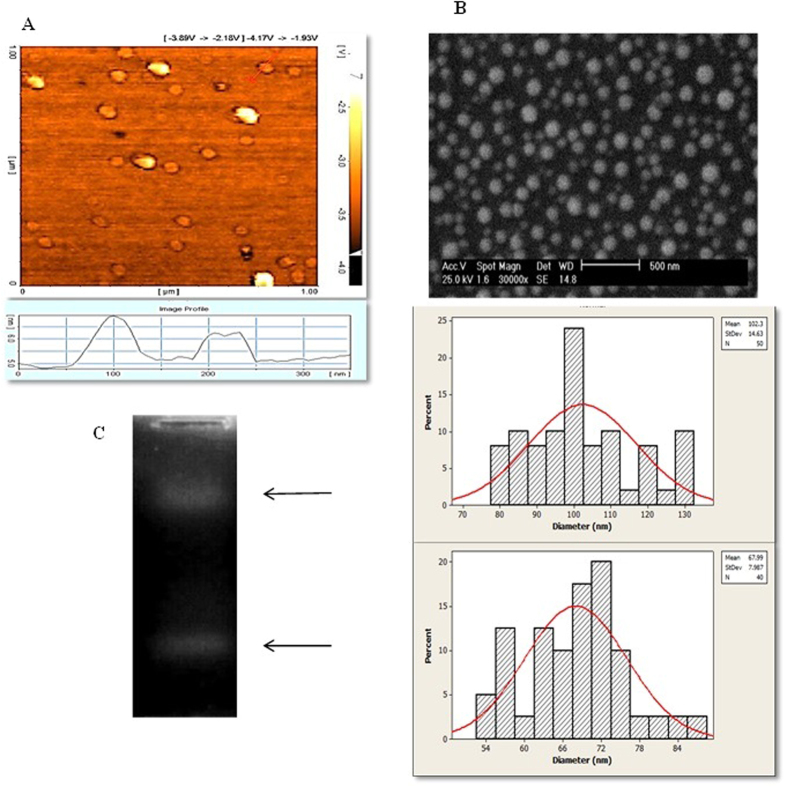
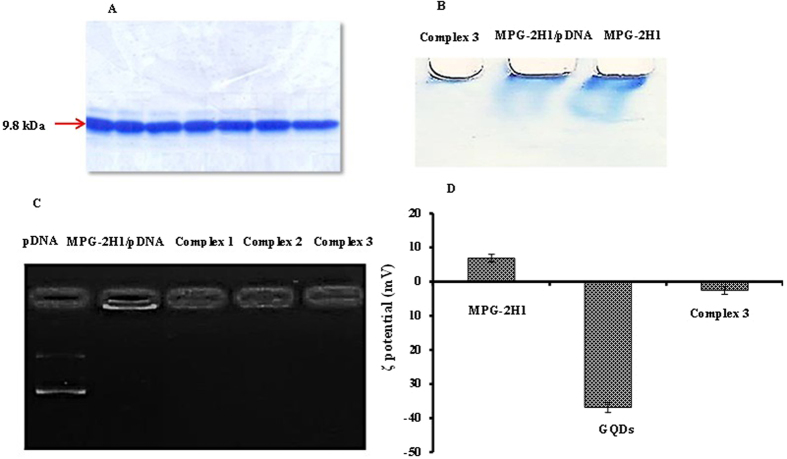
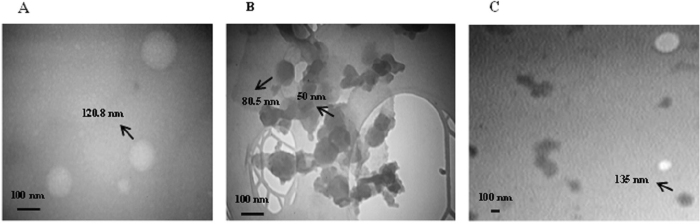
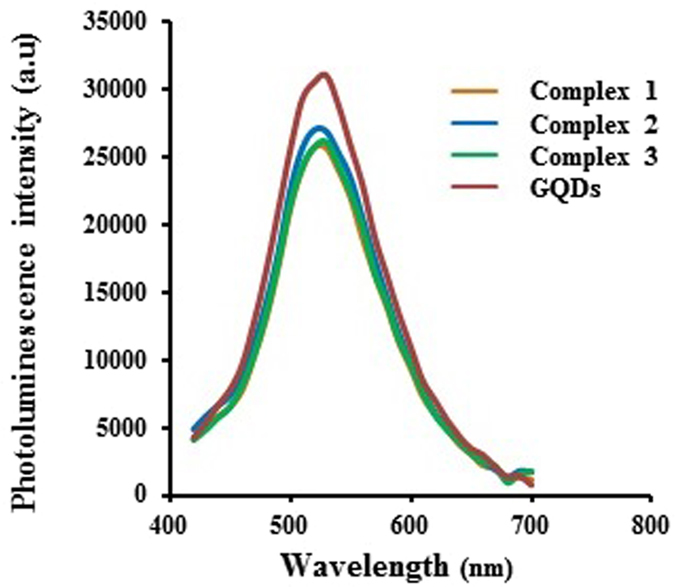
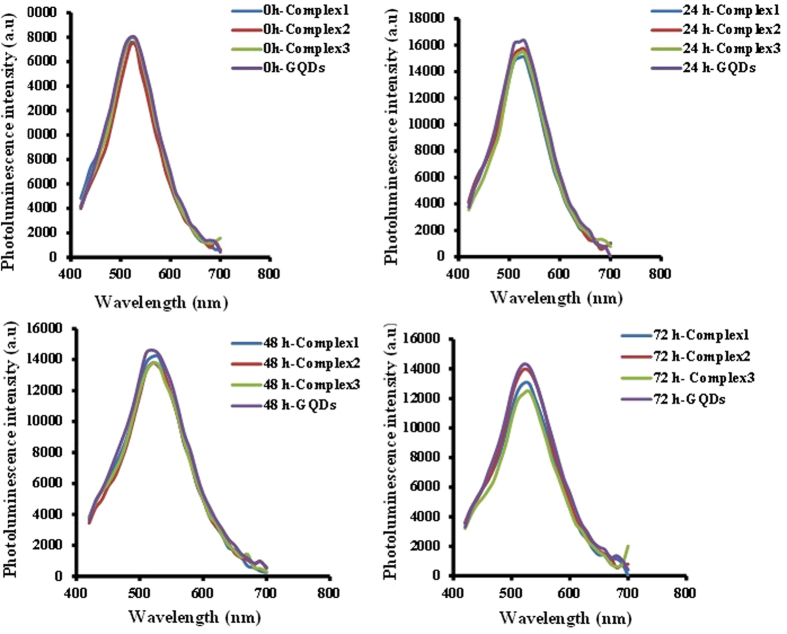
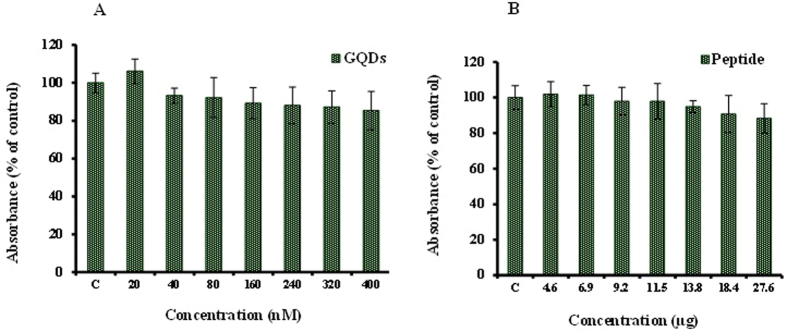
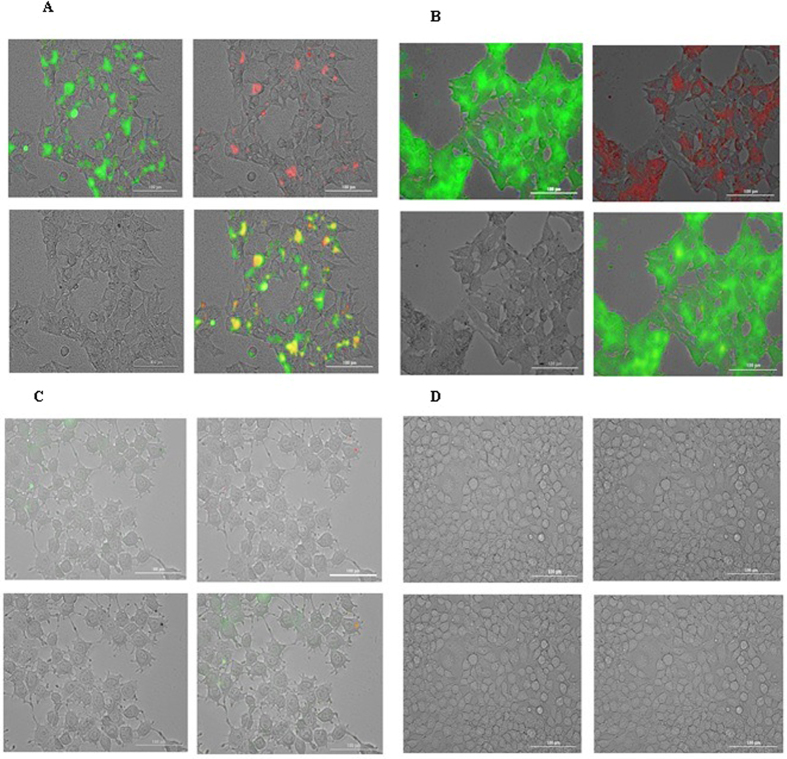
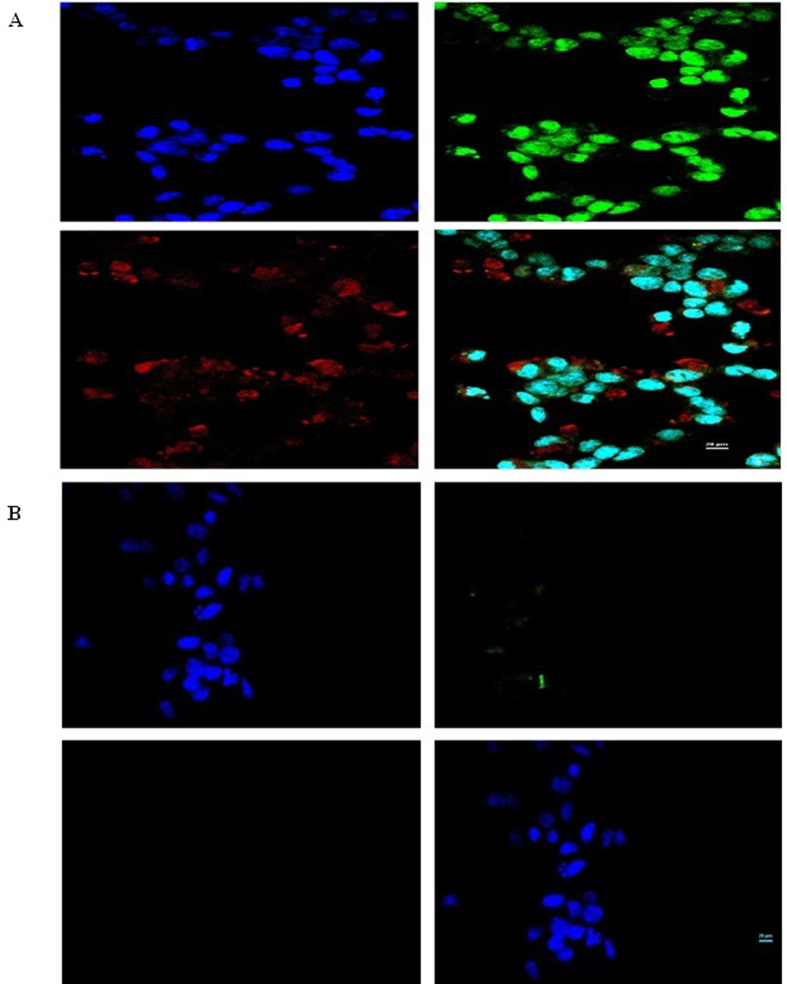
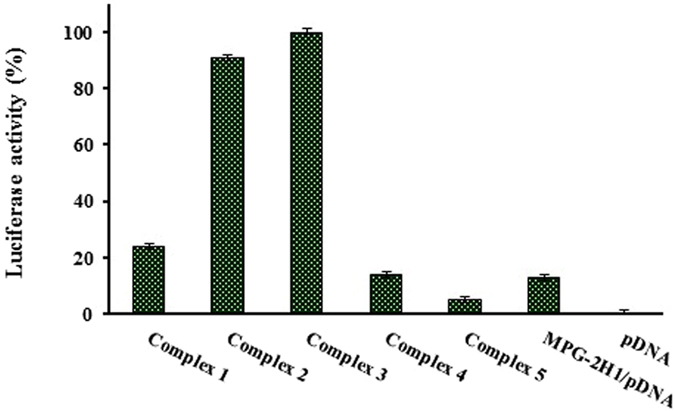
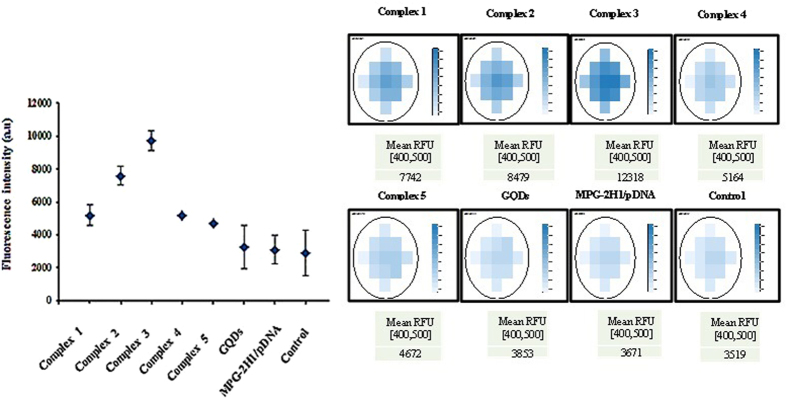
Designing suitable nano-carriers for simultaneous gene delivery and tracking is in the research priorities of the molecular medicine. Non-toxic graphene quantum dots (GQDs) with two different (green and red) emission colors are synthesized by Hummer's method and characterized by UV-Vis, Photoluminescence (PL), Fourier Transform Infrared (FTIR) and Raman spectroscopies, Atomic Force Microscopy (AFM), Scanning Electron Microscopy (SEM) and Transmission Electron Microscopy (TEM). The GQDs are conjugated with MPG-2H1 chimeric peptide and plasmid DNA (pDNA) by non-covalent interactions. Following conjugation, the average diameter of the prepared GQDs increased from 80 nm to 280 nm in complex structure, and the ζ-potential of the complex increased (from -36.87 to -2.56 mV). High transfection efficiency of the nano-carrier and results of confocal microscopy demonstrated that our construct can be considered as a nontoxic carrier with dual functions for gene delivery and nuclear targeting.
Conflict of interest statement
The authors declare that they have no competing interests.
Figures


Similar articles
-
Synthesis of strongly green-photoluminescent graphene quantum dots for drug carrier.Colloids Surf B Biointerfaces. 2013 Dec 1;112:192-6. doi: 10.1016/j.colsurfb.2013.07.025. Epub 2013 Jul 19. Colloids Surf B Biointerfaces. 2013. PMID: 23974005
-
Simple preparation of maltose-functionalized dendrimer/graphene quantum dots as a pH-sensitive biocompatible carrier for targeted delivery of doxorubicin.Int J Biol Macromol. 2020 Aug 1;156:648-659. doi: 10.1016/j.ijbiomac.2020.04.037. Epub 2020 Apr 11. Int J Biol Macromol. 2020. PMID: 32289413
-
Design and preparation of a theranostic peptideticle for targeted cancer therapy: Peptide-based codelivery of doxorubicin/curcumin and graphene quantum dots.Nanomedicine. 2022 Jun;42:102544. doi: 10.1016/j.nano.2022.102544. Epub 2022 Feb 20. Nanomedicine. 2022. PMID: 35192939
-
Synthesis and characterization of an octaarginine functionalized graphene oxide nano-carrier for gene delivery applications.Phys Chem Chem Phys. 2015 Mar 7;17(9):6328-39. doi: 10.1039/c4cp04301d. Phys Chem Chem Phys. 2015. PMID: 25650242
-
Graphene quantum dots (GQDs)-based nanomaterials for improving photodynamic therapy in cancer treatment.Eur J Med Chem. 2019 Nov 15;182:111620. doi: 10.1016/j.ejmech.2019.111620. Epub 2019 Aug 12. Eur J Med Chem. 2019. PMID: 31470307 Review.
Cited by
-
Synergic Effect of Novel WS2 Carriers Holding Spherical Cobalt Ferrite @cubic Fe3O4 (WS2/s-CoFe2O4@c-Fe3O4) Nanocomposites in Magnetic Resonance Imaging and Photothermal Therapy for Ocular Treatments and Investigation of Corneal Endothelial Cell Migration.Nanomaterials (Basel). 2020 Dec 19;10(12):2555. doi: 10.3390/nano10122555. Nanomaterials (Basel). 2020. PMID: 33352770 Free PMC article.
-
Carbon Quantum Dots for Stem Cell Imaging and Deciding the Fate of Stem Cell Differentiation.ACS Omega. 2022 Aug 11;7(33):28685-28693. doi: 10.1021/acsomega.2c03285. eCollection 2022 Aug 23. ACS Omega. 2022. PMID: 36033677 Free PMC article. Review.
-
Detection of Pancreatic Cancer miRNA with Biocompatible Nitrogen-Doped Graphene Quantum Dots.Materials (Basel). 2022 Aug 20;15(16):5760. doi: 10.3390/ma15165760. Materials (Basel). 2022. PMID: 36013894 Free PMC article.
-
Bioactive Graphene Quantum Dots Based Polymer Composite for Biomedical Applications.Polymers (Basel). 2022 Feb 5;14(3):617. doi: 10.3390/polym14030617. Polymers (Basel). 2022. PMID: 35160606 Free PMC article. Review.
-
Bio-multifunctional noncovalent porphyrin functionalized carbon-based nanocomposite.Sci Rep. 2021 Mar 23;11(1):6604. doi: 10.1038/s41598-021-86119-z. Sci Rep. 2021. PMID: 33758300 Free PMC article.
References
-
- Massadeh S, et al. Nano-materials for Gene Therapy: An Efficient Way Overcoming Challenges of gene delivery. Journal of Biosensors and Bioelectronics. 2016;7:1–12. doi: 10.4172/2155-6210.1000195. - DOI
Publication types
MeSH terms
Substances
LinkOut - more resources
Full Text Sources
Other Literature Sources
Miscellaneous
