. 2017 Aug 25;7(1):9473.
doi: 10.1038/s41598-017-09958-9.

Neonatal umbilical cord blood transplantation halts skeletal disease progression in the murine model of MPS-I

Affiliations

Neonatal umbilical cord blood transplantation halts skeletal disease progression in the murine model of MPS-I

Isabella Azario et al. Sci Rep. .

Abstract

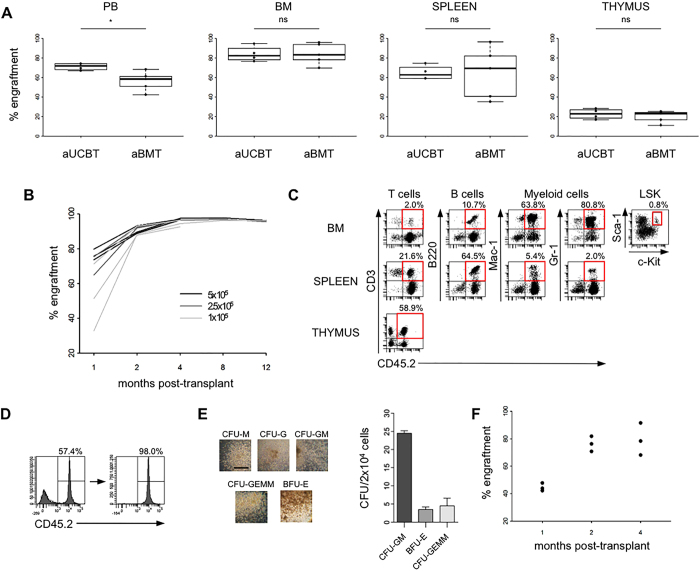
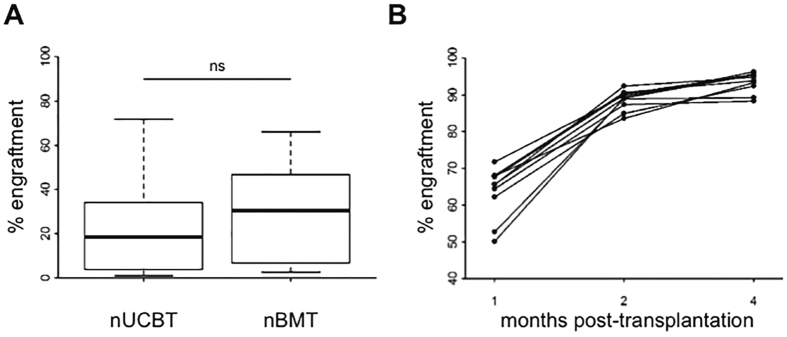
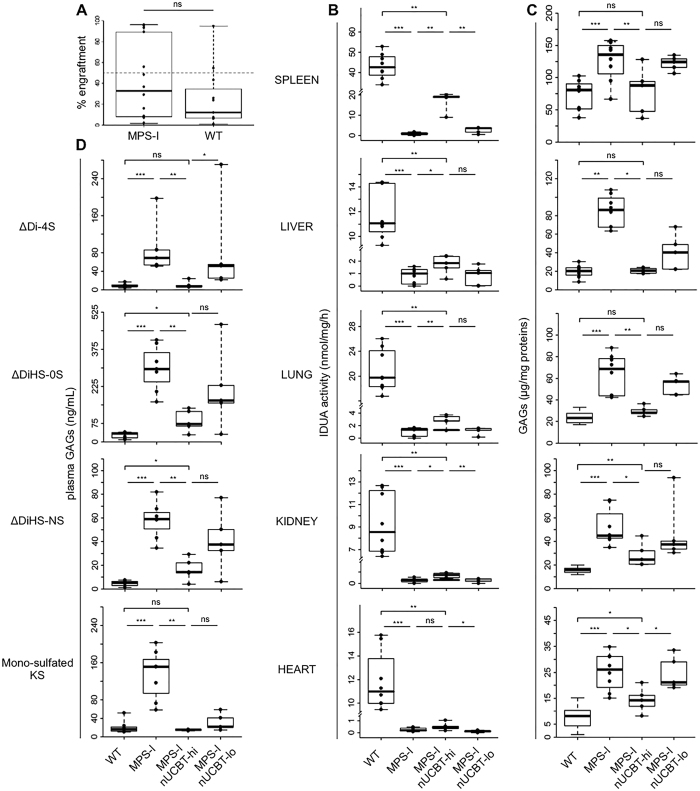
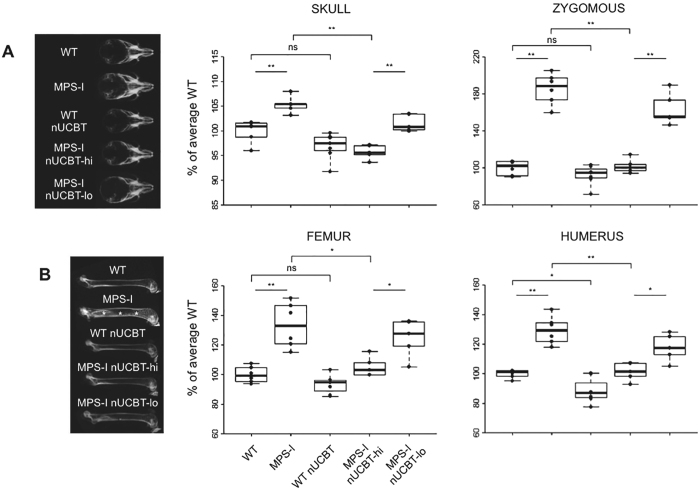
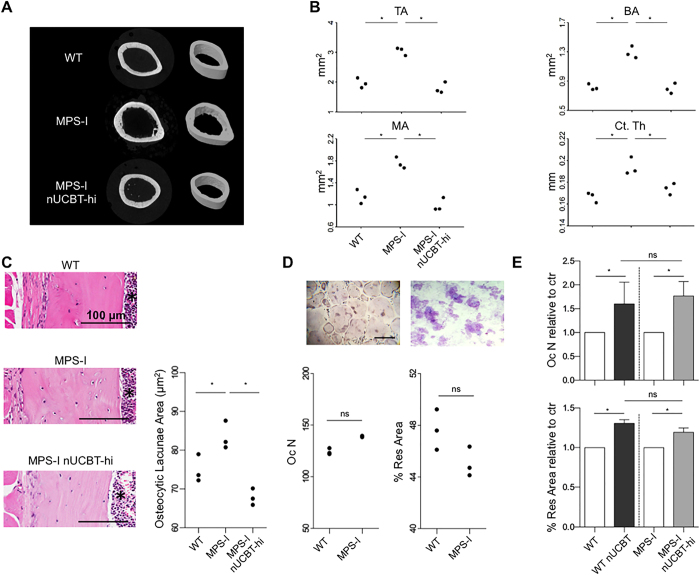
Umbilical cord blood (UCB) is a promising source of stem cells to use in early haematopoietic stem cell transplantation (HSCT) approaches for several genetic diseases that can be diagnosed at birth. Mucopolysaccharidosis type I (MPS-I) is a progressive multi-system disorder caused by deficiency of lysosomal enzyme α-L-iduronidase, and patients treated with allogeneic HSCT at the onset have improved outcome, suggesting to administer such therapy as early as possible. Given that the best characterized MPS-I murine model is an immunocompetent mouse, we here developed a transplantation system based on murine UCB. With the final aim of testing the therapeutic efficacy of UCB in MPS-I mice transplanted at birth, we first defined the features of murine UCB cells and demonstrated that they are capable of multi-lineage haematopoietic repopulation of myeloablated adult mice similarly to bone marrow cells. We then assessed the effectiveness of murine UCB cells transplantation in busulfan-conditioned newborn MPS-I mice. Twenty weeks after treatment, iduronidase activity was increased in visceral organs of MPS-I animals, glycosaminoglycans storage was reduced, and skeletal phenotype was ameliorated. This study explores a potential therapy for MPS-I at a very early stage in life and represents a novel model to test UCB-based transplantation approaches for various diseases.


Conflict of interest statement

The authors declare that they have no competing interests.

Figures

Figure 1
Figure 1
Murine UCBCs have unique features compared with BMCs. (A) Number of UCBCs obtained at day E18 from each fetus (n = 502 fetuses). The distribution of the medium number of cells per fetus was represented by density histogram with Gaussian approximation. (B) Representative flow cytometry analysis of UCB and BM haematopoietic subpopulations: T cells (CD45+CD3+), B cells (CD45+B220+), myeloid cells (CD45+Mac-1+ and CD45+Gr-1+), erythroid cells (TER-119+), and LSK cells (lin-Sca-1+c-Kit+). Percentages of lymphocytes and myeloid cells were referred to CD45+ leukocytes, percentage of Ter119+ was referred to all cells (after hypertonic treatment), and percentage of LSK cells was referred to Lin- leukocytes. (C) Absolute number of haematopoietic colonies detected on methylcellulose at day 14 after plating 2 × 104 UCB or BM cells/petri (n = 11 UCB, n = 6 BM). Data are represented by boxplot graphs, showing the exact data values by black dots. P = 1 with 2-sided Wilcoxon unpaired test. (D) Barplot with percentage of the different subtypes of HPP-CFC, CFU-GEMM, BFU-E and CFU-GM (CFU-M, CFU-G, and CFU-GM) among the total number of colonies obtained from UCB or BM. (E) Representative photographs of the different subtypes of haematopoietic colonies in UCB and BM (10X magnification, bar: 400 μm) and of their cytospin preparations stained with May-Grumwald Giemsa (200X magnification, bar: 200 μm). CFU-GEMM = Colony-Forming Unit-Granulocyte, Erythroid, Macrophage, Megakaryocyte; BFU-E = Burst-Forming Unit-Erythroid; CFU-M = Colony-Forming Unit-Macrophage; CFU-G = Colony-Forming Unit-Granulocyte; CFU-GM = Colony-Forming Unit-Granulocyte, Macrophage; HPP-CFC = High Proliferative Potential-Colony-Forming Cell.
Figure 2
Figure 2
Murine UCBCs demonstrate long-term multi-lineage haematopoietic repopulating activity in adult transplantation setting. (A) Levels of donor chimerism [donor CD45 cells/(donor + host CD45 cells) × 100] were determined by flow cytometry in the haematopoietic organs of adult lethally-irradiated recipients at 1 month after the transplantation of 5 × 105 UCBCs (aUCBT) or BMCs (aBMT) (n = 4 aUCBT, n = 5 aBMT). *p ≤ 0.05 by Wilcoxon test. (B) Levels of chimerism analyzed serially in the PB of recipient mice between 1 and 12 months after the transplantation of 5 × 105, 2.5 × 105, or 1 × 105 UCBCs/mouse (each line in the plot represents a single mouse). (C) Representative lineage distribution of UCB-derived cells in the BM, spleen, and thymus of recipient mice at 4 months after aUCBT. Dot plots to determine donor-derived T cells (CD45.2+CD3+), B cells (CD45.2+B220+), myeloid cells (CD45.2+Mac-1+ and CD45.2+Gr-1+), and LSK cells (CD45.2+lineage-Sca-1+c-Kit+) are shown. (D) FACS sorting of CD45.2+ UCB-derived cells from the BM of a primary aUCBT recipient at 4 months after transplantation. (E) Representative photographs and count of the different subtypes of haematopoietic colonies on methylcellulose formed by UCB-derived (CD45.2+) BM sorted cells (10X magnification, bar: 400 μm). (F) Donor chimerism in the PB of secondary mice after the transplantation of 3 × 106 UCB-derived (CD45.2+) BM sorted cells (n = 3 recipient mice). Each black dot in the plot represents a single mouse, analyzed at 1, 2, and 4 months after transplant.
Figure 3
Figure 3
Murine UCBCs confirm long-term multi-lineage haematopoietic repopulating activity in neonatal transplantation setting. (A) Levels of donor chimerism were determined by flow cytometry in the PB of busulfan-conditioned newborn mice at 1 month following the transplantation of 2 × 105 UCBCs (nUCBT) or BMCs (nBMT) cells (n = 68 nUCBT, n = 28 nBMT; p = 0.10 by Wilcoxon test). (B) Serial analysis of donor chimerism in the PB of nUCBT recipient mice performed at 1, 2, and 4 months after transplant (n = 10, each line in the graph represents a single mouse).
Figure 4
Figure 4
Neonatal UCBT prevents GAGs accumulation in MPS-I mice. (A) Donor chimerism (percentage of CD45.1+ cells) determined by flow cytometry in the PB of recipient MPS-I and WT mice at 20 weeks (time of sacrifice) after nUCBT (n = 12 for MPS-I, n = 12 for WT; p = 0.24 by Wilcoxon test). Dashed line indicates the level of 50% donor engraftment, and identifies the highly-engrafted mice group (with ≥50% donor cells in PB, nUCBT-hi). (B) IDUA activity in spleen, liver, lung, kidney, and heart of WT (n = 8), MPS-I (n = 8), MPS-I nUCBT-hi (n = 5), and MPS-I nUCBT-lo mice (n = 5). (C) GAG levels in the indicated organs of the same WT, MPS-I, MPS-I nUCBT-hi, and MPS-I nUCBT-lo mice. (D) Levels of ΔDiHS-0S, ΔDiHS-NS, ΔDi-4S, and mono-sulfated KS in the plasma of the mice. *p ≤ 0.05, **p ≤ 0.01, ***p ≤ 0.001 by Wilcoxon test.
Figure 5
Figure 5
Neonatal UCBT prevents bone thickening in MPS-I mice. (A) On the left, representative radiographs of the skull of 20-weeks-old WT, MPS-I, WT nUCBT, MPS-I nUCBT-hi, and MPS-I nUCBT-lo mice. On the right, measurements of the skull width and zygomous width, performed on radiographs of WT (n = 6, 3 males and 3 females), MPS-I (n = 6, 3 males and 3 females), WT nUCBT (n = 7, 3 males and 4 females), MPS-I nUCBT-hi (n = 5, 3 males and 2 females), and MPS-I nUCBT-lo mice (n = 5, 3 males and 2 females). (B) On the left, representative radiographs of the femur of 20-weeks-old WT, MPS-I, WT nUCBT, MPS-I nUCBT-hi, and MPS-I nUCBT-lo mice. The increase in meta-diaphyseal bone density observed in MPS-I (asterisks) is significantly prevented in MPS-I nUCBT-hi mice. On the right, measurements of the femur and humerus widths, performed on the radiographs of the same animals as in panel A. *p ≤ 0.05, **p ≤ 0.01, by Wilcoxon test.
Figure 6
Figure 6
Neonatal UCBT improves cortical bone architecture in MPS-I mice. (A) Representative 2D and 3D micro-CT images showing regions of femoral cortical bone in WT, MPS-I, and MPS-I nUCBT-hi 20-weeks-old male mice. (B) Graphs representing the measurement of total area (TA/mm2), bone area (BA/mm2), medullary area (MA/mm2), and cortical thickness (Ct.Th/mm) of 3 mice per group (WT, MPS-I, and MPS-I nUCBT-hi). (C) Representative haematoxylin and eosin stained histological sections of the femur cortical bone at the mid-diaphysis are shown in the panels on the left. The graph illustrates the measurement (mean ± SD) of the area of the osteocytic lacunae within the femur cortical bone of 3 mice per group (WT, MPS-I, and MPS-I nUCBT-hi). The BM cavity is indicated by an asterisk. Bar: 100 μm. (D) Representative pictures of TRAP-positive multinucleated osteoclasts differentiated ex vivo (on the left, magnification 10X; bar: 300 μm) and their resorption plots on dentin slices (on the right, magnification 20X). Quantification of number and resorptive capacity of osteoclasts obtained by ex vivo differentiation of BM cells arisen from untreated WT and MPS-I mice (n = 3 male mice per group). (E) Fold increase of the number and resorptive capacity of the osteoclasts obtained from treated mice, relative to control (untreated mice of the respective genotype) (mean ± SD). *p ≤ 0.05 by Wilcoxon test.

Similar articles

Cited by

References

    1. Prasad VK, Kurtzberg J. Cord blood and bone marrow transplantation in inherited metabolic diseases: scientific basis, current status and future directions. Br. J. Haematol. 2010;148:356–372. doi: 10.1111/j.1365-2141.2009.07974.x. - DOI - PubMed
    1. Ballen KK, Gluckman E, Broxmeyer HE. Umbilical cord blood transplantation: the first 25 years and beyond. Blood. 2013;122:491–498. doi: 10.1182/blood-2013-02-453175. - DOI - PMC - PubMed
    1. Aldenhoven M, Kurtzberg J. Cord blood is the optimal graft source for the treatment of pediatric patients with lysosomal storage diseases: clinical outcomes and future directions. Cytotherapy. 2015;17:765–774. doi: 10.1016/j.jcyt.2015.03.609. - DOI - PubMed
    1. Zhong XY, Zhang B, Asadollahi R, Low SH, Holzgreve W. Umbilical cord blood stem cells: what to expect. Ann. N. Y. Acad. Sci. 2010;1205:17–22. doi: 10.1111/j.1749-6632.2010.05659.x. - DOI - PubMed
    1. Prasad VK, Kurtzberg J. Transplant outcomes in mucopolysaccharidoses. Semin. Hematol. 2010;47:59–69. doi: 10.1053/j.seminhematol.2009.10.008. - DOI - PubMed

Publication types

LinkOut - more resources