

Optimization of region-of-interest sampling strategies for hepatic MRI proton density fat fraction quantification
- PMID: 28842937
- PMCID: PMC5826828
- DOI: 10.1002/jmri.25843
Optimization of region-of-interest sampling strategies for hepatic MRI proton density fat fraction quantification
Abstract
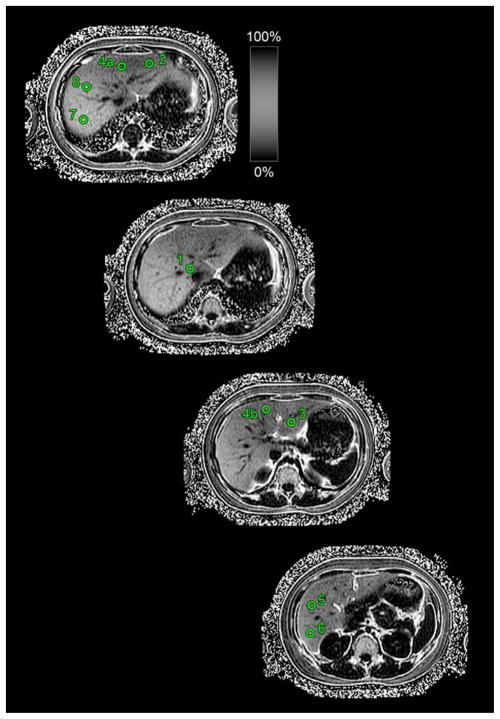
Background: Clinical trials utilizing proton density fat fraction (PDFF) as an imaging biomarker for hepatic steatosis have used a laborious region-of-interest (ROI) sampling strategy of placing an ROI in each hepatic segment.
Purpose: To identify a strategy with the fewest ROIs that consistently achieves close agreement with the nine-ROI strategy.
Study type: Retrospective secondary analysis of prospectively acquired clinical research data.
Population: A total of 391 adults (173 men, 218 women) with known or suspected NAFLD.
Field strength/sequence: Confounder-corrected chemical-shift-encoded 3T MRI using a 2D multiecho gradient-recalled echo technique.
Assessment: An ROI was placed in each hepatic segment. Mean nine-ROI PDFF and segmental PDFF standard deviation were computed. Segmental and lobar PDFF were compared. PDFF was estimated using every combinatorial subset of ROIs and compared to the nine-ROI average.
Statistical testing: Mean nine-ROI PDFF and segmental PDFF standard deviation were summarized descriptively. Segmental PDFF was compared using a one-way analysis of variance, and lobar PDFF was compared using a paired t-test and a Bland-Altman analysis. The PDFF estimated by every subset of ROIs was informally compared to the nine-ROI average using median intraclass correlation coefficients (ICCs) and Bland-Altman analyses.
Results: The study population's mean whole-liver PDFF was 10.1 ± 8.9% (range: 1.1-44.1%). Although there was no significant difference in average segmental (P = 0.452) or lobar (P = 0.154) PDFF, left and right lobe PDFF differed by at least 1.5 percentage points in 25.1% (98/391) of patients. Any strategy with ≥4 ROIs had ICC >0.995. 115 of 126 four-ROI strategies (91%) had limits of agreement (LOA) <1.5%, including four-ROI strategies with two ROIs from each lobe, which all had LOA <1.5%. 14/36 (39%) of two-ROI strategies and 74/84 (88%) of three-ROI strategies had ICC >0.995, and 2/36 (6%) of two-ROI strategies and 46/84 (55%) of three-ROI strategies had LOA <1.5%.
Data conclusion: Four-ROI sampling strategies with two ROIs in the left and right lobes achieve close agreement with nine-ROI PDFF.
Level of evidence: 3 Technical Efficacy: Stage 2 J. Magn. Reson. Imaging 2018;47:988-994.
Keywords: PDFF; fat quantification; region-of-interest; sampling strategy.
© 2017 International Society for Magnetic Resonance in Medicine.
Figures


Similar articles
-
Comparison of reader agreement, correlation with liver biopsy, and time-burden sampling strategies for liver proton density fat fraction measured using magnetic resonance imaging in patients with obesity: a secondary cross-sectional study.BMC Med Imaging. 2022 May 17;22(1):92. doi: 10.1186/s12880-022-00821-6. BMC Med Imaging. 2022. PMID: 35581577 Free PMC article.
-
Inter-reader agreement of magnetic resonance imaging proton density fat fraction and its longitudinal change in a clinical trial of adults with nonalcoholic steatohepatitis.Abdom Radiol (NY). 2019 Feb;44(2):482-492. doi: 10.1007/s00261-018-1745-3. Abdom Radiol (NY). 2019. PMID: 30128694 Free PMC article. Clinical Trial.
-
MRI-determined liver proton density fat fraction, with MRS validation: Comparison of regions of interest sampling methods in patients with type 2 diabetes.J Magn Reson Imaging. 2016 May;43(5):1090-9. doi: 10.1002/jmri.25083. Epub 2015 Nov 4. J Magn Reson Imaging. 2016. PMID: 26536609
-
Validation of a motion-robust 2D sequential technique for quantification of hepatic proton density fat fraction during free breathing.J Magn Reson Imaging. 2018 Dec;48(6):1578-1585. doi: 10.1002/jmri.26056. Epub 2018 Apr 17. J Magn Reson Imaging. 2018. PMID: 29665193 Free PMC article.
-
Linearity, Bias, and Precision of Hepatic Proton Density Fat Fraction Measurements by Using MR Imaging: A Meta-Analysis.Radiology. 2018 Feb;286(2):486-498. doi: 10.1148/radiol.2017170550. Epub 2017 Sep 11. Radiology. 2018. PMID: 28892458 Free PMC article. Review.
Cited by
-
Comparison of reader agreement, correlation with liver biopsy, and time-burden sampling strategies for liver proton density fat fraction measured using magnetic resonance imaging in patients with obesity: a secondary cross-sectional study.BMC Med Imaging. 2022 May 17;22(1):92. doi: 10.1186/s12880-022-00821-6. BMC Med Imaging. 2022. PMID: 35581577 Free PMC article.
-
Optimization of regions of interest sampling strategies for proton density fat-fraction MRI of hepatic steatosis before liver transplantation in ex vivo livers.Heliyon. 2024 Nov 19;11(4):e40146. doi: 10.1016/j.heliyon.2024.e40146. eCollection 2025 Feb 28. Heliyon. 2024. PMID: 40028590 Free PMC article.
-
Measuring liver fat fraction with complex-based chemical shift MRI: the effect of simplified sampling protocols on accuracy.BMC Med Imaging. 2019 Feb 8;19(1):14. doi: 10.1186/s12880-019-0311-y. BMC Med Imaging. 2019. PMID: 30736759 Free PMC article.
-
Repeatability and accuracy of various region-of-interest sampling strategies for hepatic MRI proton density fat fraction quantification.Abdom Radiol (NY). 2021 Jul;46(7):3105-3116. doi: 10.1007/s00261-021-02965-5. Epub 2021 Feb 20. Abdom Radiol (NY). 2021. PMID: 33609166 Free PMC article.
-
Sample strategies for quantification of hepatic fat fraction mean MRI in healthy cats during body weight gain.PLoS One. 2020 Nov 12;15(11):e0241905. doi: 10.1371/journal.pone.0241905. eCollection 2020. PLoS One. 2020. PMID: 33180808 Free PMC article.
References
-
- Preiss D, Sattar N. Non-alcoholic fatty liver disease: An overview of prevalence, diagnosis, pathogenesis and treatment considerations. Clin Sci (Lond) 2008;115:141–150. - PubMed
-
- Lazo M, Clark JM. The epidemiology of nonalcoholic fatty liver disease: A global perspective. Semin Liver Dis. 2008;28:339–350. - PubMed
-
- Vernon G, Baranova A. Systematic review: The epidemiology and natural history of non-alcoholic fatty liver disease and non-alcoholic steatohepatitis in adults. Aliment Pharmacol Ther. 2011;34:273–285. - PubMed
-
- Ratziu V, Charlotte F, Heurtier A, et al. Sampling variability of liver biopsy in nonalcoholic fatty liver disease. Gastroenterology. 2005;128:1898–1906. - PubMed
Publication types
MeSH terms
Substances
Grants and funding
LinkOut - more resources
Full Text Sources
Other Literature Sources
Medical
Research Materials
