

Artificial grammar learning in vascular and progressive non-fluent aphasias
- PMID: 28843341
- PMCID: PMC5637161
- DOI: 10.1016/j.neuropsychologia.2017.08.022
Artificial grammar learning in vascular and progressive non-fluent aphasias
Abstract
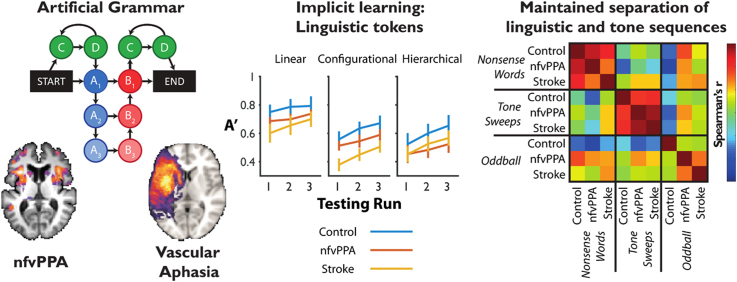
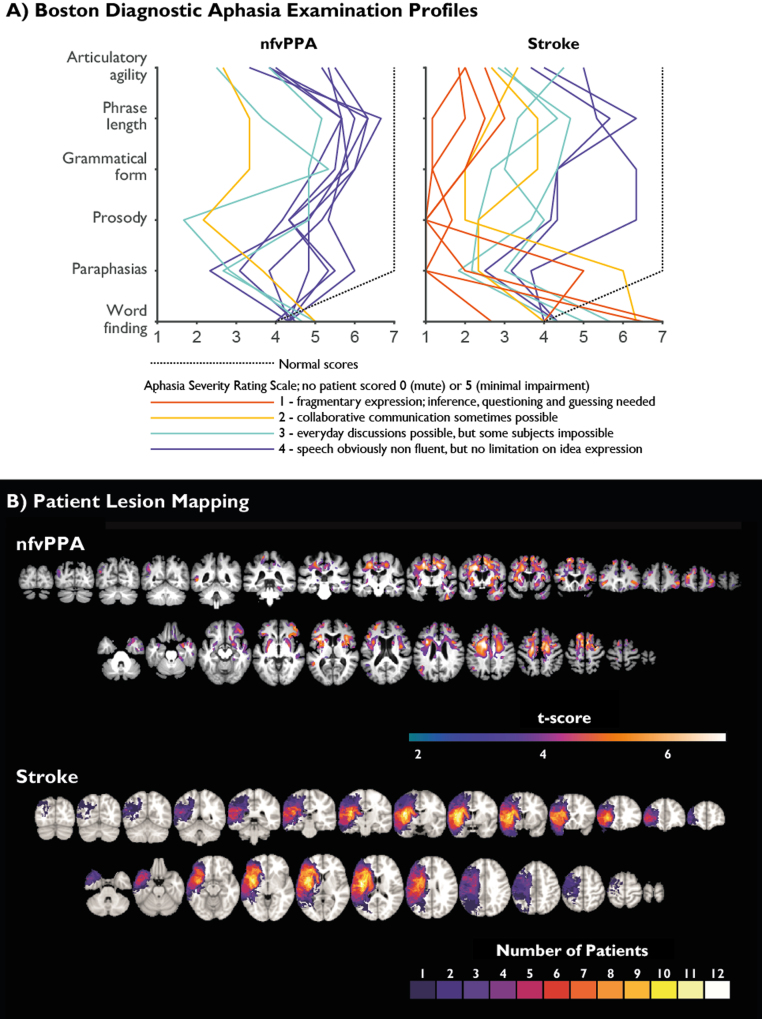
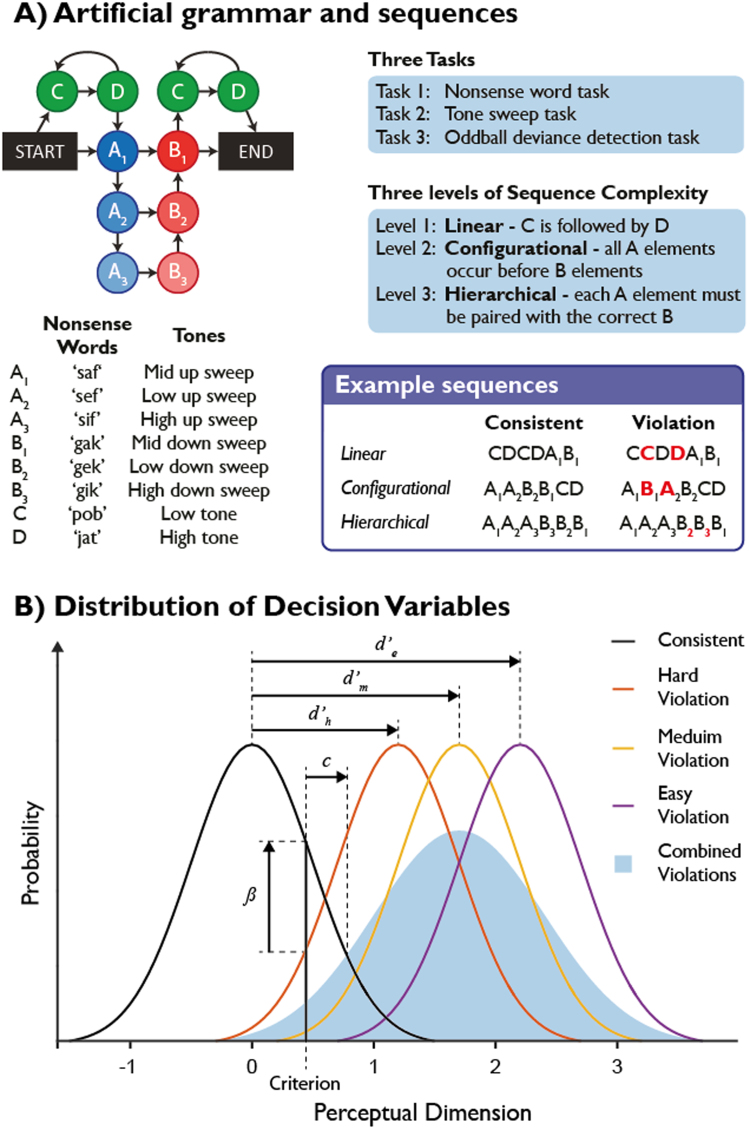
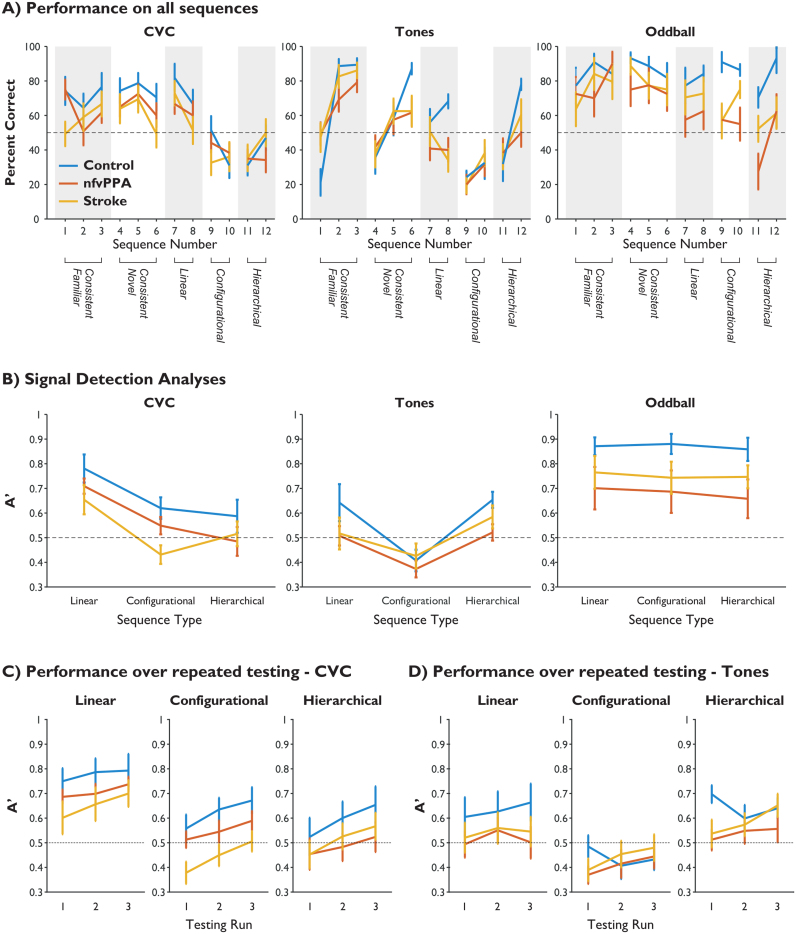
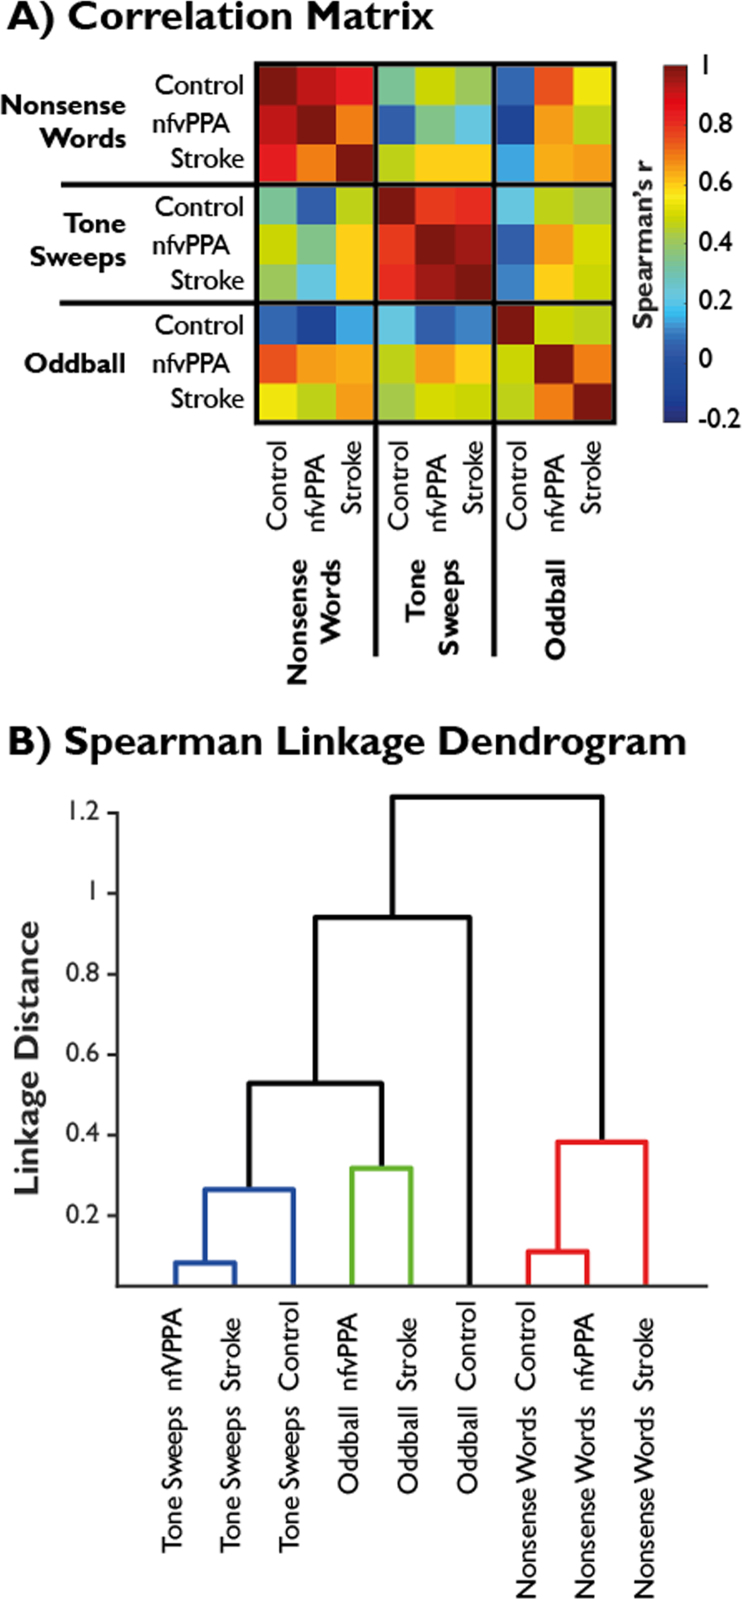
Patients with non-fluent aphasias display impairments of expressive and receptive grammar. This has been attributed to deficits in processing configurational and hierarchical sequencing relationships. This hypothesis had not been formally tested. It was also controversial whether impairments are specific to language, or reflect domain general deficits in processing structured auditory sequences. Here we used an artificial grammar learning paradigm to compare the abilities of controls to participants with agrammatic aphasia of two different aetiologies: stroke and frontotemporal dementia. Ten patients with non-fluent variant primary progressive aphasia (nfvPPA), 12 with non-fluent aphasia due to stroke, and 11 controls implicitly learned a novel mixed-complexity artificial grammar designed to assess processing of increasingly complex sequencing relationships. We compared response profiles for otherwise identical sequences of speech tokens (nonsense words) and tone sweeps. In all three groups the ability to detect grammatical violations varied with sequence complexity, with performance improving over time and being better for adjacent than non-adjacent relationships. Patients performed less well than controls overall, and this was related more strongly to aphasia severity than to aetiology. All groups improved with practice and performed well at a control task of detecting oddball nonwords. Crucially, group differences did not interact with sequence complexity, demonstrating that aphasic patients were not disproportionately impaired on complex structures. Hierarchical cluster analysis revealed that response patterns were very similar across all three groups, but very different between the nonsense word and tone tasks, despite identical artificial grammar structures. Overall, we demonstrate that agrammatic aphasics of two different aetiologies are not disproportionately impaired on complex sequencing relationships, and that the learning of phonological and non-linguistic sequences occurs independently. The similarity of profiles of discriminatory abilities and rule learning across groups suggests that insights from previous studies of implicit sequence learning in vascular aphasia are likely to prove applicable in nfvPPA.
Keywords: Aphasia; Frontotemporal dementia; Grammar; Implicit learning; Stroke.
Copyright © 2017 The Authors. Published by Elsevier Ltd.. All rights reserved.
Figures
References
-
- Bahlmann J., Schubotz R.I., Friederici A.D. Hierarchical artificial grammar processing engages Broca's area. Neuroimage. 2008;42(2):525–534. (Aug 15) - PubMed
-
- Bastiaanse R., Edwards S., Mass E., Rispens J. Assessing comprehension and production of verbs and sentences: the Verb and Sentence Test (VAST) Aphasiology. 2003;17(1):49–73. (2003/01/01)
-
- Berndt R.S. Sentence comprehension in Broca's aphasia: a critique of the evidence. Behav. Brain Sci. 2000;23(01):24-.
-
- Berndt R.S., Caramazza A., Zurif E. Language Functions and Brain Organization; 1983. Language Functions: Syntax; p. 5.
-
- Berndt R.S., Mitchum C.C., Haendiges A.N. Comprehension of reversible sentences in “agrammatism”: a meta-analysis. Cognition. 1996;58(3):289–308. - PubMed
MeSH terms
Grants and funding
- 102961/Z/13/Z/WT_/Wellcome Trust/United Kingdom
- MC_U105597119/MRC_/Medical Research Council/United Kingdom
- MC_UU_00005/12/MRC_/Medical Research Council/United Kingdom
- BB/J009849/1/BB_/Biotechnology and Biological Sciences Research Council/United Kingdom
- NC/K000608/1/NC3RS_/National Centre for the Replacement, Refinement and Reduction of Animals in Research/United Kingdom
LinkOut - more resources
Full Text Sources
Other Literature Sources
