

Neuroanatomical foundations of delayed reward discounting decision making
- PMID: 28843539
- PMCID: PMC5895082
- DOI: 10.1016/j.neuroimage.2017.08.045
Neuroanatomical foundations of delayed reward discounting decision making
Abstract
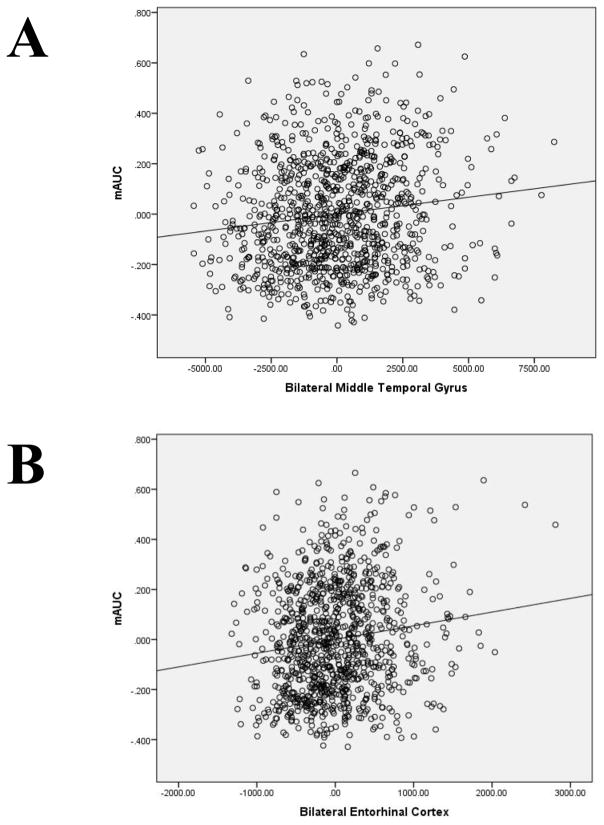
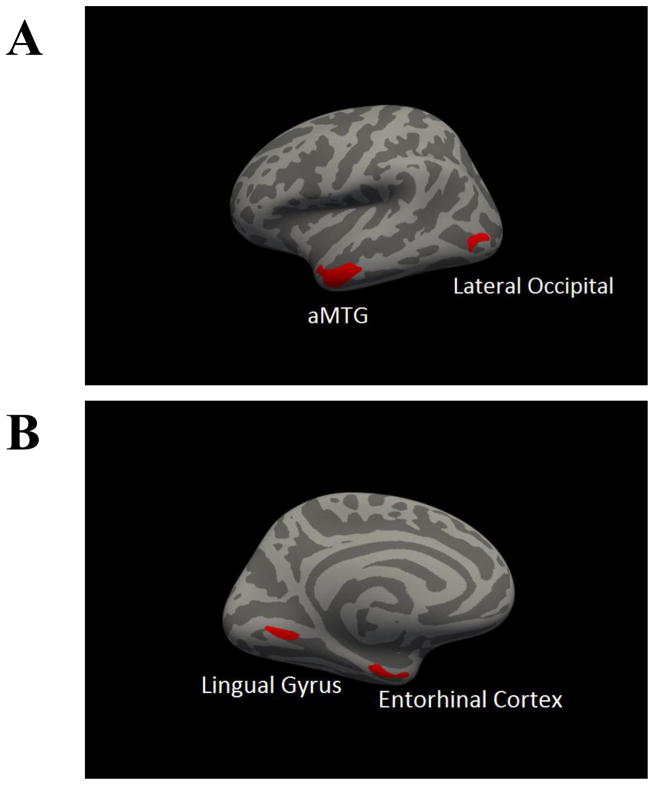
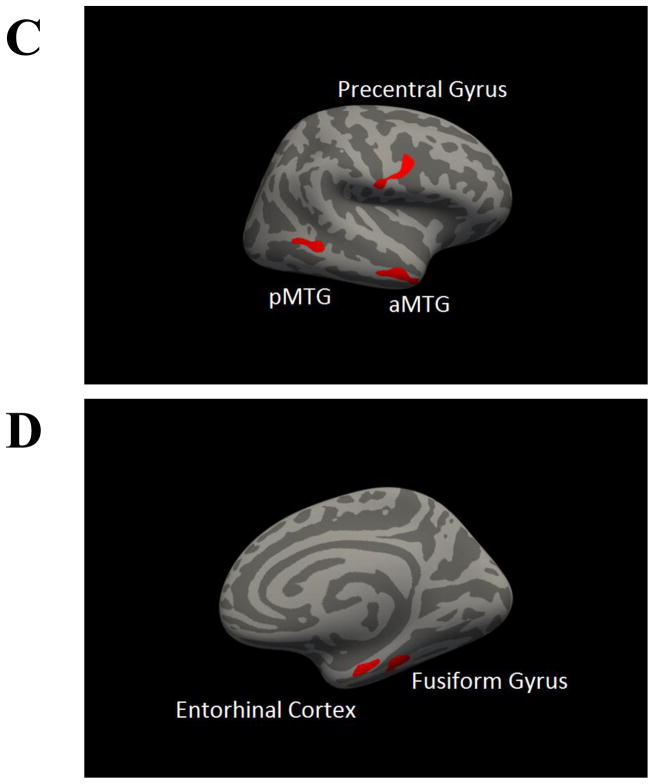
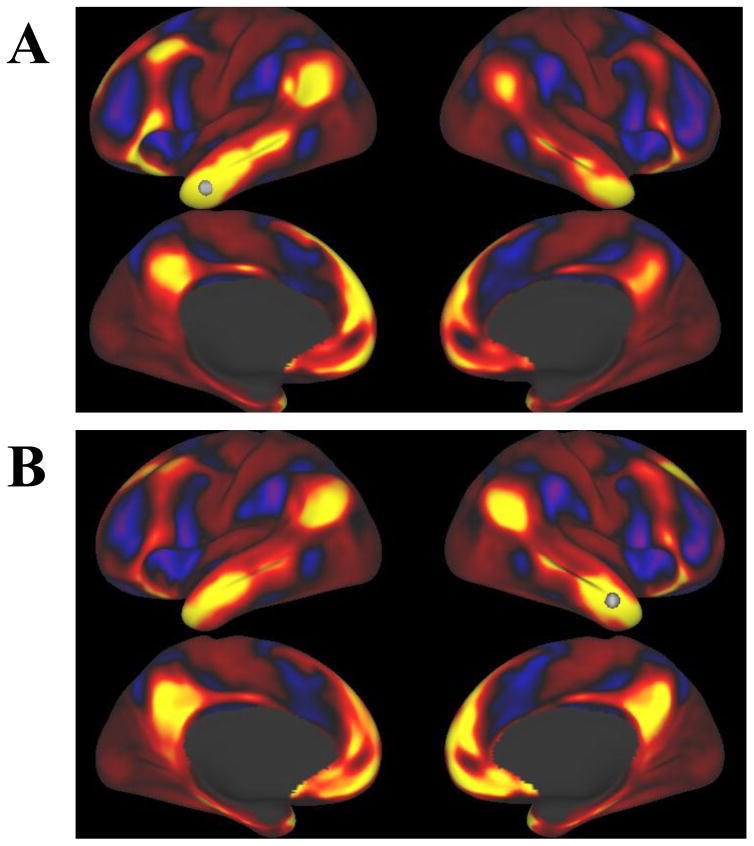
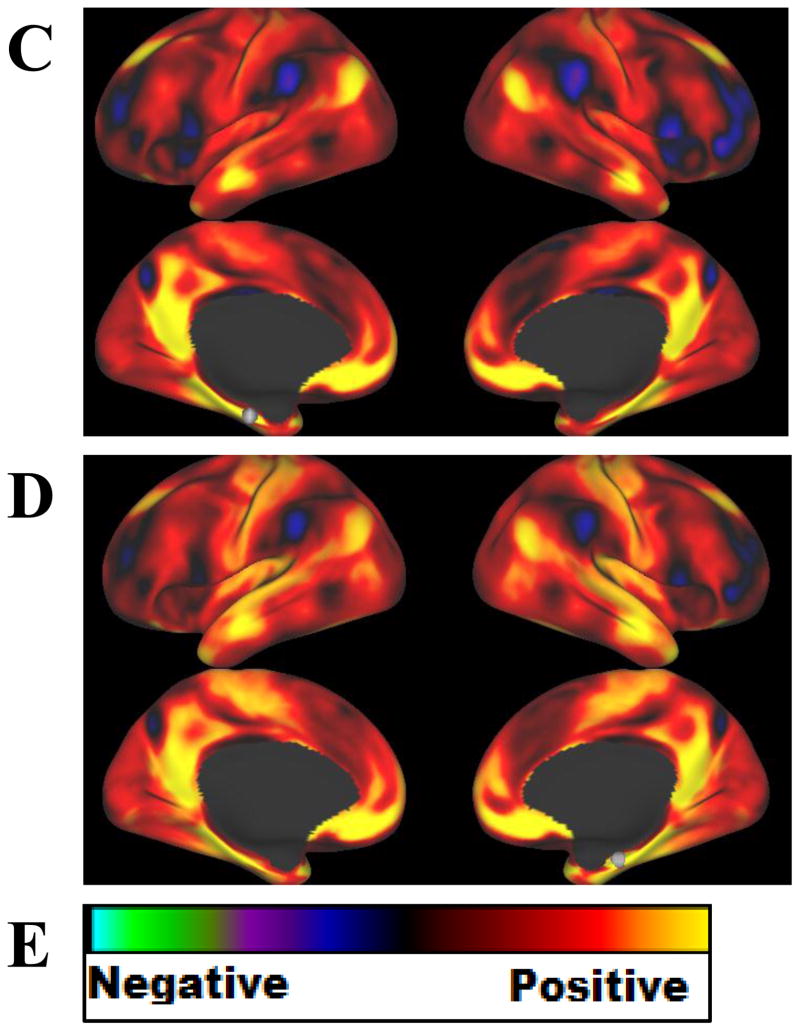
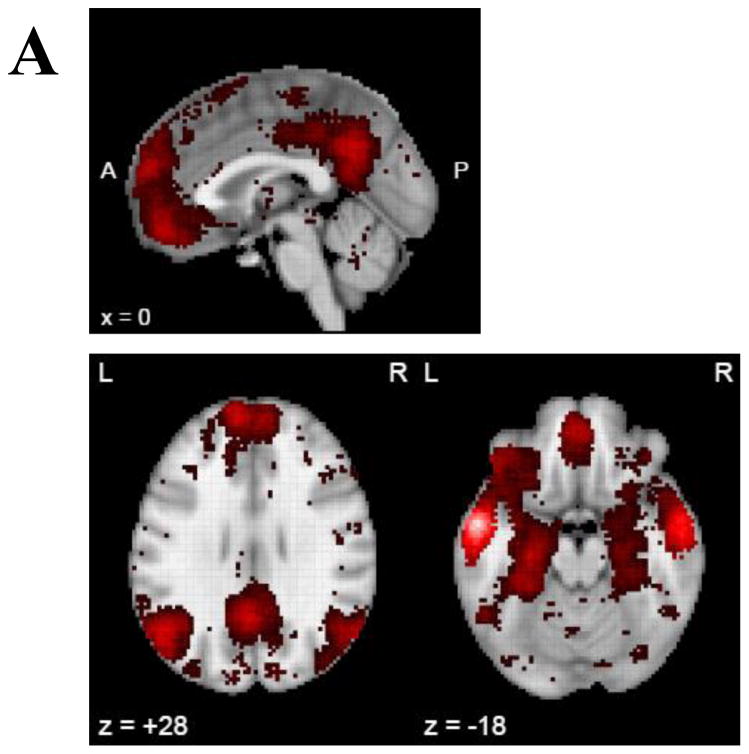
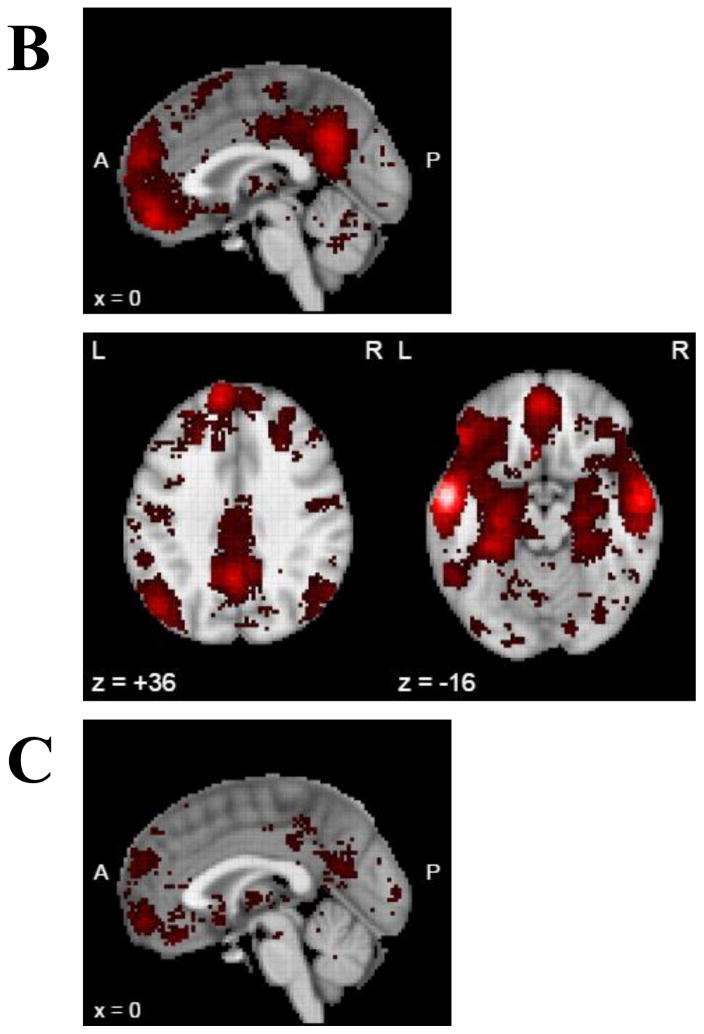
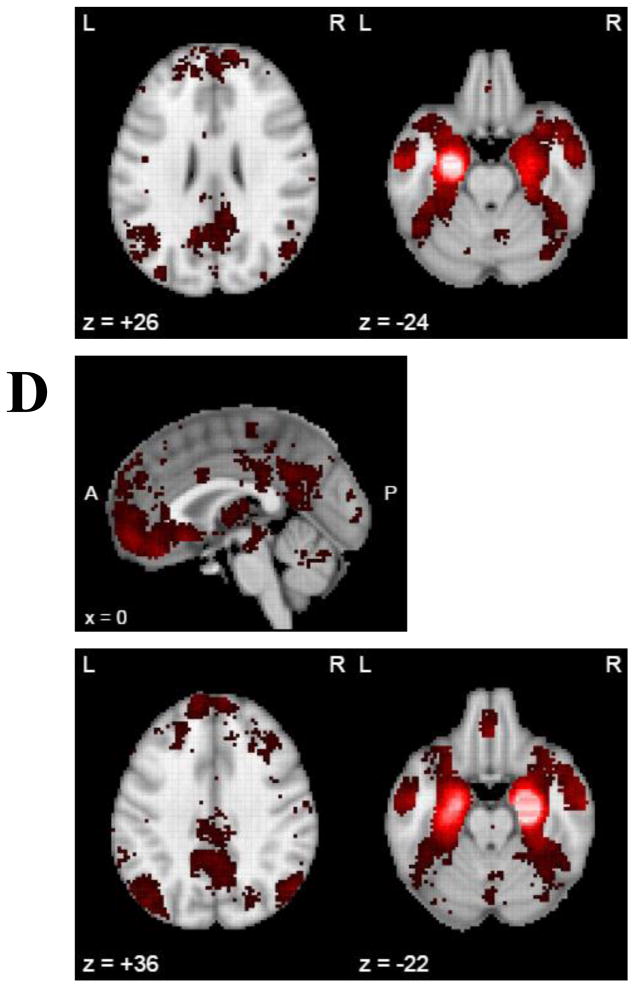
Resolving tradeoffs between smaller immediate rewards and larger delayed rewards is ubiquitous in daily life and steep discounting of future rewards is associated with several psychiatric conditions. This form of decision-making is referred to as delayed reward discounting (DRD) and the features of brain structure associated with DRD are not well understood. The current study characterized the relationship between gray matter volume (GMV) and DRD in a sample of 1038 healthy adults (54.7% female) using cortical parcellation, subcortical segmentation, and voxelwise cortical surface-based group analyses. The results indicate that steeper DRD was significantly associated with lower total cortical GMV, but not subcortical GMV. In parcellation analyses, less GMV in 20 discrete cortical regions was associated with steeper DRD. Of these regions, only GMV in the middle temporal gyrus (MTG) and entorhinal cortex (EC) were uniquely associated with DRD. Voxelwise surface-based analyses corroborated these findings, again revealing significant associations between steeper DRD and less GMV in the MTG and EC. To inform the roles of MTG and EC in DRD, connectivity analysis of resting state data (N = 1003) using seed regions from the structural findings was conducted. This revealed that spontaneous activity in the MTG and EC was correlated with activation in the ventromedial prefrontal cortex, posterior cingulate cortex, and inferior parietal lobule, regions associated with the default mode network, which involves prospection, self-reflective thinking and mental simulation. Furthermore, meta-analytic co-activation analysis using Neurosynth revealed a similar pattern across 11,406 task-fMRI studies. Collectively, these findings provide robust evidence that morphometric characteristics of the temporal lobe are associated with DRD preferences and suggest it may be because of their role in mental activities in common with default mode activity.
Keywords: Behavioral economics; Delayed reward discounting; Gray matter; MRI; Morphometry.
Copyright © 2017 Elsevier Inc. All rights reserved.
Figures
Similar articles
-
Neuroanatomical foundations of delayed reward discounting decision making II: Evaluation of sulcal morphology and fractal dimensionality.Neuroimage. 2022 Aug 15;257:119309. doi: 10.1016/j.neuroimage.2022.119309. Epub 2022 May 19. Neuroimage. 2022. PMID: 35598732
-
A machine learning-derived neuroanatomical pattern predicts delayed reward discounting in the Human Connectome Project Young Adult sample.J Neurosci Res. 2023 Jul;101(7):1125-1137. doi: 10.1002/jnr.25185. Epub 2023 Mar 10. J Neurosci Res. 2023. PMID: 36896988
-
Delay discounting differences in brain activation, connectivity, and structure in individuals with addiction: a systematic review protocol.Syst Rev. 2017 Jul 11;6(1):138. doi: 10.1186/s13643-017-0537-0. Syst Rev. 2017. PMID: 28693555 Free PMC article.
-
Functional and structural neuroimaging studies of delayed reward discounting in addiction: A systematic review.Psychol Bull. 2019 Feb;145(2):141-164. doi: 10.1037/bul0000181. Psychol Bull. 2019. PMID: 30652907
-
Cortical and Subcortical Gray Matter Volume in Youths With Conduct Problems: A Meta-analysis.JAMA Psychiatry. 2016 Jan;73(1):64-72. doi: 10.1001/jamapsychiatry.2015.2423. JAMA Psychiatry. 2016. PMID: 26650724 Review.
Cited by
-
Effects of prefrontal theta burst stimulation on neuronal activity and subsequent eating behavior: an interleaved rTMS and fNIRS study.Soc Cogn Affect Neurosci. 2023 Feb 6;18(1):nsab023. doi: 10.1093/scan/nsab023. Soc Cogn Affect Neurosci. 2023. PMID: 33615370 Free PMC article. Clinical Trial.
-
Neurobiological metric of cortical delay discounting differentiates risk for self- and other-directed violence among trauma-exposed individuals.J Psychopathol Clin Sci. 2023 Oct;132(7):897-907. doi: 10.1037/abn0000857. Epub 2023 Sep 7. J Psychopathol Clin Sci. 2023. PMID: 37676141 Free PMC article.
-
The Role of Neuroplasticity in Improving the Decision-Making Quality of Individuals With Agenesis of the Corpus Callosum: A Systematic Review.Cureus. 2022 Jun 19;14(6):e26082. doi: 10.7759/cureus.26082. eCollection 2022 Jun. Cureus. 2022. PMID: 35747104 Free PMC article. Review.
-
Cortical morphometry of the five-factor model of personality: findings from the Human Connectome Project full sample.Soc Cogn Affect Neurosci. 2019 May 17;14(4):381-395. doi: 10.1093/scan/nsz017. Soc Cogn Affect Neurosci. 2019. PMID: 30848280 Free PMC article.
-
Different topological patterns in structural covariance networks between high and low delay discounters.Front Psychol. 2023 Aug 30;14:1210652. doi: 10.3389/fpsyg.2023.1210652. eCollection 2023. Front Psychol. 2023. PMID: 37711326 Free PMC article.
References
Publication types
MeSH terms
Grants and funding
LinkOut - more resources
Full Text Sources
Other Literature Sources
Medical
