. 2017 Nov;17(11):1133-1161.
doi: 10.1016/S1473-3099(17)30396-1. Epub 2017 Aug 23.

Estimates of the global, regional, and national morbidity, mortality, and aetiologies of lower respiratory tract infections in 195 countries: a systematic analysis for the Global Burden of Disease Study 2015

Collaborators

Estimates of the global, regional, and national morbidity, mortality, and aetiologies of lower respiratory tract infections in 195 countries: a systematic analysis for the Global Burden of Disease Study 2015

GBD 2015 LRI Collaborators. Lancet Infect Dis. 2017 Nov.

Abstract

Background: The Global Burden of Diseases, Injuries, and Risk Factors (GBD) Study 2015 provides an up-to-date analysis of the burden of lower respiratory tract infections (LRIs) in 195 countries. This study assesses cases, deaths, and aetiologies spanning the past 25 years and shows how the burden of LRI has changed in people of all ages.

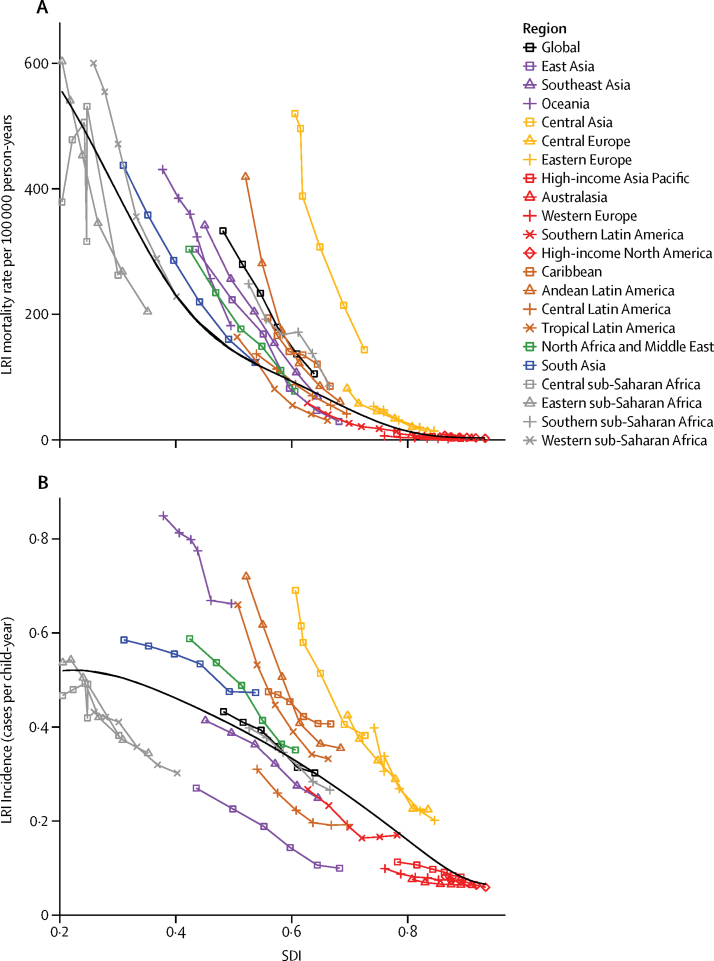
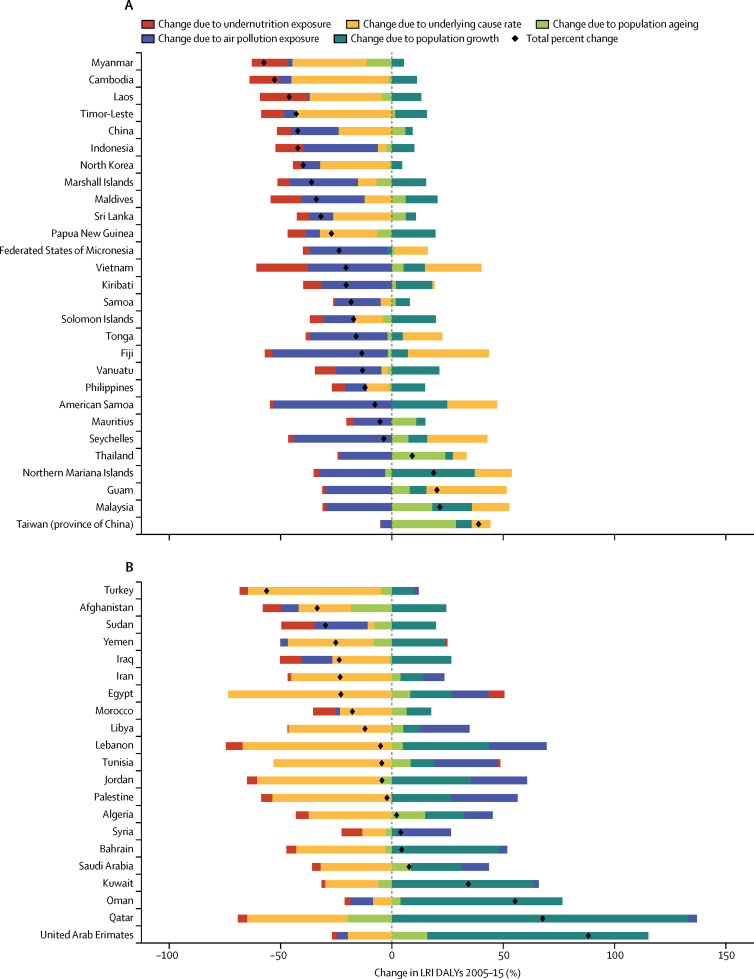
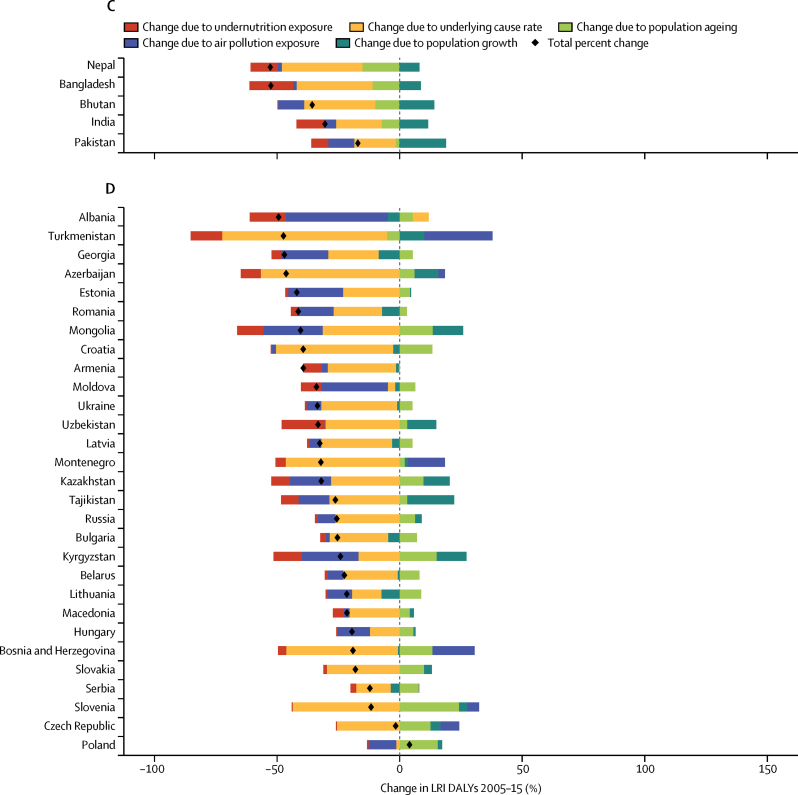
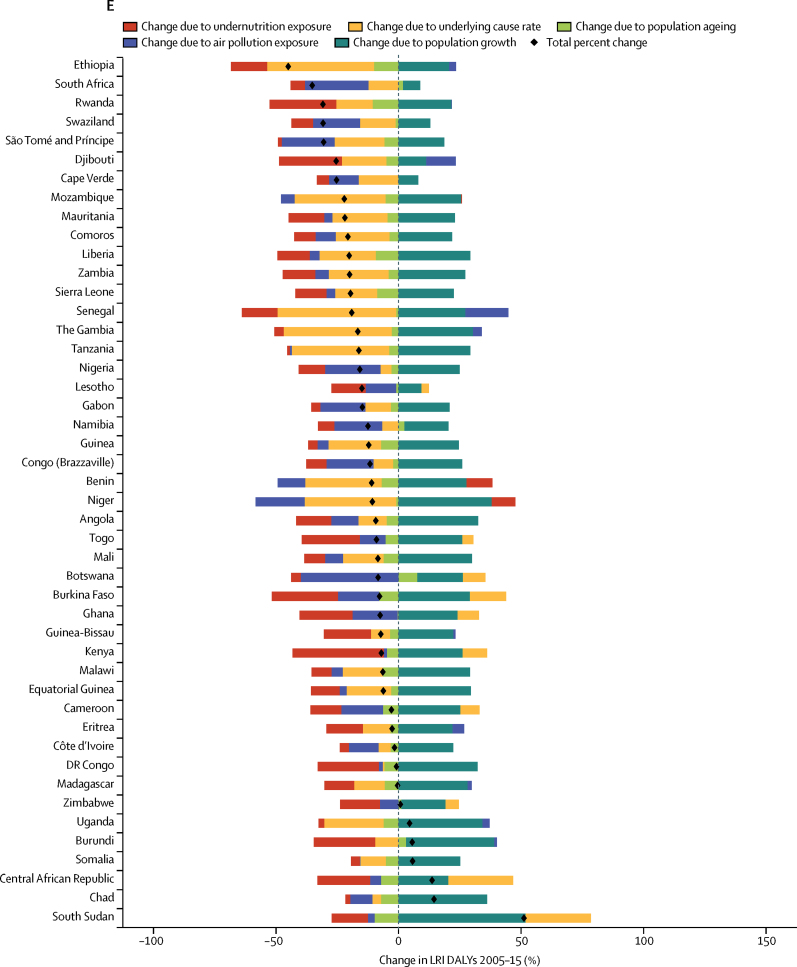
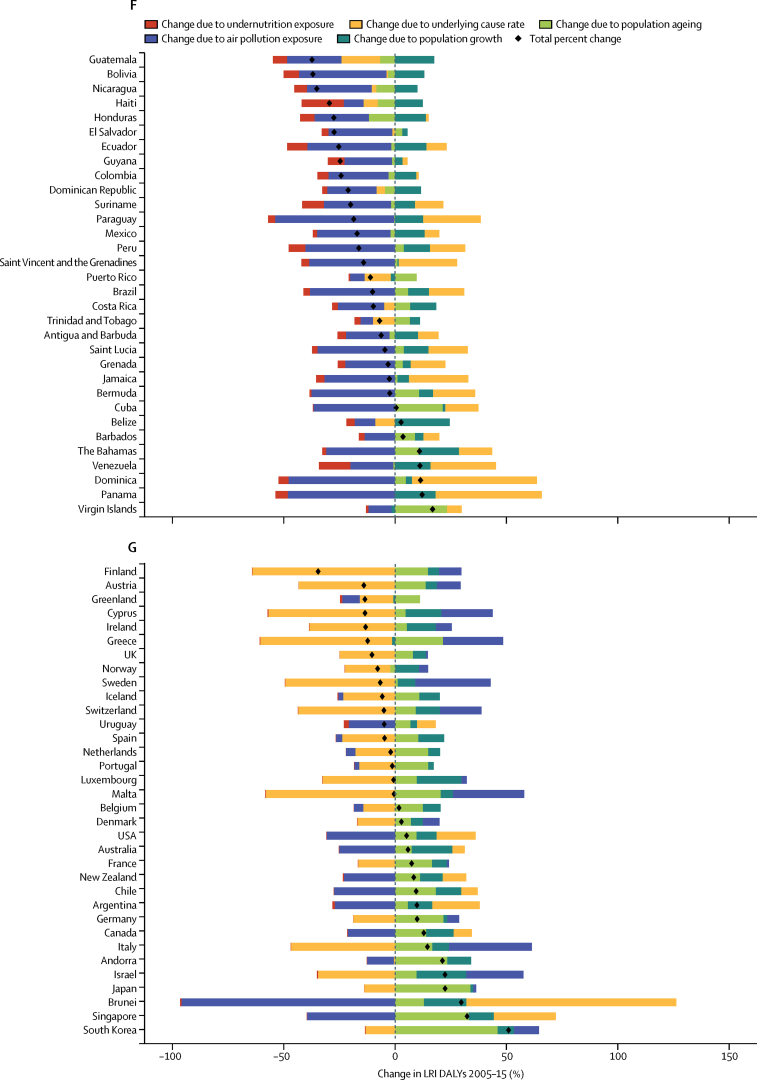
Methods: We estimated LRI mortality by age, sex, geography, and year using a modelling platform shared across most causes of death in the GBD 2015 study called the Cause of Death Ensemble model. We modelled LRI morbidity, including incidence and prevalence, using a meta-regression platform called DisMod-MR. We estimated aetiologies for LRI using two different counterfactual approaches, the first for viral pathogens, which incorporates the aetiology-specific risk of LRI and the prevalence of the aetiology in LRI episodes, and the second for bacterial pathogens, which uses a vaccine-probe approach. We used the Socio-demographic Index, which is a summary indicator derived from measures of income per capita, educational attainment, and fertility, to assess trends in LRI-related mortality. The two leading risk factors for LRI disability-adjusted life-years (DALYs), childhood undernutrition and air pollution, were used in a decomposition analysis to establish the relative contribution of changes in LRI DALYs.

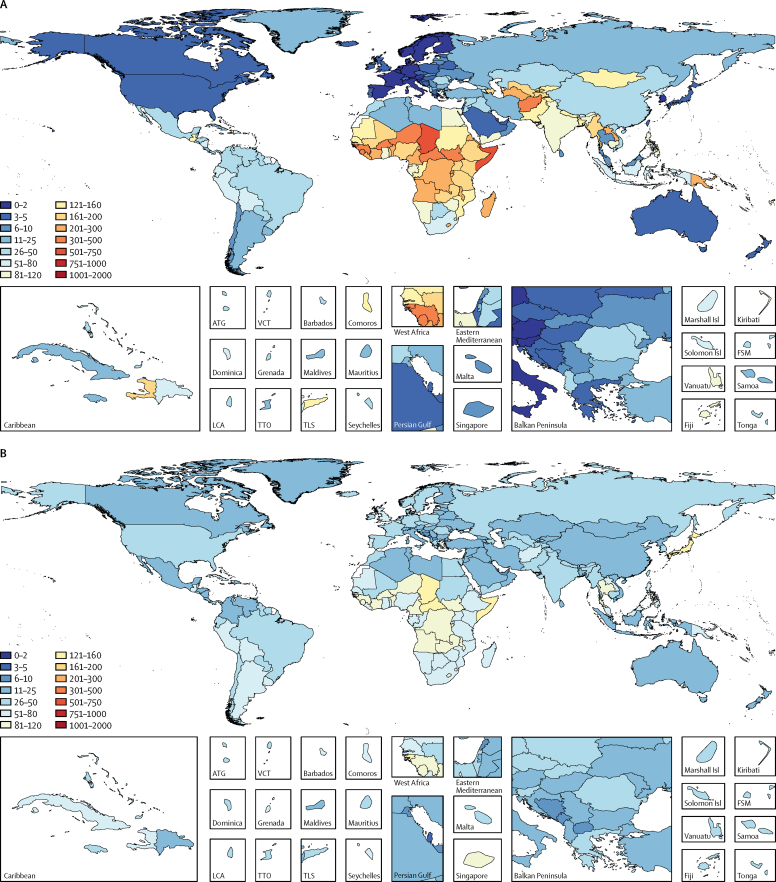
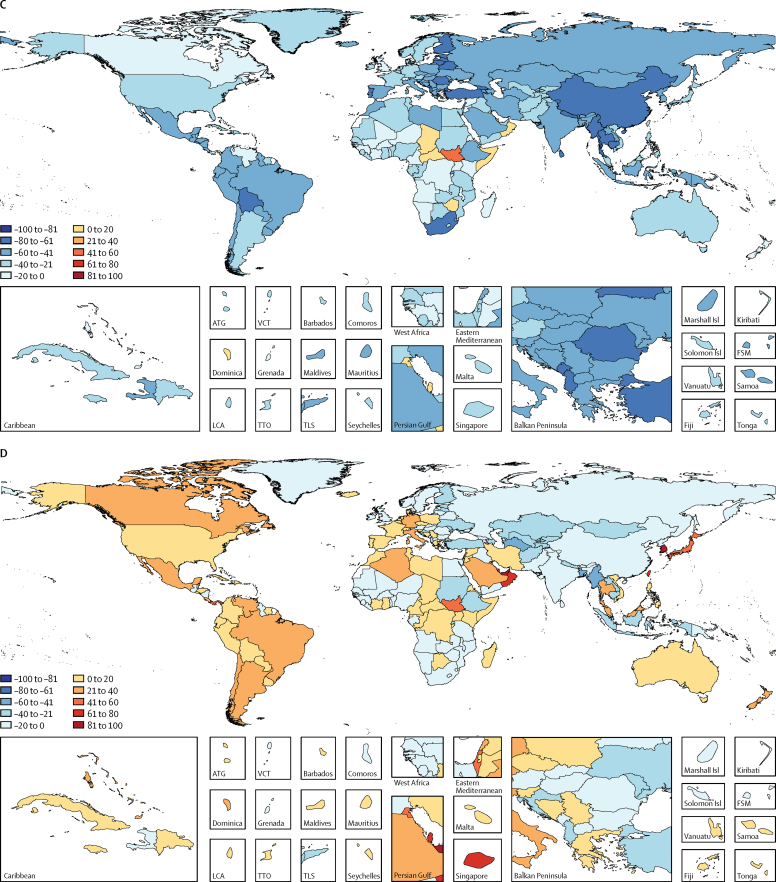
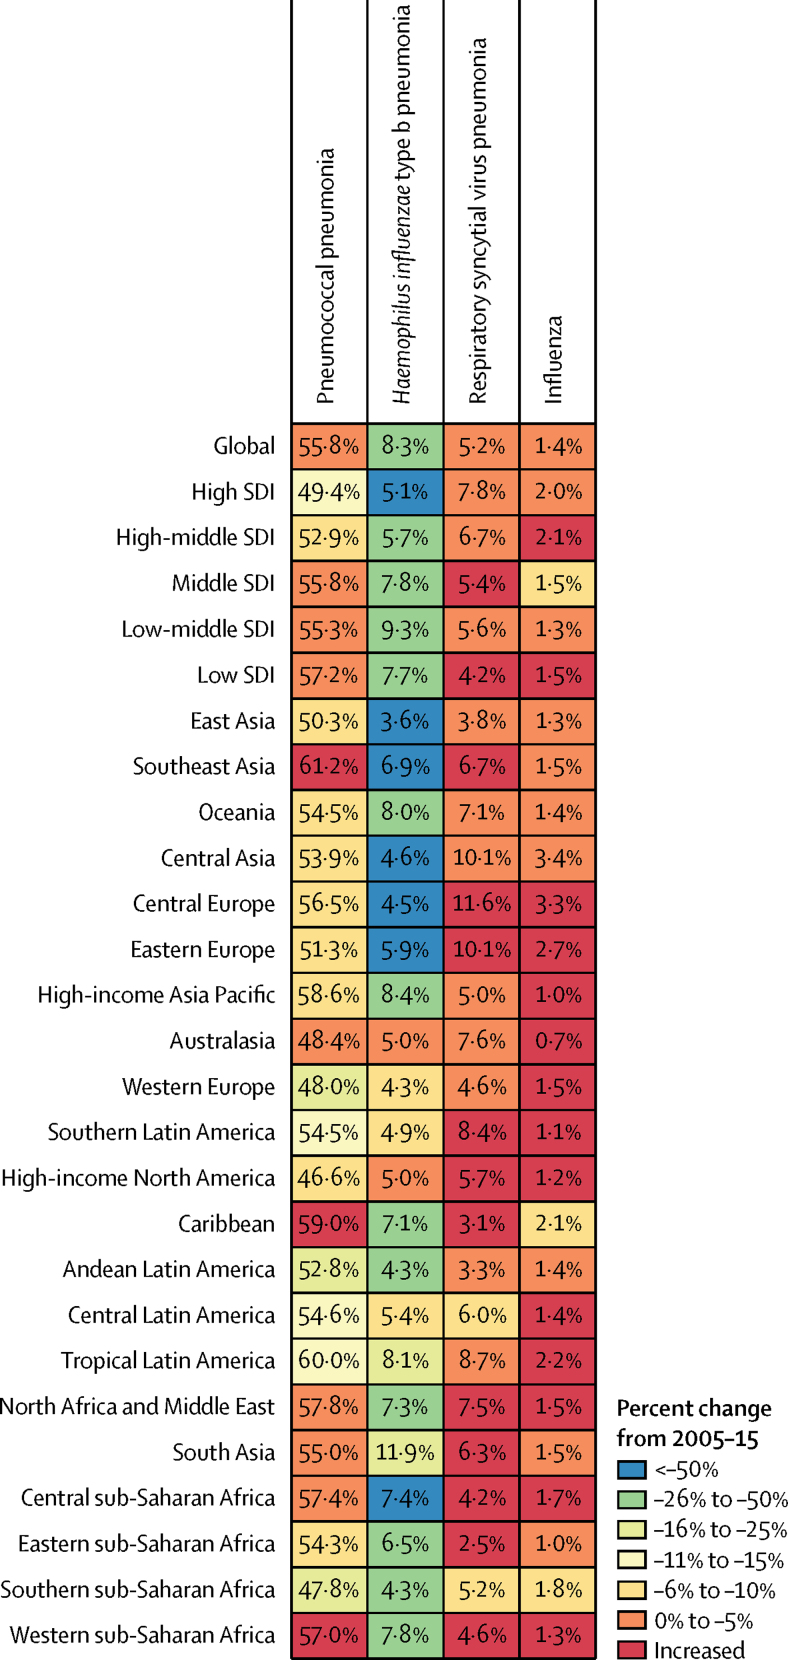
Findings: In 2015, we estimated that LRIs caused 2·74 million deaths (95% uncertainty interval [UI] 2·50 million to 2·86 million) and 103·0 million DALYs (95% UI 96·1 million to 109·1 million). LRIs have a disproportionate effect on children younger than 5 years, responsible for 704 000 deaths (95% UI 651 000-763 000) and 60.6 million DALYs (95ÙI 56·0-65·6). Between 2005 and 2015, the number of deaths due to LRI decreased by 36·9% (95% UI 31·6 to 42·0) in children younger than 5 years, and by 3·2% (95% UI -0·4 to 6·9) in all ages. Pneumococcal pneumonia caused 55·4% of LRI deaths in all ages, totalling 1 517 388 deaths (95% UI 857 940-2 183 791). Between 2005 and 2015, improvements in air pollution exposure were responsible for a 4·3% reduction in LRI DALYs and improvements in childhood undernutrition were responsible for an 8·9% reduction.

Interpretation: LRIs are the leading infectious cause of death and the fifth-leading cause of death overall; they are the second-leading cause of DALYs. At the global level, the burden of LRIs has decreased dramatically in the last 10 years in children younger than 5 years, although the burden in people older than 70 years has increased in many regions. LRI remains a largely preventable disease and cause of death, and continued efforts to decrease indoor and ambient air pollution, improve childhood nutrition, and scale up the use of the pneumococcal conjugate vaccine in children and adults will be essential in reducing the global burden of LRI.

Funding: Bill & Melinda Gates Foundation.


Figures

Figure 1
Figure 1
Global distribution of LRI mortality LRI mortality rate per 100 000 people in children younger than 5 years (A) and all ages (B) in 2015. Percent change in LRI deaths per 100 000 people between 2005 and 2015 in children younger than 5 years (C) and in all ages (D). LRI=lower respiratory tract infection. ATG=Antigua and Barbuda. VCT=Saint Vincent and the Grenadines. FSM=Federated States of Micronesia. LCA=Saint Lucia. TTO=Trinidad and Tobago. TLS=Timor-Leste.
Figure 1
Figure 1
Global distribution of LRI mortality LRI mortality rate per 100 000 people in children younger than 5 years (A) and all ages (B) in 2015. Percent change in LRI deaths per 100 000 people between 2005 and 2015 in children younger than 5 years (C) and in all ages (D). LRI=lower respiratory tract infection. ATG=Antigua and Barbuda. VCT=Saint Vincent and the Grenadines. FSM=Federated States of Micronesia. LCA=Saint Lucia. TTO=Trinidad and Tobago. TLS=Timor-Leste.
Figure 2
Figure 2
LRI burden by Global Burden of Diseases Study region plotted against SDI Under-5 LRI mortality rate per 100 000 (A) and incidence per child-year (B) is shown. Data points show 5-year increments from 1990 to 2015. The black line is a least-squares cubic spline regression, with knots at 0·4, 0·6, and 0·8, using the under-5 LRI mortality rate or incidence for each geographic location, and represents the expected rate based on SDI alone (estimates above the black line are higher than expected and those below are lower than expected). More information on the formulation and theory of the SDI can be found in the Cause of Death GBD 2015 capstone paper. LRI=lower respiratory tract infection. SDI=Sociodemographic Index.
Figure 3
Figure 3
Attributable fraction of LRI mortality in children younger than 5 years in 2015 Aetiologies for each GBD region are ordered by the global ranking. Numbers show the population attributable fraction in 2015, and colours show the percent change from 2005 to 2015. LRI=lower respiratory tract infection.
Figure 4
Figure 4
Risk factor decomposition of the change in attributable DALYs in all ages between 2005 and 2015 (A) Southeast Asia, east Asia, and Oceania; (B) north Africa and Middle East; (C) south Asia; (D) central Europe, eastern Europe, and central Asia; (E) sub-Saharan Africa; (F) Latin America and Caribbean; and (G) high-income WHO regions. Black dots show the overall percentage change in LRI DALYs and colours show contribution of different factors to the rate of change. Bars to the left of zero show a reduction in attribution and bars to the right show an increase. LRI=lower respiratory tract infection. DALY=disability-adjusted life-year.
Figure 4
Figure 4
Risk factor decomposition of the change in attributable DALYs in all ages between 2005 and 2015 (A) Southeast Asia, east Asia, and Oceania; (B) north Africa and Middle East; (C) south Asia; (D) central Europe, eastern Europe, and central Asia; (E) sub-Saharan Africa; (F) Latin America and Caribbean; and (G) high-income WHO regions. Black dots show the overall percentage change in LRI DALYs and colours show contribution of different factors to the rate of change. Bars to the left of zero show a reduction in attribution and bars to the right show an increase. LRI=lower respiratory tract infection. DALY=disability-adjusted life-year.

Comment in

Similar articles

Cited by

References

    1. GBD 2013 Mortality and Causes of Death Collaborators Global, regional, and national age-sex specific all-cause and cause-specific mortality for 240 causes of death, 1990–2013: a systematic analysis for the Global Burden of Disease Study 2013. Lancet. 2015;385:117–171. - PMC - PubMed
    1. Bhutta ZA, Das JK, Walker N. Interventions to address deaths from childhood pneumonia and diarrhoea equitably: what works and at what cost? Lancet. 2013;381:1417–1429. - PubMed
    1. UN Department of Economic and Social Affairs Sustainable Development Goal 3: ensure healthy lives and promote well-being for all at all ages. 2017. https://sustainabledevelopment.un.org/sdg3 (accessed Oct 10, 2016).
    1. GBD 2015 Disease and Injury Incidence and Prevalence Collaborators Global, regional, and national incidence, prevalence, and years lived with disability for 310 diseases and injuries, 1990–2015: a systematic analysis for the Global Burden of Disease Study 2015. Lancet. 2016;388:1545–1602. - PMC - PubMed
    1. GBD 2015 Mortality and Causes of Death Collaborators Global, regional, and national life expectancy, all-cause and cause-specific mortality for 249 causes of death, 1980–2015: a systematic analysis for the Global Burden of Disease Study 2015. Lancet. 2016;388:1459–1544. - PMC - PubMed

Publication types