. 2017 Sep 5;25(9):1403-1414.e3.
doi: 10.1016/j.str.2017.07.008. Epub 2017 Aug 24.

YidC Insertase of Escherichia coli: Water Accessibility and Membrane Shaping

Affiliations

YidC Insertase of Escherichia coli: Water Accessibility and Membrane Shaping

Yuanyuan Chen et al. Structure. .

Abstract

The YidC/Oxa1/Alb3 family of membrane proteins function to insert proteins into membranes in bacteria, mitochondria, and chloroplasts. Recent X-ray structures of YidC from Bacillus halodurans and Escherichia coli revealed a hydrophilic groove that is accessible from the lipid bilayer and the cytoplasm. Here, we explore the water accessibility within the conserved core region of the E. coli YidC using in vivo cysteine alkylation scanning and molecular dynamics (MD) simulations of YidC in POPE/POPG membranes. As expected from the structure, YidC possesses an aqueous membrane cavity localized to the membrane inner leaflet. Both the scanning data and the MD simulations show that the lipid-exposed transmembrane helices 3, 4, and 5 are short, leading to membrane thinning around YidC. Close examination of the MD data reveals previously unrecognized structural features that are likely important for protein stability and function.

Keywords: YidC; alkylation; aqueous access; cysteine-scanning mutagenesis; membrane protein folding; membrane protein insertion; membrane thinning; molecular dynamics.


Figures

Figure 1
Figure 1
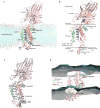
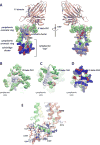
The transmembrane region of the YidC insertase becomes more compact and ordered in POPE/POPG bilayers. E. coli YidC has six TM helices, but TM1 near the N-terminus, which is not required for normal functioning, was disordered and not observed in the structure. Consequently, the observable TM helices in the structure are numbered 2 through 6. The colors of the helices are preserved for all figures in the paper (TM2, red; TM3, orange; TM4, yellow; TM5, green; TM6, blue). A. A snapshot of the equilibrated structure of E. coli YidC in a POPE:POPG (75:25) bilayer. The front half of the bilayer facing the viewer has been removed to show more clearly the arrangement of the YidC helices. B. The crystal structure of E. coli YidC determined by Kumazaki et al. (2014b); structural regions designated by Kumazaki et al. are shown. Because of crystal disorder, residues 480–492 in the TM4-TM5 loop were missing in the structure (dashed pink line). For the MD simulations, the missing loop residues were modeled into the protein using Phyre2 (Kelley et al., 2015). C. The crystal structure in panel B, shown in this panel in black, has been overlaid on the simulation structure shown in panel A to reveal that the most significant differences between the two structures occur in the C1 region (panel B). We attribute the compaction of the C1 region to interactions between POPE and POPG that are missing in the crystals, which contain only glycerol monoölein. D. Summary of NEM exposure of residues in helices PH1 and CH2. We arbitrarily define inaccessibility as 30% or less modified by NEM, partially accessible by 30%–75% labeling, and fully accessible by greater than 75% labeling. Notice that the amphipathic character of PH1 buried in the membrane interface is clearly revealed by the accessibilities (unexposed on the surface facing the bilayer hydrocarbon core; highly exposed on the surface facing the periplasm). The labeled residues on the CH2 helix reveal only partial exposure for all labeled residues. High exposures would be expected based on the crystal structure alone, because CH2 is not able to engage a membrane interface.
Figure 2
Figure 2
Cys-based alkylation method to map the lipid and solvent exposed membrane regions of YidC. A. The gel-shift assay employed to examine whether a Cys residue is in a solvent- or lipid-exposed environment. The solvent-exposed YidC 24C and lipid exposed 11C, as well as Cys-less control were analyzed in this example. BL21 cells expressing the indicated YidC mutants were treated with or without NEM, washed and analyzed as described in the Experimental Procedures. Where indicated, the samples were treated with Mal-PEG, which modifies unreacted Cys residues, and then analyzed by SDS-PAGE and Western blot. Solvent exposures were quantitated using optical scans of the blots (STAR Methods). B. Complementation assay for monitoring the activity of the YidC mutants. JS7131 cells harboring the indicated pEH1YidC Cys mutant were grown under YidC expression condition (top panel) and YidC depletion (bottom panel). For controls, JS7131 cells with vector encoding the Cys-less YidC (C423S) mutant or with the empty vector (pEH1) were analyzed. C. Summary of the accessibility of Cys residues introduced into helices TM2 through TM6 to map the solvent and lipid exposed residues following the procedures summarized in Panel A. In all cases, the samples were treated with NEM followed by treatment with Mal-PEG, as discussed for panel A. The entire data set is shown in Figures S1 and S2.
Figure 3
Figure 3
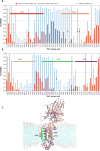
The water accessibilities of YidC residues determined by the NEM assays generally agree with water accessibilities determined from the MD simulations of YidC in POPE/POPG bilayers. Accessibilities determined by the NEM assays are shown as light blue bars; accessibilities determined from the MD simulation are shown as red bars. The vertical arrows indicate four residues for which significant discrepancies exist between the NEM and MD data. We arbitrarily define inaccessibility as 30% or less modified by NEM, partially accessible by 30%–75% labeling, and fully accessible by greater than 75% labeling. Vertical arrows indicate residues with high NEM exposure but low MD-determined accessibility. A. Accessibility results for residues 350–461. B. Accessibility results for residues 462–528. C. Structure of YidC in the lipid bilayer showing the four residues (vertical arrows, panels A and B) for which significant discrepancies exist between the NEM and MD results. L427, I432, L434, and V500 have significant exposure (greater than 30%) according to NEM labeling but virtually no exposure according to the MD results.
Figure 4
Figure 4
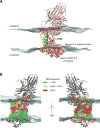
Water accessibilities in the context of the in-bilayer YidC structure reveal a narrow band of inaccessibility near the bilayer midplane. A. A snapshot from the MD simulation showing the waters within 6 Å of the protein. The headgroup/hydrocarbon boundary defined by the glycerol C-2 carbons (Wiener and White, 1992) is shown as a transparent blue surface constructed using Delaunay triangulation. Waters can penetrate roughly to the middle of the protein due to hydration of the strictly conserved Arg366 residue. B. NEM water accessibility of TM-segment amino acids represented by wire-frame surfaces colored according to NEM exposure.
Figure 5
Figure 5
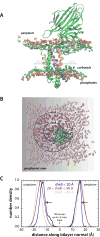
YidC thins and flattens the membrane in its vicinity. A. A snapshot of E. coli embedded in the POPE:POPG membrane. The lipid carboxyl (cyan) and phosphate (orange) groups are drawn as van der Waals spheres. Except for the interfacial and transmembrane helices colored as in Figure 1, the protein is colored green. The image shows that the membrane is thinnest and quite flat within a radius of 20 Å of R366 due to interactions described in Figure 6. R366 is located at the center of mass of the TM helices and is about 11 Å above the cytoplasmic lipid carbonyl plane. B. View of the membrane-embedded protein from the periplasm along an axis normal to the membrane plane. The spheres represent the lipid carbonyl groups located within 20 Å (blue), between 20 and 40 Å (purple), and greater than 40 Å (pink) from R366 as projected onto the bilayer plane. The faded spheres are on the cytoplasmic surface. C. Distributions of lipid carbonyl positions projected onto the bilayer normal as a function of distance from the protein center of mass at R366. Within the 20-Å shell, bilayer thickness is about 28 Å whereas in the outer shell the average thickness is about 33 Å; the change is asymmetric with respect to R366. Of the approximate 5-Å increase in thickness, about 3 Å can be attributed to cytoplasmic half and 2 Å to the periplasmic half. The distributions were determined over the last 80 ns of the simulation (Figure S5A, Figure S5D, and Table S3).
Figure 6
Figure 6
Several significant structural features of YidC stabilize it in the POPE:POPG bilayer. A. Rings of aromatic residues on both the periplasmic and cytoplasmic surfaces stabilize the protein in the bilayer interfaces. Beneath the cytoplasmic aromatic ring is a salt-bridge cluster that, together with the aromatic ring, forms a tightly packed cytoplasmic cap. A striking feature is the 9-residue aromatic cluster (F433, Y437, F502, F505, F506, W508, F509, Y516, Y517) located near the periplasmic surface. Notice that R366 is situated toward the cytoplasm directly beneath the aromatic cluster. B. The periplasmic aromatic ring, represented by van der Waals spheres. The amphipathic aromatic-rich interfacial helix PH1 on the periplasmic surface should provide strong anchoring in the periplasmic membrane surface (Schibli et al., 2002; Yau et al., 1998). C. The cytoplasmic aromatic ring is composed of seven aromatic residues. D. Cytoplasmic view of the protein that includes the salt-bridge cluster sitting above the cytoplasmic aromatic ring. Basic residues are colored blue and acidic residues red. E. The cytoplasmic cap viewed parallel to the membrane, including H-bonds (black dashes). Lipid phosphates (orange), basic residues (blue), and acidic residues (red) are represented in stick format. The salt bridges are shown more clearly in Movie 4. The significant salt-bridge pairs are R394-D399, K389-E415, and R396-E407. The residues that H-bond to lipid phosphates include K374, R403, K413, and K493.
Figure 7
Figure 7
Two highly conserved tyrosine residues, Y516 and Y517, form a hydrophobic lid facing toward the periplasm above the critical arginine residue (R366). A. The tyrosines are hydrogen bonded to R366 via intervening waters. We suggest that these tyrosines play two important roles: they stabilize the position of R366 and they provide a hydrophobic transition to the hydrophobic core of the protein, which in the case of YidC is comprised of the aromatic cluster (Figure 6A). B. The stabilizing tyrosine-arginine hydrogen bonding causes R366 on TM helix 2 to be set well back into the protein toward TM helices 5 and 6. C, D. Residues, represented by blue van der Waals spheres, that have been shown to interact strongly with the single-span capsid protein pf3 during YidC-mediated insertion (Klenner and Kuhn, 2012) have been added to the Panel A and Panel B structures. Transparent stick models of the carbonyl (cyan) and phosphate (orange) groups define the bilayer surfaces. The structure is consistent with the idea that TM helices 3 and 5 act as a 'greasy slide' for nascent single-span TM helices (Dalbey and Kuhn, 2014). E. This periplasmic view shows that all of the strongly acting residues are located on the membrane-facing surfaces of TM helices 3 and 5, well away from R366. F. The water accessibility (Figure 4) is shown superimposed on the structure of Panel C. Waters apparently can penetrate from the cytoplasmic side into the protein only up to F505 and M430.

References

    1. Borowska MT, Dominik PK, Anghel SA, Kossiakoff AA, Keenan RJ. A YidC-like protein in the archaeal plasma membrane. Structure. 2015;23:1715–1724. - PMC - PubMed
    1. Burley SK, Petsko GA. Aromatic-aromatic interaction: A mechanism of protein structure stabilization. Science. 1985;229:23–28. - PubMed
    1. Celebi N, Yi L, Facey SJ, Kuhn A, Dalbey RE. Membrane biogenesis of subunit II of cytochrome bo oxidase: Constrasting requirements for insertion of N-terminal and C-terminal domains. J. Mol. Biol. 2006;357:1428–1436. - PubMed
    1. Celebi N, Dalbey RE, Yuan J. Mechanism and hydrophobic forces driving membrane protein insertion of subunit II of cytochrome bo3 oxidase. J. Mol. Biol. 2007;375:1282–1292. - PMC - PubMed
    1. Chen M, Samuelson JC, Jiang F, Muller M, Kuhn A, Dalbey RE. Direct interaction of YidC with the sec-independent Pf3 coat protein during its membrane protein insertion. J. Biol. Chem. 2002;277:7670–7675. - PubMed

MeSH terms