. 2017 Sep 11;27(17):2652-2660.e4.
doi: 10.1016/j.cub.2017.07.033. Epub 2017 Aug 30.

Unmasking Transcriptional Heterogeneity in Senescent Cells

Affiliations

Unmasking Transcriptional Heterogeneity in Senescent Cells

Alejandra Hernandez-Segura et al. Curr Biol. .

Abstract

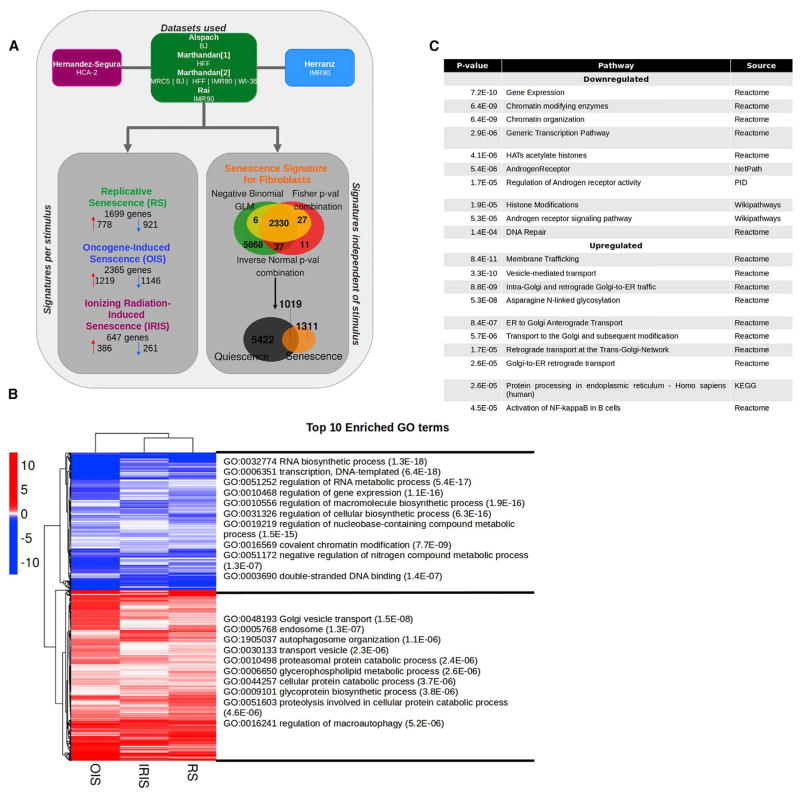
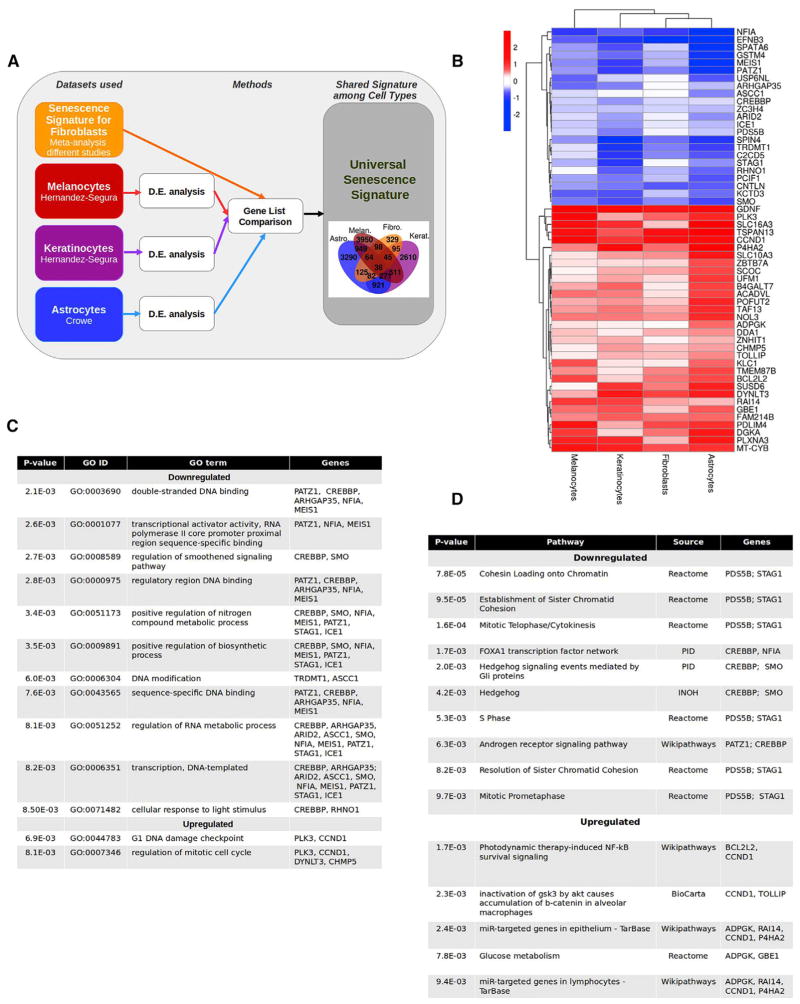
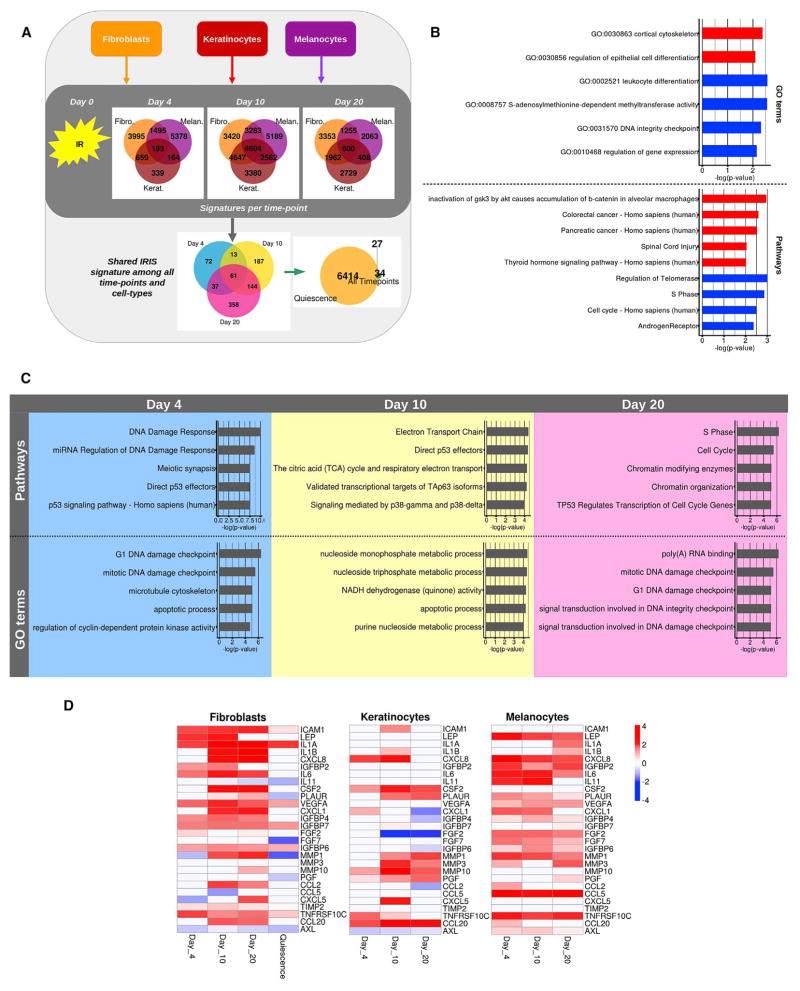
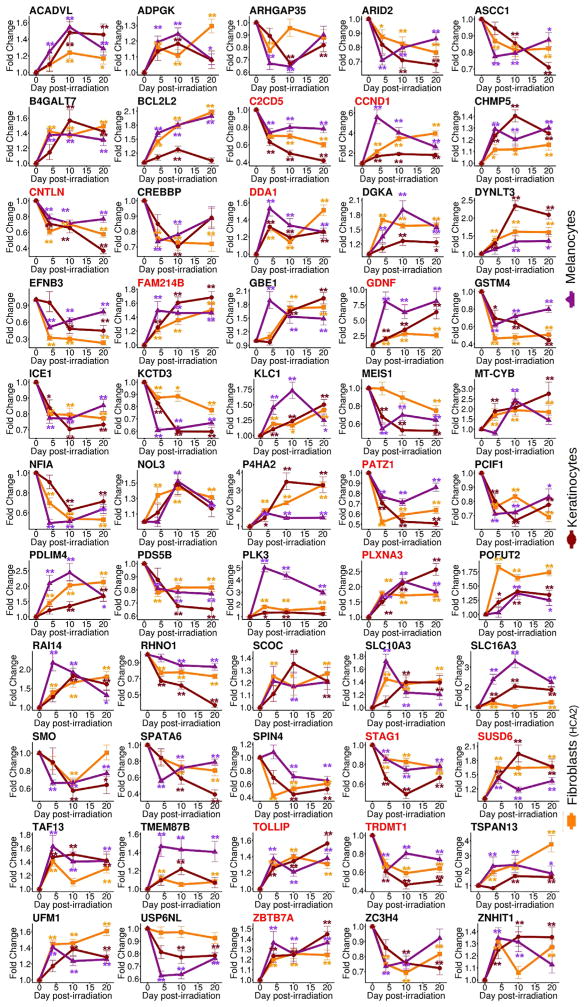
Cellular senescence is a state of irreversibly arrested proliferation, often induced by genotoxic stress [1]. Senescent cells participate in a variety of physiological and pathological conditions, including tumor suppression [2], embryonic development [3, 4], tissue repair [5-8], and organismal aging [9]. The senescence program is variably characterized by several non-exclusive markers, including constitutive DNA damage response (DDR) signaling, senescence-associated β-galactosidase (SA-βgal) activity, increased expression of the cyclin-dependent kinase (CDK) inhibitors p16INK4A (CDKN2A) and p21CIP1 (CDKN1A), increased secretion of many bio-active factors (the senescence-associated secretory phenotype, or SASP), and reduced expression of the nuclear lamina protein LaminB1 (LMNB1) [1]. Many senescence-associated markers result from altered transcription, but the senescent phenotype is variable, and methods for clearly identifying senescent cells are lacking [10]. Here, we characterize the heterogeneity of the senescence program using numerous whole-transcriptome datasets generated by us or publicly available. We identify transcriptome signatures associated with specific senescence-inducing stresses or senescent cell types and identify and validate genes that are commonly differentially regulated. We also show that the senescent phenotype is dynamic, changing at varying intervals after senescence induction. Identifying novel transcriptome signatures to detect any type of senescent cell or to discriminate among diverse senescence programs is an attractive strategy for determining the diverse biological roles of senescent cells and developing specific drug targets.

Keywords: DNA damage; RNA-seq; SASP; cell-cycle arrest; cellular senescence; primary cells; qPCR; transcriptional signatures; tumor suppression; whole-transcriptome sequencing.


Figures

Figure 1
Figure 1. Meta-Analysis of Senescent Fibroblast Transcriptomics
(A) Experimental design. Seven RNA-seq datasets obtained from the indicated studies were used to build a stimulus-specific signature and general signature of senescent fibroblasts, regardless of the stimulus. Only genes with a p ≤ 0.01, calculated by the three methods and with expression unchanged or in the opposite direction in quiescence, were included in each signature. The number of genes constituting each signature is displayed in the flower plot. (B) Heatmap of the 1,311 genes in the senescence signature of fibroblasts and the top 10 enriched GO terms. The graph shows the logarithm base 2 of the fold change for each senescence-inducing stimulus tested with respect to proliferating cells. Blue indicates downregulated genes; red indicates upregulated genes. (C) Top 10 enriched pathways in the senescence signature of fibroblasts. The pathways enriched in genes within the senescence signature of fibroblasts (in B) are enlisted with their corresponding p value and source. ER, endoplasmic reticulum. HAT, histone acetyltransferases; KEGG, Kyoto Encylopedia of Genes and Genomes; PID, Pathway Interaction Database. See also Figure S1 and Data S1.
Figure 2
Figure 2. Characteristics of the Core Senescence-Associated Signature
(A) Experimental design. RNA-seq datasets obtained from the indicated studies of melanocytes, keratinocytes, and astrocytes were compared to the senescence signature of fibroblasts. The intersection of genes differentially expressed (p ≤ 0.01) in all the datasets are shown in the flower plot. D.E., differential expression. (B) Heatmap of the 55 genes of the senescence core signature. The figure shows the logarithm base 2 of the fold change for each cell type with respect to proliferating cells. (C) GO terms enriched in the core senescence signature. The GO terms enriched in genes within the core senescence signature (in B) are listed with the corresponding p value and the associated genes. (D) Pathways enriched in the core signature of senescence. The pathways enriched in genes within the core senescence signature (in B) are listed with their corresponding p value, source, and the associated genes. INOH, integrating network objects with hierarchies; NF-κB, nuclear factor κB; PID, Pathway Interaction Database. See also Figures S2 and S3 and Data S2.
Figure 3
Figure 3. Temporal Dynamics of the Senescence Transcriptome
(A) Experimental design. Fibroblasts (HCA-2; yellow), melanocytes (red), and keratinocytes (magenta) were exposed to ionizing radiation (IR), and RNA was harvested 4, 10, or 20 days later. Transcriptomes of the different cell types and intervals after senescence induction were obtained by RNA-seq. A time-point signature with genes differentially expressed (p ≤ 0.01) in all three cell types and a shared IR-induced senescence (IRIS) signature with genes shared by all cell types and time points (p ≤ 0.01) were generated. (B) GO terms and pathways enriched in the shared IRIS signature among all time points and cell types. The figure shows enriched GO terms in the upregulated (red) and downregulated (blue) genes of the signature. Bars indicate the logarithm base 10 of the p value. (C) Top 5 GO terms and pathways enriched at each time point. The figure shows the enriched GO terms and pathways for days 4, 10, and 20. Bars indicate the logarithm base 10 of the p value. (D) Heatmap showing the dynamics of genes encoding SASP factors for each cell type. Known SASP factors that were significantly differentially expressed during at least one time point in each cell type are shown. The heatmap shows the logarithm base 2 of the fold change for each time post-irradiation with respect to proliferating cells. Quiescence was measured only on fibroblasts. The violet arrows highlight MMP1, the only SASP factor commonly regulated at days 10 and 20 in all cell types. See Figure S4 and Data S3.
Figure 4
Figure 4. Dynamic Changes in Expression of Genes in the Core Senescence Signature
Each panel shows one of the 55 genes in the core signature at the indicated points before and after irradiation. All genes show a dynamic temporal behavior at the time points tested: day 0 (proliferation), day 4, day 10, and day 20 after irradiation. Notably, all genes show a similar trend in the three cell types tested: fibroblasts (yellow), keratinocytes (red), and melanocytes (magenta). Genes in red correspond to those that reached significance (p ≤ 0.01) at all time points tested. N = 6. *p ≤ 0.05; **p ≤ 0.01. See also Figure S4 and Data S3.

References

    1. Loaiza N, Demaria M. Cellular senescence and tumor promotion: is aging the key? Biochim Biophys Acta. 2016;1865:155–167. - PubMed
    1. Serrano M, Lin AW, McCurrach ME, Beach D, Lowe SW. Oncogenic ras provokes premature cell senescence associated with accumulation of p53 and p16INK4a. Cell. 1997;88:593–602. - PubMed
    1. Muñoz-Espín D, Cañamero M, Maraver A, Gómez-López G, Contreras J, Murillo-Cuesta S, Rodríguez-Baeza A, Varela-Nieto I, Ruberte J, Collado M, Serrano M. Programmed cell senescence during mammalian embryonic development. Cell. 2013;155:1104–1118. - PubMed
    1. Storer M, Mas A, Robert-Moreno A, Pecoraro M, Ortells MC, Di Giacomo V, Yosef R, Pilpel N, Krizhanovsky V, Sharpe J, Keyes WM. Senescence is a developmental mechanism that contributes to embryonic growth and patterning. Cell. 2013;155:1119–1130. - PubMed
    1. Meyer K, Hodwin B, Ramanujam D, Engelhardt S, Sarikas A. Essential role for premature senescence of myofibroblasts in myocardial fibrosis. J Am Coll Cardiol. 2016;67:2018–2028. - PubMed