. 2017 Sep 19;47(3):552-565.e4.
doi: 10.1016/j.immuni.2017.08.003. Epub 2017 Aug 24.

Phenolic Glycolipid Facilitates Mycobacterial Escape from Microbicidal Tissue-Resident Macrophages

Affiliations

Phenolic Glycolipid Facilitates Mycobacterial Escape from Microbicidal Tissue-Resident Macrophages

C J Cambier et al. Immunity. .

Abstract

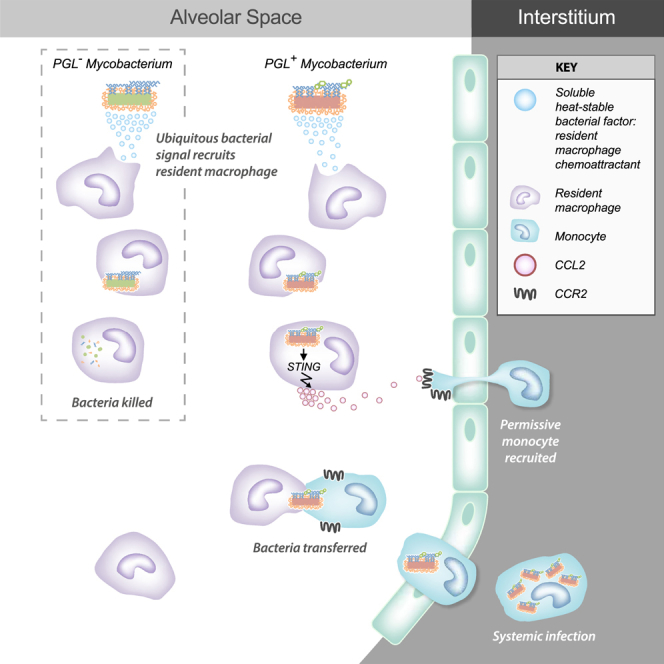
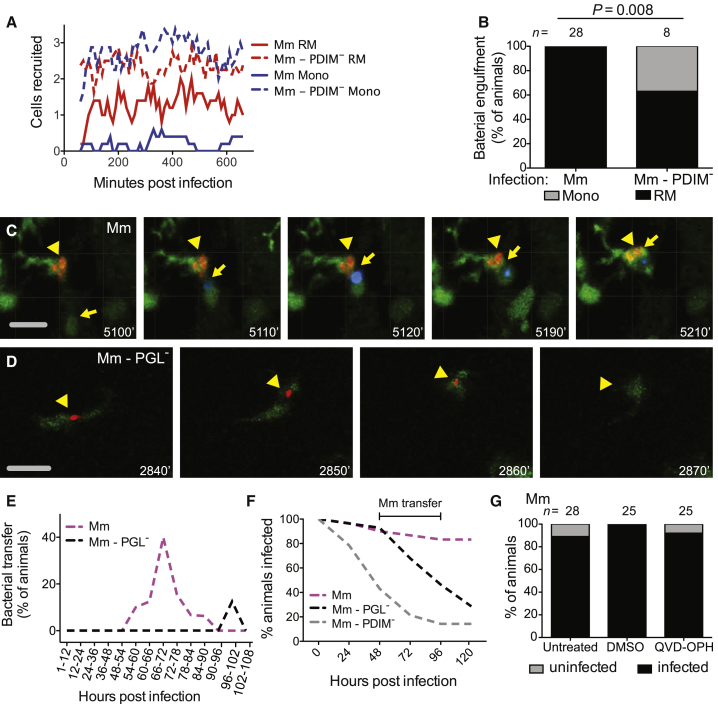
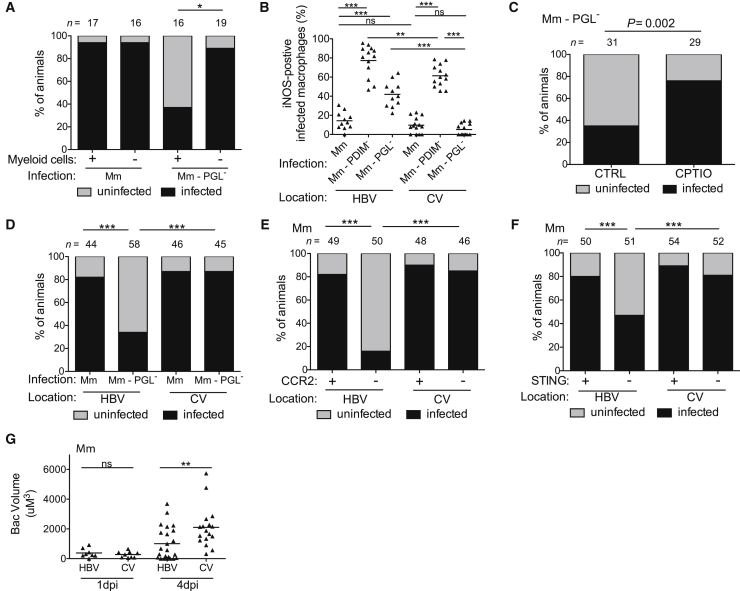
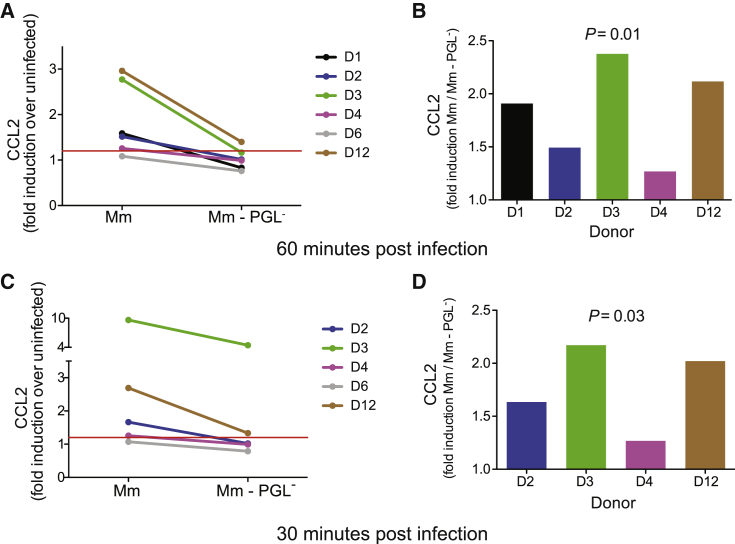
Mycobacterium tuberculosis (Mtb) enters the host in aerosol droplets deposited in lung alveoli, where the bacteria first encounter lung-resident alveolar macrophages. We studied the earliest mycobacterium-macrophage interactions in the optically transparent zebrafish. First-responding resident macrophages phagocytosed and eradicated infecting mycobacteria, suggesting that to establish a successful infection, mycobacteria must escape out of the initially infected resident macrophage into growth-permissive monocytes. We defined a critical role for mycobacterial membrane phenolic glycolipid (PGL) in engineering this transition. PGL activated the STING cytosolic sensing pathway in resident macrophages, inducing the production of the chemokine CCL2, which in turn recruited circulating CCR2+ monocytes toward infection. Transient fusion of infected macrophages with CCR2+ monocytes enabled bacterial transfer and subsequent dissemination, and interrupting this transfer so as to prolong mycobacterial sojourn in resident macrophages promoted clearing of infection. Human alveolar macrophages produced CCL2 in a PGL-dependent fashion following infection, arguing for the potential of PGL-blocking interventions or PGL-targeting vaccine strategies in the prevention of tuberculosis. VIDEO ABSTRACT.


Figures

None
Graphical abstract
Figure 1
Figure 1
Resident Macrophages Are First Responders to Bacterial Infection (A) Cartoon of a 2 day post-fertilization (dpf) zebrafish showing the caudal vein (CV) and hindbrain ventricle (HBV) injection sites and representative image of HBV (outlined with white dashed line) with Hoechst dye negative resident macrophages (black arrowheads) and Hoechst dye positive monocyte (black arrow). Scale bar, 100 μm. (B) Mean resident macrophage (RM) and monocyte (Mono) recruitment at 3 hr post infection (hpi) into the HBV after infection with 80 wild-type Mm (Mm) or PGL-deficient Mm (Mm-PGL). Significance testing done using one-way ANOVA, with Bonferroni’s post-test against mock injections. ∗∗p < 0.01. (C) Mean resident macrophage and monocyte recruitment at 3 hpi into the HBV of wild-type or Ccr2-deficient fish after infection with 80 wild-type Mm. Significance testing done using one-way ANOVA, with Bonferroni’s post-test for comparisons shown. ∗∗p < 0.01. (D) Representative images of uninfected resident macrophages (black arrowheads), uninfected monocytes (black arrows), infected resident macrophages (red arrowheads), infected monocytes (red arrows), and extracellular bacteria (white arrow) following infection of wild-type fish in the HBV with 80 wild-type green fluorescent Mm at 30, 60, and 120 min post infection (mpi). Scale bar, 20μm. (E) Mean resident macrophage and monocyte recruitment from 5 to 150 mpi in the HBV of wild-type or Ccr2-deficient fish after infection with 80 wild-type Mm. (F) Mean resident macrophage and monocyte recruitment from 5 to 180 mpi in the HBV of wild-type or Myd88-deficient fish after infection with 80 PDIM-deficient Mm (Mm – PDIM). (G and H) Mean resident macrophage, monocyte, and neutrophil (Neut) recruitment from 5 to 180 mpi in the HBV of wild-type or Myd88-deficient fish following infection with 138 S. aureus (G) or 156 P. aeruginosa (H). (I) Mean resident macrophage and monocyte recruitment from 5 to 150mpi in the HBV of wild-type fish after injection with 80 wild-type Mm, 300 sterile beads, or mock injection. (J) Mean resident macrophage and monocyte recruitment from 5 to 150 mpi in the HBV of wild-type fish after infection with 80 wild-type Mm, an equivalent volume of wild-type Mm supernatant (Sup), or media mock. (K and L) Mean resident macrophage, monocyte, and neutrophil recruitment from 5 to 180 mpi in the HBV of wild-type fish after infection with S. aureus supernatant (K) or P. aeruginosa supernatant (L). (A – L) Results representative of at least three independent experiments.
Figure 2
Figure 2
Mycobacteria Mediate CCR2-Dependent Monocyte Recruitment by Actively Inducing CCL2 in Resident Macrophages (A) ccl2 messenger RNA levels (mean ± SEM of three biological replicates) induced at 3 hr after caudal vein infection of 2 dpf wild-type or myeloid cell-deficient fish with 250–300 wild-type Mm. (B–D) In situ hybridizations against zebrafish ccl2 mRNA following hindbrain ventricle infections with vehicle (bacterial media) (B), 80 wild-type Mm (C), 80 Mm - PGL (D). Black arrows, ccl2 mRNA-positive phagocytes; white arrows ccl2 mRNA-negative phagocytes. Scale bar, 50μm. Results representative of three independent experiments. (E) Mean brain resident macrophage numbers of csfr1+/− and csfr1−/− zebrafish at 2dpf. Results representative of two independent experiments. (F) Mean resident macrophage and monocyte recruitment from 5 to 150 mpi in the HBV of csfr1+/− or csfr1−/− fish after infection with 80 wild-type Mm. (G) ccl2 messenger RNA levels (mean ± SEM of three biological replicates) induced at 3 hr after caudal vein infection of 2 dpf wild-type fish with 250–300 live or heat-killed wild-type Mm. (H) Mean resident macrophage and monocyte recruitment from 5 to 120 mpi in the HBV of wild-type fish after infection with 80 live or heat-killed (HK) wild-type Mm. (I) Mean resident macrophage and monocyte recruitment from 5 to 150 mpi in the HBV of csfr1+/− or csfr1−/− fish after infection with 80 Mm - PDIM. (J) Mean resident macrophage and monocyte recruitment from 5 to 150 mpi in the HBV of wild-type fish after infection with 80 live or heat-killed (HK) Mm - PDIM. (K) Mean resident macrophage and monocyte recruitment from 5 to 120 mpi in the HBV of wild-type fish after infection with 80 wild-type or PDIM Mm. Results in (F) and (H) through (K) representative of at least three independent experiments.
Figure 3
Figure 3
Mm PGL Recruits Monocytes through STING-Dependent ccl2 Induction (A) ccl2 messenger RNA levels (mean ± SEM of three biological replicates) induced at 3 hr after caudal vein infection of 2 dpf wild-type or Sting-deficient fish with 250–300 wild-type Mm. Student’s unpaired t test. (B and C) In situ hybridizations against zebrafish ccl2 mRNA following hindbrain ventricle infections with 80 wild-type Mm into wild-type (B) or Sting-deficient (C) zebrafish. Black arrows, ccl2 mRNA-positive phagocytes; white arrows ccl2 mRNA-negative phagocytes. Scale bar, 50μm. Results representative of three independent experiments. (D) Mean resident macrophage and monocyte recruitment from 5 to 180 mpi in the HBV of wild-type or Sting-deficient fish after infection with 80 wild-type Mm. (E) Mean resident macrophage and monocyte recruitment from 5 to 180 mpi in the HBV of wild-type or Sting-deficient fish after infection with 80 Mm - PDIM-. (F) Percentage of infected (black) or uninfected (gray) wild-type or Sting-deficient fish 5 dpi with 1-3 wild-type Mm into the HBV. n = number of larvae per group. Results representative of two independent experiments. Significance testing done using Fisher’s exact test. (G) ccl2, ifnΦ1, ifnΦ2, and ifnΦ3 mRNA levels (mean ± SEM of three biological replicates) induced at 3 hr after caudal vein infection of 2 dpf wild-type fish with 250–300 wild-type Mm. Significance testing done using Student’s unpaired t test for each gene. p = 0.002 for ccl2, all other comparisons not significant. (H) Mean resident macrophage and monocyte recruitment from 5 to 150 mpi in the HBV of wild-type fish after infection with 80 wild-type or ESX-1-deficient (ESX1) Mm. (I) Percentage of infected (black) or uninfected (gray) wild-type fish 5 dpi of 1–3 wild-type, ESX1, or PGL Mm into the HBV. n = number of larvae per group. Significance testing done using Fisher’s exact test for comparisons shown. ∗∗p < 0.01, ∗∗∗p < 0.001. Results representative of two independent experiments. Results in (D), (E), and (H) representative of three independent experiments.
Figure 4
Figure 4
PGL Promotes Intercellular Bacterial Transfer and Prevents Bacterial Clearance (A) Mean (≥5 biological replicates) number of resident macrophages and monocytes occupying the HBV at each time point, quantified every 10 min from 1 to 11 hpi in Tg (mpeg1::yfp) fish with green fluorescent macrophages after infection with 1–3 wild-type or PDIM red fluorescent Mm. (B) Percentage of fish where the infecting bacteria were phagocytosed by a resident macrophage (black) or a monocyte (gray) over the first 11 hr following infection of Tg (mpeg1:YFP) fish in the HBV with red fluorescent 1–3 wild-type or PDIM Mm. n = number of larvae per group. Significance testing done using Fisher’s exact test. Results representative of three independent experiments. (C) Representative images from a time-lapse movie of a bacterial transfer event. Uninfected Hoechst positive (blue fluorescence) monocyte (yellow arrow) is seen phagocytosing an infected cell (yellow arrowhead). Scale bar, 50 μm. Time stamp, mpi. (D) Representative images from a time-lapse movie showing an infected macrophage (green fluorescent) clearing red fluorescent PGL Mm (yellow arrowhead). Scale bar, 50μm. Time stamp, mpi. (See also Movies S1 and S2 and Tables S1 and S2.) (E) Quantification of bacterial transfer events from experiments represented by (C) and (D). Percentage of animals demonstrating a transfer event during the designated imaging time block. (F) Percentage of animals remaining infected over the first 5 days of infection with 1–3 wild-type, PGL, or PDIM Mm into the HBV of wild-type fish. Numbers of fish infected with each Mm strain: 30 wild-type, 28 PGL, and 28 PDIM. Results representative of two separate experiments. (G) Percentage of infected (black) or uninfected (gray) untreated, DMSO control, or QVD-OPH treated wild-type fish 5 dpi with 1-3 wild-type Mm into the HBV. n = number of larvae per group. Results representative of two separate experiments.
Figure 5
Figure 5
Resident Macrophages Are More Microbicidal than Monocytes (A) Percentage of infected (black) or uninfected (gray) wild-type or myeloid-deficient fish at 5 dpi after HBV infection with 1–3 wild-type or PGL Mm. n = number of larvae per group. (B) Percentage of iNOS-positive infected myeloid cells in the HBV or CV at 3 dpi with 80 wild-type, PDIM or PGL Mm. (C) Percentage of infected (black) or uninfected (gray) wild-type fish at 5 dpi after HBV infection with 1–3 PGL Mm. Control, CTRL; Reactive nitrogen species scavenger CPTIO. n = number of larvae per group. (D) Percentage of infected (black) or uninfected (gray) wild-type fish at 5 dpi with 1–3 wild-type or PGL Mm into the HBV or CV. n = number of larvae per group. (E) Percentage of infected (black) or uninfected (gray) wild-type or Ccr2-deficient fish at 5 dpi with 1–3 wild-type Mm in the HBV or CV. n = number of larvae per group. (F) Percentage of infected (black) or uninfected (gray) wild-type or Sting-deficient fish at 5 dpi with 1–3 wild-type Mm in the HBV or CV. n = number of larvae per group. (G) Mean bacterial volume at 1 and 4 dpi with a single wild-type Mm bacterium in the HBV or CV of wild-type fish. Results in (A)–(G) representative of three independent experiments. (B) and (G) significance testing done using one-way ANOVA, with Bonferroni’s post-test for comparisons shown. (A) and (C)–(F) significance testing done using Fisher’s exact test for the comparisons shown. p < 0.05, ∗∗p < 0.01, ∗∗∗p < 0.001.
Figure 6
Figure 6
PGL-Dependent CCL2 Protein Production following Mm Infection of Human Alveolar Macrophages (A and C) Fold increase (over uninfected cells) in CCL2 protein levels in the supernatant of primary human alveolar macrophages following a 60 min (A) or 30 min (C) infection with wild-type Mm or PGL-deficient Mm. (B and D) The same data as in (A) and (C) analyzed as fold increase in CCL2 of wild-type Mm over PGL- Mm at 60 min (B) and 30 min (D) post infection. Significance testing done using a one sample t test to a hypothetical value of 1, corresponding to the null hypothesis that PGL does not influence CCL2 production following infection. (See also Table S3.)

Comment in

References

    1. Aggad D., Mazel M., Boudinot P., Mogensen K.E., Hamming O.J., Hartmann R., Kotenko S., Herbomel P., Lutfalla G., Levraud J.P. The two groups of zebrafish virus-induced interferons signal via distinct receptors with specific and shared chains. J. Immunol. 2009;183:3924–3931. - PubMed
    1. Antonelli L.R.V., Gigliotti Rothfuchs A., Gonçalves R., Roffê E., Cheever A.W., Bafica A. Intranasal Poly-IC treatment exacerbates tuberculosis in mice through the pulmonary recruitment of a pathogen-permissive monocyte/macrophage population. Journal of Clinical Investigation. 2010;120(5):1674–1682. - PMC - PubMed
    1. Aston C., Rom W.N., Talbot A.T., Reibman J. Early inhibition of mycobacterial growth by human alveolar macrophages is not due to nitric oxide. Am. J. Respir. Crit. Care Med. 1998;157:1943–1950. - PubMed
    1. Athman J.J., Wang Y., McDonald D.J., Boom W.H., Harding C.V., Wearsch P.A. Bacterial Membrane Vesicles Mediate the Release of Mycobacterium tuberculosis Lipoglycans and Lipoproteins from Infected Macrophages. J. Immunol. 2015;195:1044–1053. - PMC - PubMed
    1. Bates J.H., Potts W.E., Lewis M. Epidemiology of Primary Tuberculosis in an Industrial School. N. Engl. J. Med. 1965;272:714–717. - PubMed

MeSH terms