. 2017:2017:7054272.
doi: 10.1155/2017/7054272. Epub 2017 Aug 6.

Elucidation of Molecular Mechanisms of Streptozotocin-Induced Oxidative Stress, Apoptosis, and Mitochondrial Dysfunction in Rin-5F Pancreatic β-Cells

Affiliations

Elucidation of Molecular Mechanisms of Streptozotocin-Induced Oxidative Stress, Apoptosis, and Mitochondrial Dysfunction in Rin-5F Pancreatic β-Cells

Arwa M T Al Nahdi et al. Oxid Med Cell Longev. 2017.

Abstract

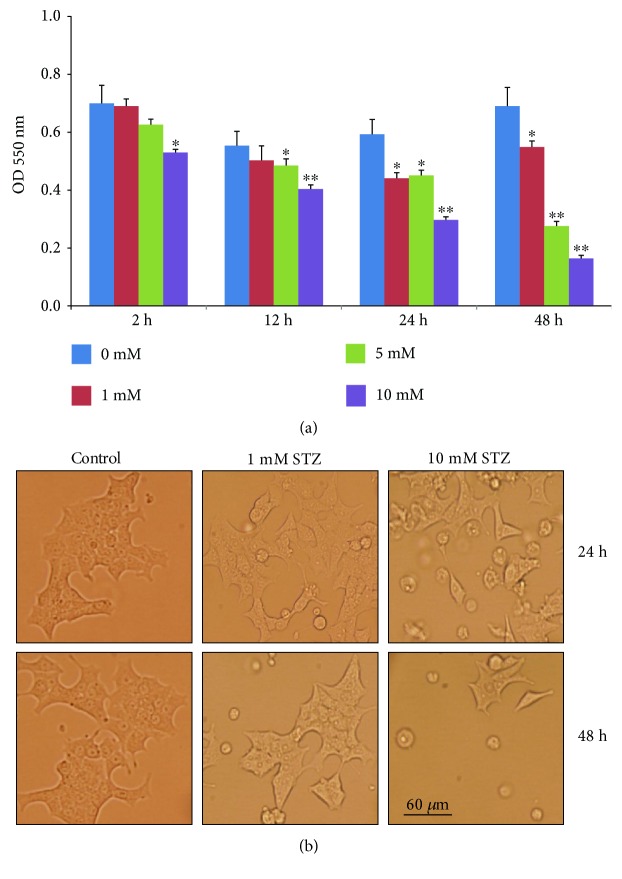
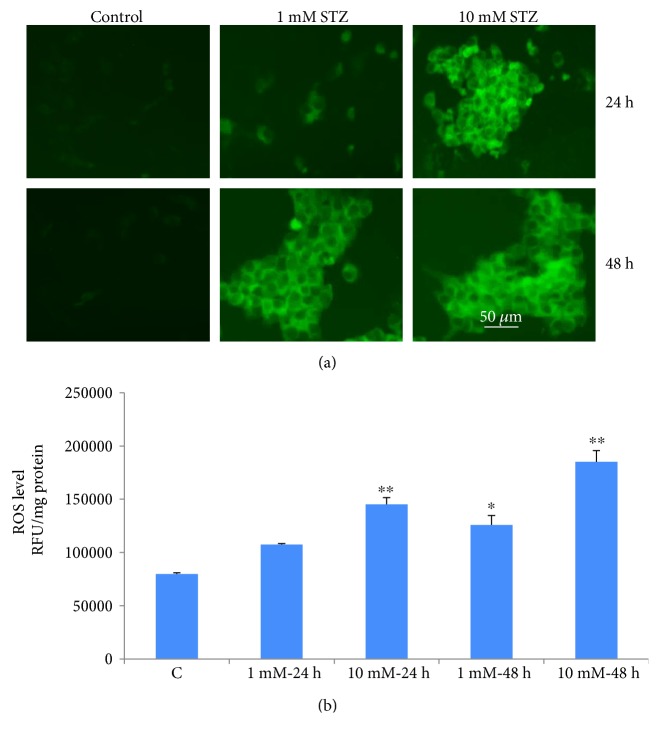
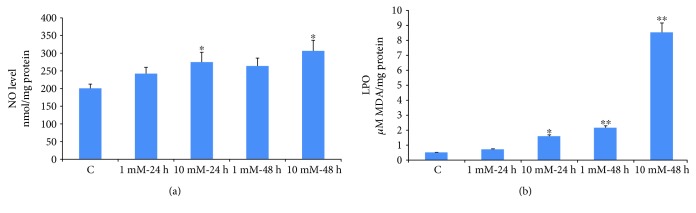
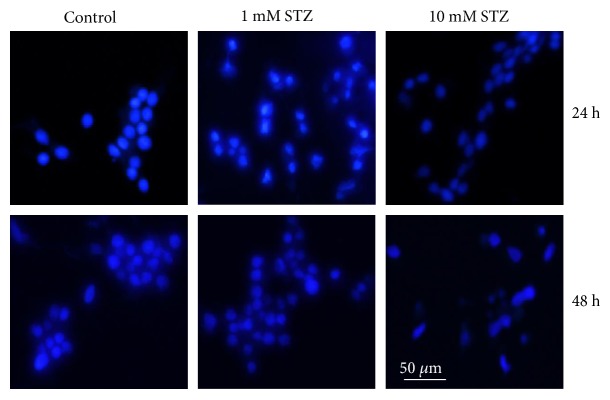
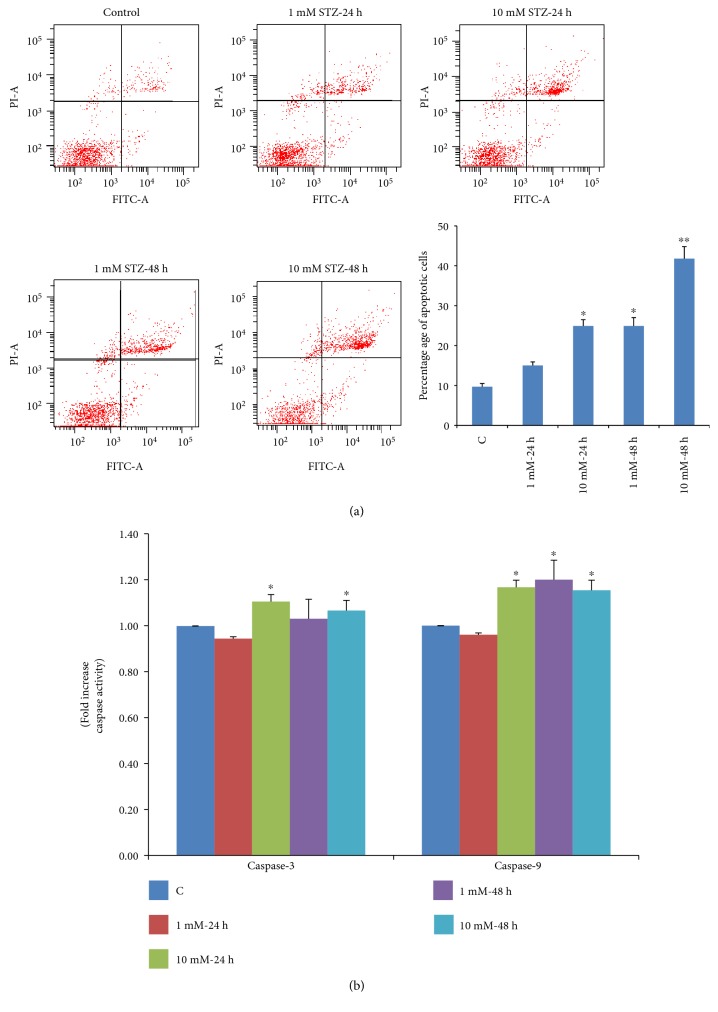
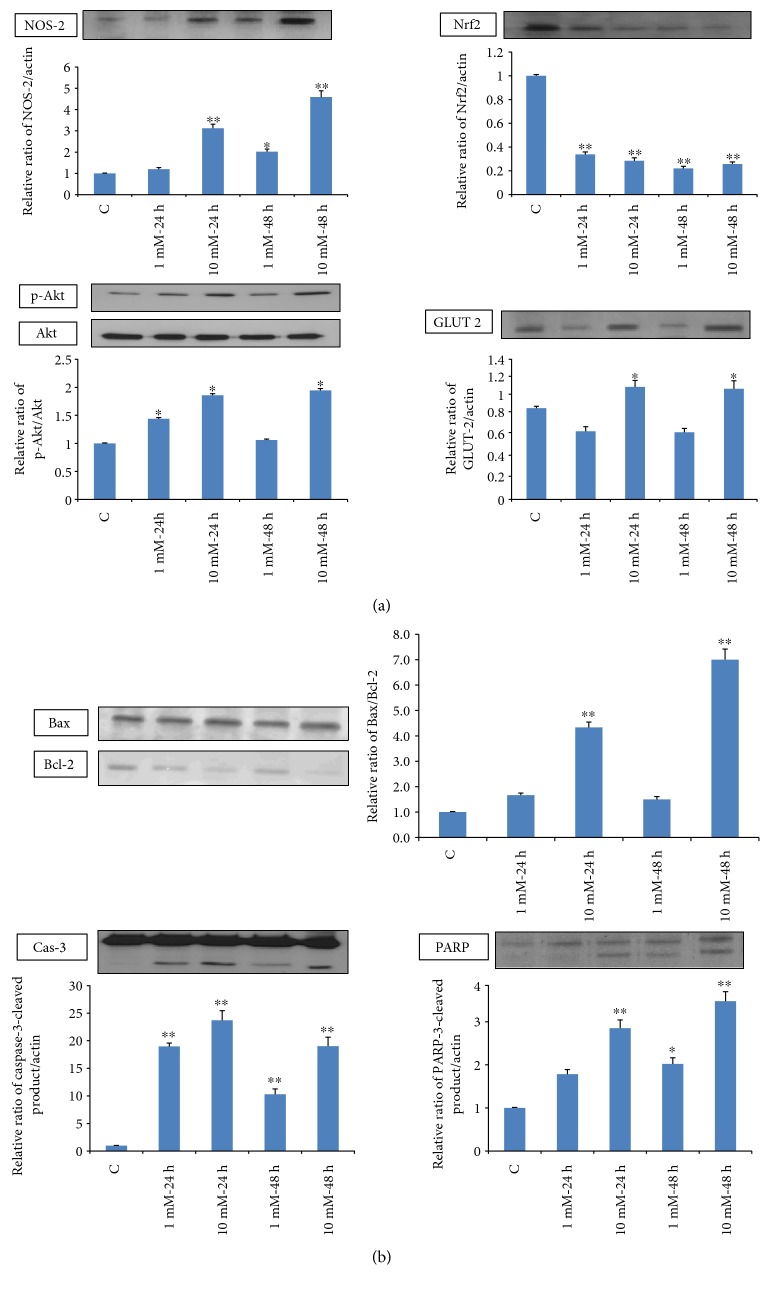
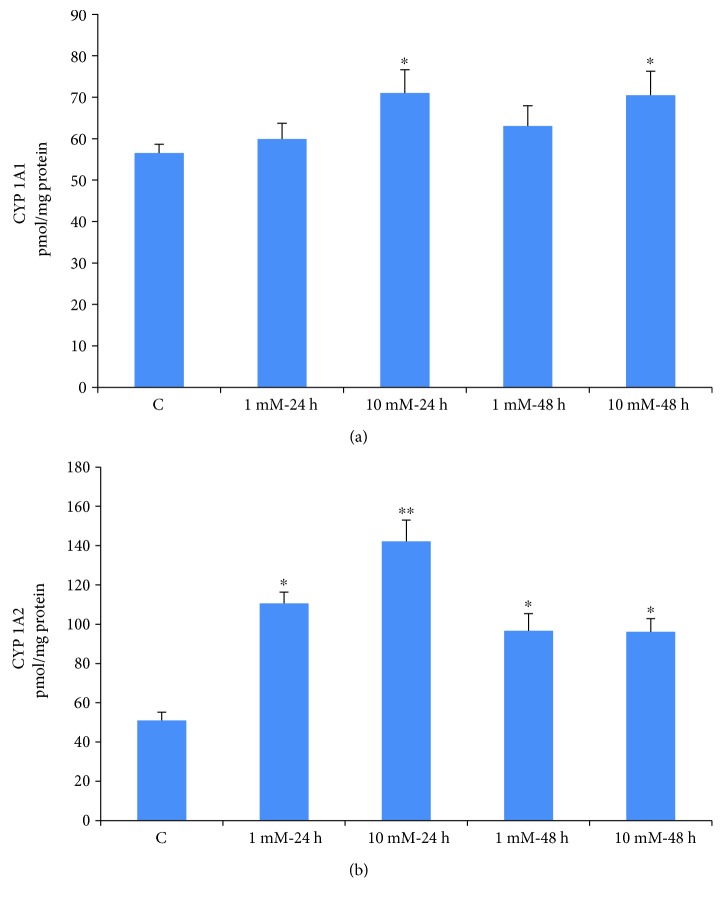
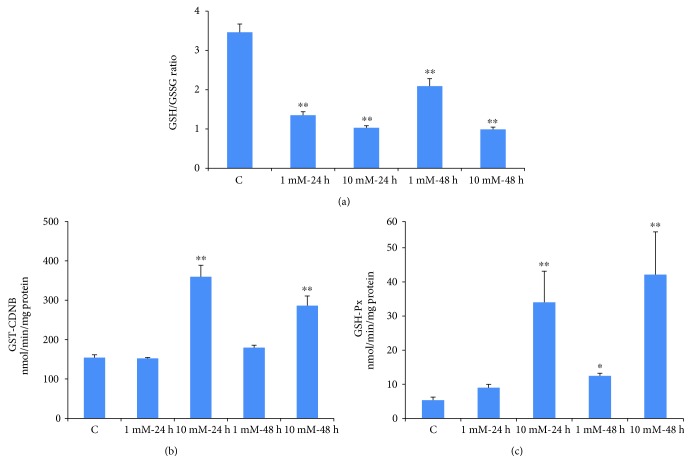
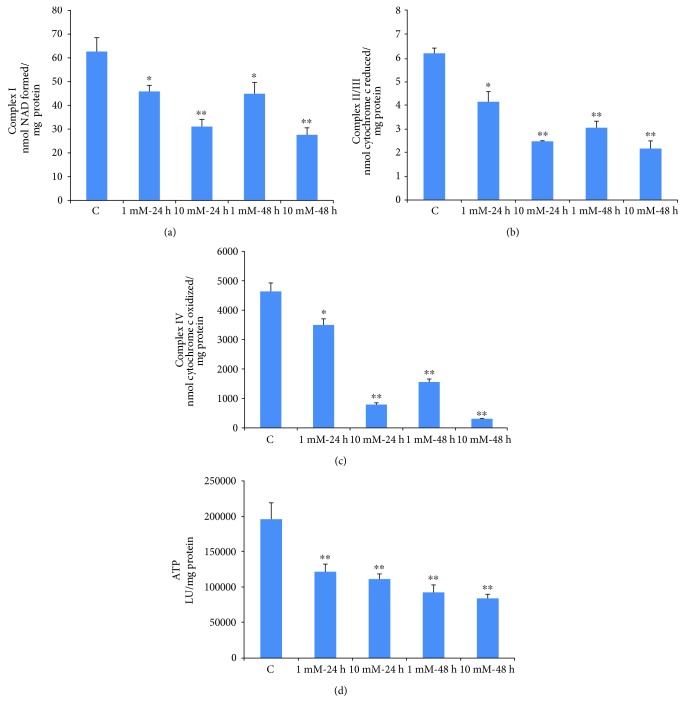
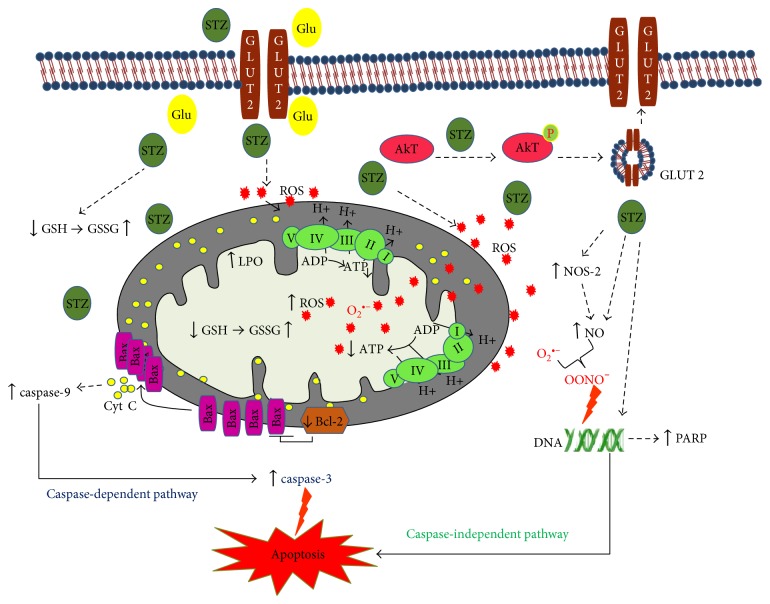
Streptozotocin is a pancreatic beta-cell-specific cytotoxin and is widely used to induce experimental type 1 diabetes in rodent models. The precise molecular mechanism of STZ cytotoxicity is however not clear. Studies have suggested that STZ is preferably absorbed by insulin-secreting β-cells and induces cytotoxicity by producing reactive oxygen species/reactive nitrogen species (ROS/RNS). In the present study, we have investigated the mechanism of cytotoxicity of STZ in insulin-secreting pancreatic cancer cells (Rin-5F) at different doses and time intervals. Cell viability, apoptosis, oxidative stress, and mitochondrial bioenergetics were studied. Our results showed that STZ induces alterations in glutathione homeostasis and inhibited the activities of the respiratory enzymes, resulting in inhibition of ATP synthesis. Apoptosis was observed in a dose- and time-dependent manner. Western blot analysis has also confirmed altered expression of oxidative stress markers (e.g., NOS and Nrf2), cell signaling kinases, apoptotic protein-like caspase-3, PARP, and mitochondrial specific proteins. These results suggest that STZ-induced cytotoxicity in pancreatic cells is mediated by an increase in oxidative stress, alterations in cellular metabolism, and mitochondrial dysfunction. This study may be significant in better understanding the mechanism of STZ-induced β-cell toxicity/resistance and the etiology of type 1 diabetes induction.


Figures

Figure 1
Figure 1
MTT cell viability assay and morphology of cells after STZ treatment. Rin-5F cells (~2 × 104) were grown in 96-well plates for 24 h and treated with different concentrations (0–10 mM) of STZ for different time intervals. The formazan crystals formed, following the reduction of MTT by metabolically active (viable) cells, were solubilized in acidified isopropanol and quantitated using the ELISA reader at 550 nm (a). Results are expressed as mean ± SEM for three experiments. Asterisks indicate significant difference (p ≤ 0.05, ∗∗p ≤ 0.005) relative to the untreated control cells. The morphological integrity of the STZ-treated and STZ-untreated control cells was also checked and photographed (20x) under a light microscope (b).
Figure 2
Figure 2
ROS production in STZ-induced cells. Intracellular production of reactive oxygen species was measured in control untreated and STZ-treated Rin-5F cells with different concentrations (0–10 mM) for different time intervals, using the cell permeable probe, DCFDA. Cells (~1 × 105 cells/mL) were grown on cover slips and incubated with 5 μM DCFDA for 30 min at 37°C. Cells were washed twice with PBS, and fluorescence was immediately visualized using an Olympus fluorescence microscope. Representative slides from untreated control and STZ-treated cells from three experiments are shown (a). Original magnification ×200. Production of reactive oxygen species was also measured fluorimetrically in control untreated and STZ-treated cells (b). Results are expressed as mean ± SEM of three experiments. Asterisks indicate significant difference (p ≤ 0.05, ∗∗p ≤ 0.005) relative to the untreated control cells.
Figure 3
Figure 3
NO production and lipid peroxidation in STZ-induced cells. NO production was determined by measuring the concentration of total nitrite in the culture supernatants (a) with Griess reagent (R&D Systems Inc.). Lipid peroxidation (LPO) in the control and STZ-treated cells was measured as total amount of malondialdehyde (b) as per the vendor's protocol (Oxis Research Inc.). Results are expressed as mean ± SEM of three experiments. Asterisks indicate significant difference (p ≤ 0.05, ∗∗p ≤ 0.005) relative to the untreated control cells.
Figure 4
Figure 4
STZ-induced DNA fragmentation. Staining of fragmented nuclei of STZ-treated and STZ-untreated cells was performed by using Hoechst33342 dye. Cover slips with adherent cells were treated with STZ, fixed with 3.7% formaldehyde, and stained with Hoechst33342 (10 μg/mL) for 20 min at room temperature. The cover slips were washed, mounted on glass slides, and analyzed by fluorescence microscopy. Cells with signs of apoptosis showed fragmented nuclei. Representative slides from three experiments are shown. Original magnification ×200.
Figure 5
Figure 5
STZ-induced apoptosis. Apoptosis was measured in Rin-5F cells treated with different doses of STZ at different time intervals by flow cytometry using FACSDiva software. Representative dot plots are shown, and percentage of apoptotic cells is represented as a histogram (a). Activity of caspases was measured in cells (b) treated with different doses of STZ at different time intervals colorimetrically using the respective substrates as described in the vendor's protocol (R&D Systems Inc.). Results are expressed as mean ± SEM of three experiments. Asterisks indicate significant difference (p ≤ 0.05, ∗∗p ≤ 0.001) relative to the untreated control cells.
Figure 6
Figure 6
Expression of apoptotic protein markers. Total extracts (30 μg protein) from control and Rin-5F cells treated with different doses of STZ at different time intervals were separated on 12% SDS-PAGE and transferred on to nitrocellulose paper by Western blotting. NOS-2 Nrf2, Akt, p-Akt, and GLUT 2 (a) and caspase-3, PARP, Bax, and Bcl-2 proteins (b) were detected using specific antibodies against these proteins. Beta-actin was used as a loading control. The quantitation of proteins bands is expressed as relative ratios normalized against actin or other proteins as appropriate. The figures are representative of three experiments. Asterisks indicate significant difference (p < 0.05, ∗∗p < 0.005) relative to the untreated control cells.
Figure 7
Figure 7
STZ-induced alterations in CYP activities. CYP 1A1 and CYP 1A2 activities were measured in Rin-5F cells treated with different doses of STZ at different time intervals using the respective substrates as described in the Materials and Methods. Results are expressed as mean ± SEM of three experiments. Asterisks indicate significant difference (p ≤ 0.05, ∗∗p ≤ 0.001) relative to the untreated control cells.
Figure 8
Figure 8
STZ-induced alterations in GSH metabolism. Rin-5F cells were treated with different doses of STZ for different time intervals. GSH/GSSG ratio (a), GST (b), and GSH-Px (c) were measured. Results are expressed as mean ± SEM of three experiments. Asterisks indicate significant difference (p ≤ 0.05, ∗∗p ≤ 0.005) relative to the untreated control cells.
Figure 9
Figure 9
STZ-induced alterations in mitochondrial enzyme activity. Rin-5F cells were treated with different doses of STZ for different time intervals. Respiratory complex I (a) complex II/II (b), and complex IV (c) were measured using their respective substrates as described in the Materials and Methods. ATP content (d) was measured using the ATP bioluminescent somatic cell assay kit. Results are expressed as mean ± SEM of three experiments. Asterisks indicate significant difference (p ≤ 0.05, ∗∗p ≤ 0.001) relative to the untreated control cells.
Figure 10
Figure 10
Schematic model depicting the mechanism of STZ-induced cytotoxicity in Rin-5F cells. STZ competes with glucose (Glu) to enter the cells via GLUT 2 receptors, causing Akt phosphorylation, which, in turn, causes further translocation of the GLUT 2 receptors. The model also shows that STZ induces cytotoxicity and apoptosis by increased ROS/NOS production, oxidative/nitrosative stress, increased LPO, DNA damage, a decreased GSH/GSSG ratio, and mitochondrial dysfunction. Upward arrows (↑) indicate increase and downward arrows (↓) indicate decrease.

References

    1. Lewis C., Barbiers A. R. Streptozotocin, a new antibiotic. In vitro and in vivo evaluation. Antibiotics Annual. 1959;7:247–254. - PubMed
    1. Weiss R. B. Streptozocin: a review of its pharmacology, efficacy, and toxicity. Cancer Treatment Reports. 1982;66:427–438. - PubMed
    1. Eileen Dolan M. Inhibition of DNA repair as a means of increasing the antitumor activity of DNA reactive agents. Advanced Drug Delivery Reviews. 1997;26:105–118. doi: 10.1016/S0169-409X(97)00028-8. - DOI - PubMed
    1. Capucci M. S., Hoffmann M. E., Natarajan A. T. Streptozotocin-induced genotoxic effects in Chinese hamster cells: the resistant phenotype of V79 cells. Mutation Research. 1995;347:79–85. doi: 10.1016/0165-7992(95)90074-8. - DOI - PubMed
    1. Islam M. S., Loots D. T. Experimental rodent models of type 2 diabetes: a review. Methods and Findings in Experimental and Clinical Pharmacology. 2009;31:249–261. doi: 10.1358/mf.2009.31.4.1362513. - DOI - PubMed

MeSH terms

LinkOut - more resources