. 2017 Oct 2;127(10):3598-3608.
doi: 10.1172/JCI92171. Epub 2017 Aug 28.

Dysfunction of the MDM2/p53 axis is linked to premature aging

Affiliations

Dysfunction of the MDM2/p53 axis is linked to premature aging

Davor Lessel et al. J Clin Invest. .

Abstract

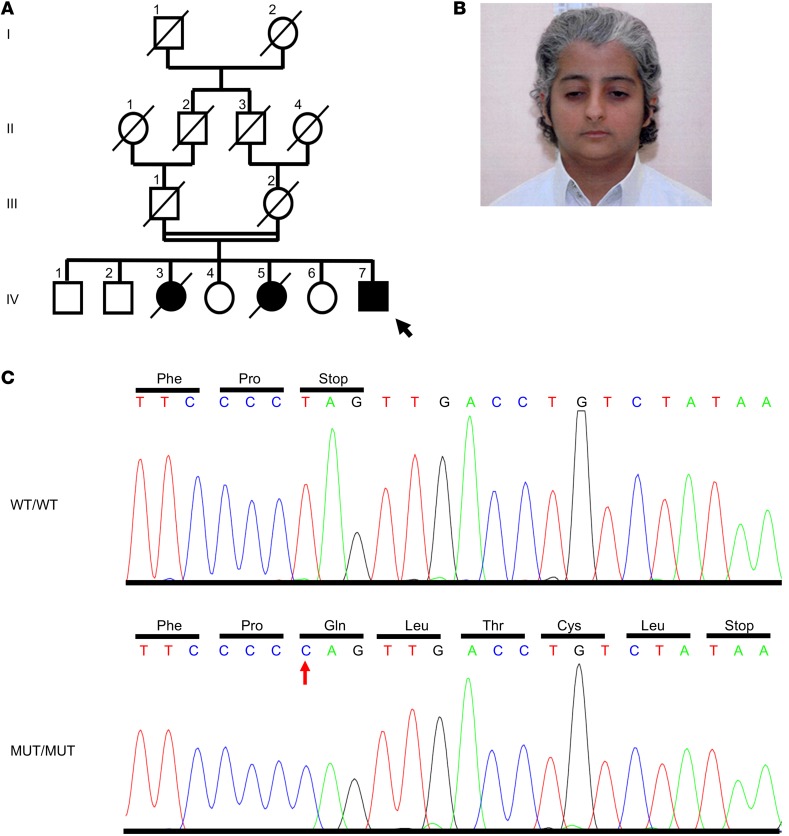
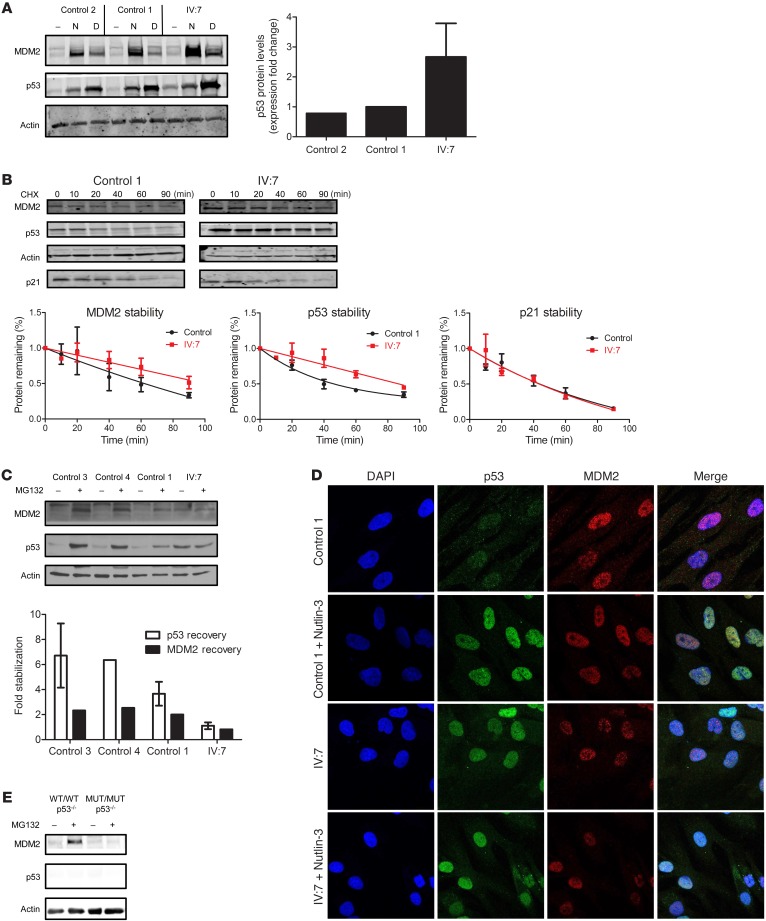
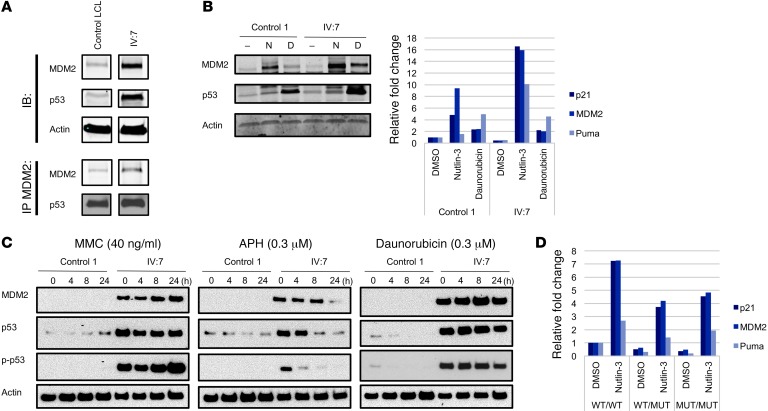
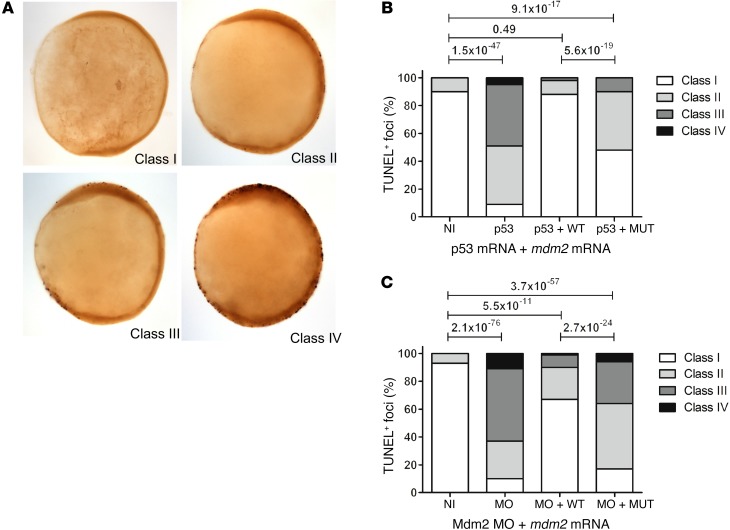
The tumor suppressor p53, a master regulator of the cellular response to stress, is tightly regulated by the E3 ubiquitin ligase MDM2 via an autoregulatory feedback loop. In addition to its well-established role in tumorigenesis, p53 has also been associated with aging in mice. Several mouse models with aberrantly increased p53 activity display signs of premature aging. However, the relationship between dysfunction of the MDM2/p53 axis and human aging remains elusive. Here, we have identified an antiterminating homozygous germline mutation in MDM2 in a patient affected by a segmental progeroid syndrome. We show that this mutation abrogates MDM2 activity, thereby resulting in enhanced levels and stability of p53. Analysis of the patient's primary cells, genome-edited cells, and in vitro and in vivo analyses confirmed the MDM2 mutation's aberrant regulation of p53 activity. Functional data from a zebrafish model further demonstrated that mutant Mdm2 was unable to rescue a p53-induced apoptotic phenotype. Altogether, our findings indicate that mutant MDM2 is a likely driver of the observed segmental form of progeria.


Conflict of interest statement

Conflict of interest: P. Nürnberg is a founder, CEO, and shareholder of ATLAS Biolabs GmbH.

Figures

Figure 1
Figure 1. Identification of a causative mutation in MDM2.
(A) Pedigree of a consanguineous family (black and white circles and squares denote affected and healthy individuals, respectively; arrow indicates the index patient; diagonal lines indicate deceased status; double line shows parental consanguinity). (B) Facial image of the index patient IV:7 at the age of 19 years. Note the patient’s short stature (151 cm on the scale), prematurely gray hair, pinched facial features with a narrow nasal bridge, and small mouth. (C) Sequence chromatogram shows the c.1492T>C (p.*498Qext5) mutation (red arrow).
Figure 2
Figure 2. The antiterminating MDM2 mutation is defective in its regulation of p53.
(A) Protein levels of MDM2, p53, and actin in control and IV:7 fibroblasts treated with vehicle DMSO (–), Nutlin-3 (N, 10 μM), or daunorubicin (D, 0.1 mg/ml) for 24 hours. Immunoblot with the indicated antibodies. Graph shows the fold change of basal p53 levels over actin levels from 5 independent experiments. (B) Protein degradation rates of MDM2 and p53 in fibroblasts via CHX chase. Immunoblots show results of control 1 and IV:7 fibroblasts harvested at the indicated times (minutes) after CHX (100 μg/ml) treatment. Graphs show protein quantification normalized to actin (using ImageJ and GraphPad Prism software) and the half-lives of MDM2 (control 1: 62 min; IV:7: 92 min) and p53 (control 1: 45 min; IV:7: 82 min). (C) Effects of proteasome inhibition on MDM2 and p53 levels. Immunoblot of control fibroblasts (controls 3, 4, and 1) and IV:7 fibroblasts treated with vehicle (DMSO) or MG132 (25 μM) for 6 hours. Graph shows protein quantification (using ImageJ) and normalization to actin. Fold recovery was calculated by comparing p53 or MDM2 values from treated cells with those of untreated cells. (D) Subcellular localization of MDM2 and p53 in control 1 and IV:7 fibroblasts treated with vehicle (DMSO) or Nutlin-3 (10 μM) for 24 hours. Original magnification, ×63. (E) U2OS genome-edited cells expressing WT/WT and MUT/MUT MDM2 with no p53 were treated with vehicle (DMSO) or the proteasome inhibitor MG132 (25 μM) for 6 hours before harvesting and immunoblotting. In A and B, error bars represent mean ± standard deviation. In C, error bars represent mean ± SEM.
Figure 3
Figure 3. The antiterminating mutation results in abnormal p53 functional responses.
(A) MDM2 and p53 could be coimmunoprecipitated. Proteins were harvested from control and IV:7 LCLs and detected after coimmunoprecipitation with anti-MDM2 antibody (H-221) and subsequent immunoblotting. All samples were run on the same gel but were noncontiguous. (B) Control 1 and IV:7 fibroblasts were treated for 24 hours with DMSO, Nutlin-3 and daunorubicin. Cells were harvested and used for protein or mRNA analysis. Cells were lysed and used for immunoblotting with the indicated antibodies. Quantitative reverse transcription PCR (qRT-PCR) analysis revealed relative mRNA levels of p53 target genes after treatment. Bar graph is representative of 3 independent experiments and shows no statistical significance. (C) Time course of p-p53, p53, and MDM2 protein levels after treatment with MMC, APH, and daunorubicin. Protein levels of p-p53 (Ser15), p53, and MDM2 in fibroblasts treated with MMC (40 ng/ml), APH (0.3 μM), or daunorubicin (0.1 μM). Fibroblasts from control 1 (lanes 1–4) and IV:7 (lanes 5–8) were treated for 24 hours with the indicated stressors. Cells were harvested either right after treatment (lanes 1 and 5), or were further cultured for 4 (lanes 2 and 6), 8 (lanes 3 and 7), or 24 hours (lanes 4 and 8) in stress-free medium. Cell lysates were used for immunoblotting with p-p53 (Ser15); p53 (AF1355); MDM2 (N20); and anti-actin. (D) qRT-PCR analysis showing relative mRNA levels of p53 target genes after treatment with DMSO or Nutlin-3 for 24 hours in WT/WT, WT/MUT, and MUT/MUT U2OS genome-edited cells. Bar graph is representative of 3 independent experiments and shows no statistical significance for Nutlin-3–treated p21 WT/MUT and MUT/MUT cell lines as compared with WT/WT cell lines.
Figure 4
Figure 4. Functional consequences of the identified mutation in the patient’s cells.
(A) CBMN assays in LCLs. Effect of γ-irradiation (1 and 2 Gy) on the induction of micronuclei (MN) in control and IV:7 (left y axis) LCLs and on cell viability in the presence of CytB, indicated by the NDI (right y axis). Data represent 3 independent experiments. P = 0.2; 1 Gy: P = 0.0006; 2 Gy: P = 0.0001 (2-tailed Student’s t test). NT, nontreated cells. (B) Chromosomal stability in LCLs. Graph shows the mean number of aberrations per cell observed in 100 metaphases of an unaffected individual (Control LCLs) and the index patient (IV:7 LCLs). LCLs were left untreated or treated with 80 ng/ml MMC for 48 hours. Data represent 2 independent experiments. P values are relative to control LCLs for each treatment. #P = 0.0002 (2-sample Poisson tests). (C) Senescence phenotype of IV:7 fibroblasts. Control 1 and IV:7 fibroblasts at passage 28 (P28) were stained for β-gal. Original magnification ×20. (D) Protein levels of LMNB1 and actin in primary fibroblasts from an unaffected individual (Control 1) and the index patient IV:7 at passages 18 (both), 31 (control 1), and 27 (index patient).
Figure 5
Figure 5. Impaired function of the antiterminating Mdm2 mutation in a zebrafish model.
Complementation assay in 10 hpf zebrafish embryos (tailbud stage). (A) Representative images of the lateral view of 10 hpf zebrafish embryos stained with TUNEL. Embryos were classified by the number of TUNEL-positive foci as follows: class I (0–10); class II (10–20); class III (20–40); and class IV (>40). (B and C) Percentage of TUNEL-positive foci of various apoptosis classes of embryos injected with 3 ng Mdm2 morpholino and coinjections of 40 pg mdm2 mRNAs and of embryos injected with p53 RNA and coinjections of 40 pg mdm2 mRNAs (right panel). NI, noninjected embryos; MO, embryos injected with Mdm2 morpholino; p53, embryos injected with p53 mRNA; + WT, coinjection of mdm2-WT; + MUT, coinjection of mdm2 bearing the antiterminating mutation. Data represent 3 independent experiments (2-sample Poisson tests).

Similar articles

Cited by

References

    1. Malkin D, et al. Germ line p53 mutations in a familial syndrome of breast cancer, sarcomas, and other neoplasms. Science. 1990;250(4985):1233–1238. doi: 10.1126/science.1978757. - DOI - PubMed
    1. Vogelstein B, Lane D, Levine AJ. Surfing the p53 network. Nature. 2000;408(6810):307–310. doi: 10.1038/35042675. - DOI - PubMed
    1. Vousden KH, Prives C. Blinded by the light: the growing complexity of p53. Cell. 2009;137(3):413–431. doi: 10.1016/j.cell.2009.04.037. - DOI - PubMed
    1. Krizhanovsky V, Lowe SW. Stem cells: The promises and perils of p53. Nature. 2009;460(7259):1085–1086. doi: 10.1038/4601085a. - DOI - PMC - PubMed
    1. Lee JT, Gu W. The multiple levels of regulation by p53 ubiquitination. Cell Death Differ. 2010;17(1):86–92. doi: 10.1038/cdd.2009.77. - DOI - PMC - PubMed

MeSH terms