

doi: 10.1038/nmeth.4396.
Epub 2017 Aug 28.
An improved ATAC-seq protocol reduces background and enables interrogation of frozen tissues
Affiliations
- PMID: 28846090
- PMCID: PMC5623106
- DOI: 10.1038/nmeth.4396
Item in Clipboard
An improved ATAC-seq protocol reduces background and enables interrogation of frozen tissues
Nat Methods.
2017 Oct.
Abstract
We present Omni-ATAC, an improved ATAC-seq protocol for chromatin accessibility profiling that works across multiple applications with substantial improvement of signal-to-background ratio and information content. The Omni-ATAC protocol generates chromatin accessibility profiles from archival frozen tissue samples and 50-μm sections, revealing the activities of disease-associated DNA elements in distinct human brain structures. The Omni-ATAC protocol enables the interrogation of personal regulomes in tissue context and translational studies.
Conflict of interest statement
The authors declare competing financial interests: details are available in the online version of the paper.
Figures
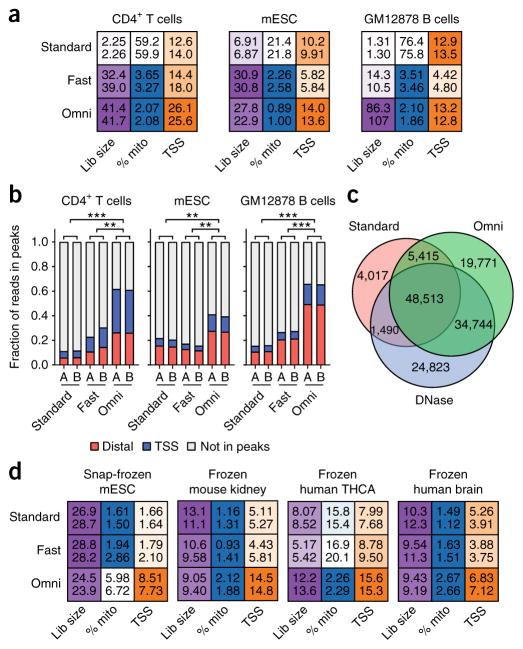
Comparison of the Omni-ATAC protocol to standard ATAC-seq or Fast-ATAC.
(a) Heat-map-based representation of ATAC-seq quality control
metrics, including estimated library size (“Lib size”; purple),
percentage of reads mapping to mitochondrial DNA (“%
mito”; blue), and enrichment of signal at TSSs (orange) (Online
Methods). Deeper color is used to depict the most desirable value of each
statistic and ranges following a linear scale starting at 0 (white) and ending
at the maximum value for the given cell type. In the case of the percentage of
reads that map to mitochondrial DNA (% mito), the color scale starts at
the maximum value (white) and ends at 5% (blue). All values were
determined from 5 million random aligned reads. Two technical replicates are
shown per sample as numeric values within each box. (b) Fraction of
reads in peaks that map to TSSs (±500 bp of TSS) and distal elements
(>500 bp from TSS) from libraries generated in this study, using the standard
ATAC-seq method (“Standard”), the Fast-ATAC-seq method
(“Fast”), or the Omni-ATAC protocol (“Omni”).
Each bar represents a single technical replicate.
**P < 0.01;
***P < 0.001 by two-tailed
unpaired Student’s t-test comparing the fraction of
reads in peaks to reads outside of peaks. All values were determined from 5
million random aligned de-duplicated reads. mESC, mouse embryonic stem cell.
(c) Overlap of GM12878 peaks called from 60 million reads using
standard ATAC-seq, DNase-seq, and Omni-ATAC. All input reads were trimmed to
equal lengths (36 bp) before alignment. Data represent the mean of three
individual downsampling replicates. (d) Heat-map-based
representation of ATAC-seq quality control metrics, including estimated library
size, percentage of reads mapping to mitochondrial DNA, and enrichment of signal
at TSSs, as shown in a. Deeper color is used to depict the most
desirable value of each statistic. All values were determined from 5 million
random aligned reads. Two technical replicates are shown per sample.
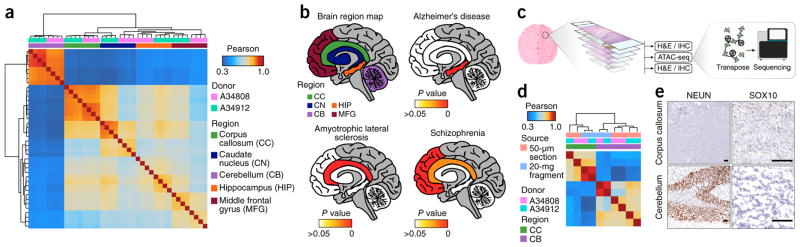
Omni-ATAC in defined regions of the post-mortem human brain. (a)
Pearson correlation heat map showing sample-by-sample unsupervised clustering on
all peaks identified across all regions. Biological donor and brain region are
indicated by the color across the top. CC, corpus callosum; CN, caudate nucleus;
CB, cerebellum; HIP, hippocampus; MFG, middle frontal gyrus. All regions are
represented by four technical replicates per donor. (b)
Significance of enrichment of disease-specific GWAS polymorphisms in the
uniquely accessible regions of five different brain regions (shown in the top
left image) from individuals with the indicated diseases. The empirical
P value is depicted colorimetrically with reference to
association-based permutations of the GWAS SNPs. Nonsignificant empirical
P values are represented in white. (c)
Schematic of the experimental strategy for the generation of chromatin
accessibility profiles from 50-μm frozen tissue sections with adjacent
relevant histological staining. (d) Pearson correlation heat map
showing sample-by-sample unsupervised clustering on all peaks. Data derived from
the 20-mg tissue fragments represent the mean of four technical replicates from
a single biological donor. Data derived from the 50-μm tissue sections
show individual technical replicates. (e) Representative images
(n = 3) showing histology and anti-NEUN (left) or
anti-SOX10 (right) staining of 5-μm frozen sections from the corpus
callosum (top) and cerebellum (bottom) immediately adjacent to the 50-μm
section used for ATAC-seq shown in Supplementary Figure 8. Scale bars,
100 μm. SOX10 staining is shown at a higher resolution due to a more
diffuse staining pattern.
References
-
- Roadmap Epigenetics Consortium. et al. Nature. 2015;518:317–330.
MeSH terms
Substances
Grants and funding
LinkOut - more resources
Full Text Sources
Other Literature Sources
Molecular Biology Databases
