. 2017 Sep;19(9):1037-1048.
doi: 10.1038/ncb3598. Epub 2017 Aug 28.

ZSCAN10 expression corrects the genomic instability of iPSCs from aged donors

Affiliations

ZSCAN10 expression corrects the genomic instability of iPSCs from aged donors

Maria Skamagki et al. Nat Cell Biol. 2017 Sep.

Erratum in

Abstract

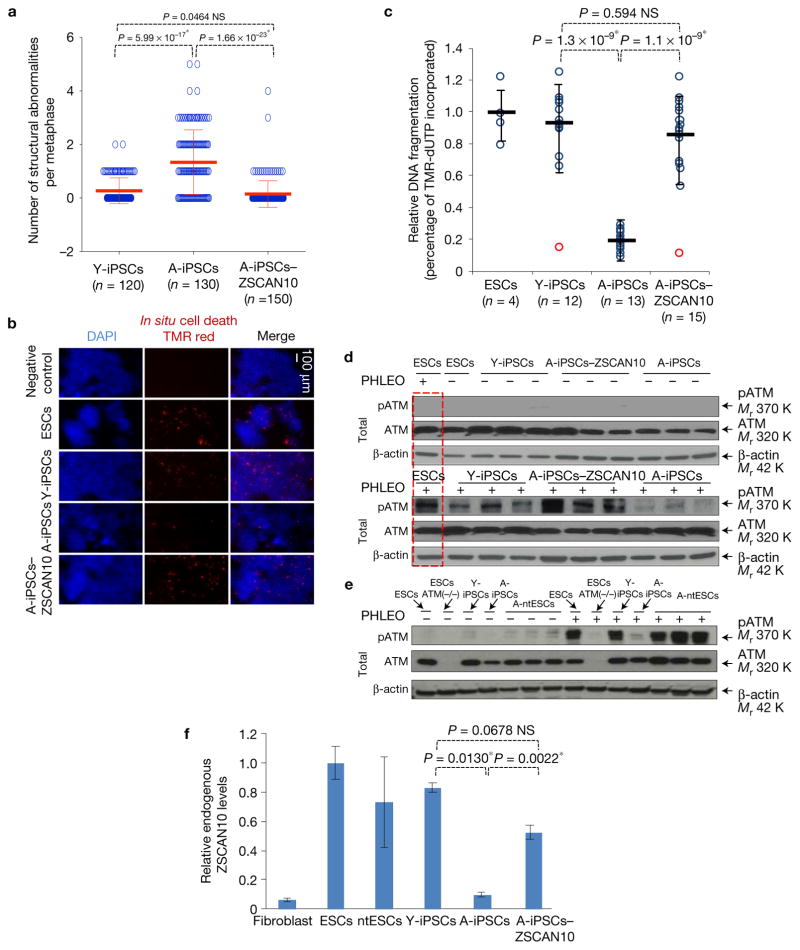
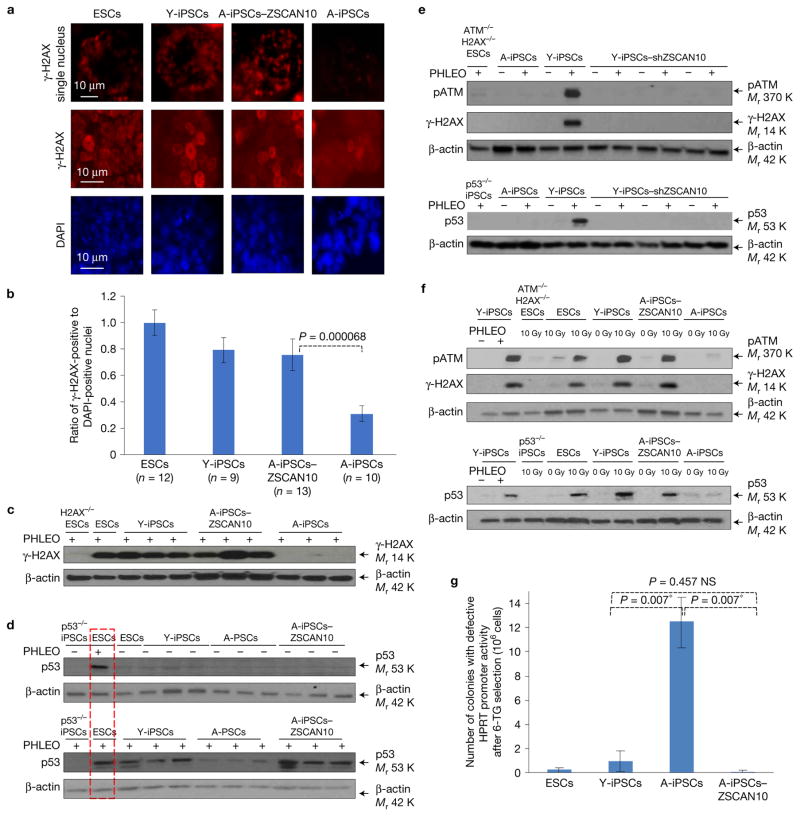
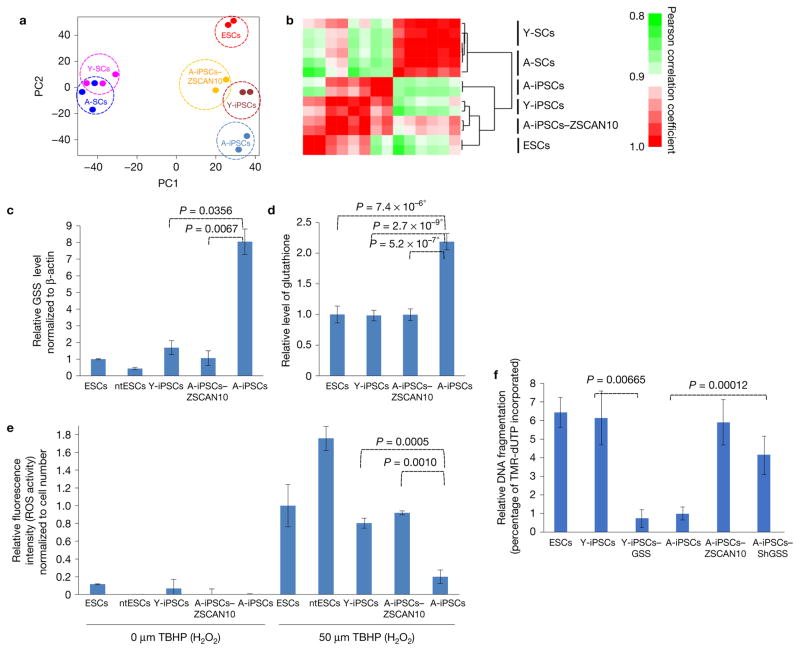
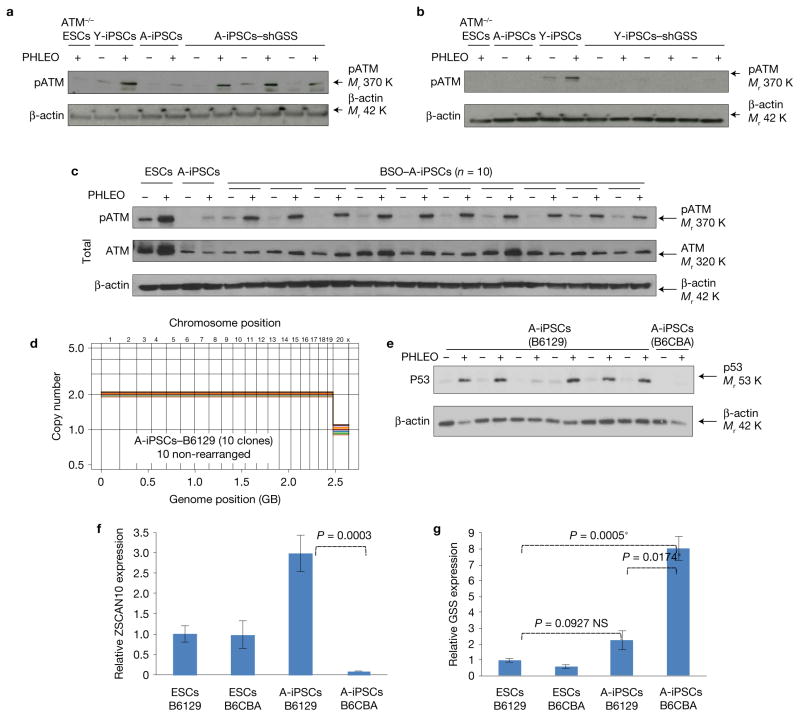
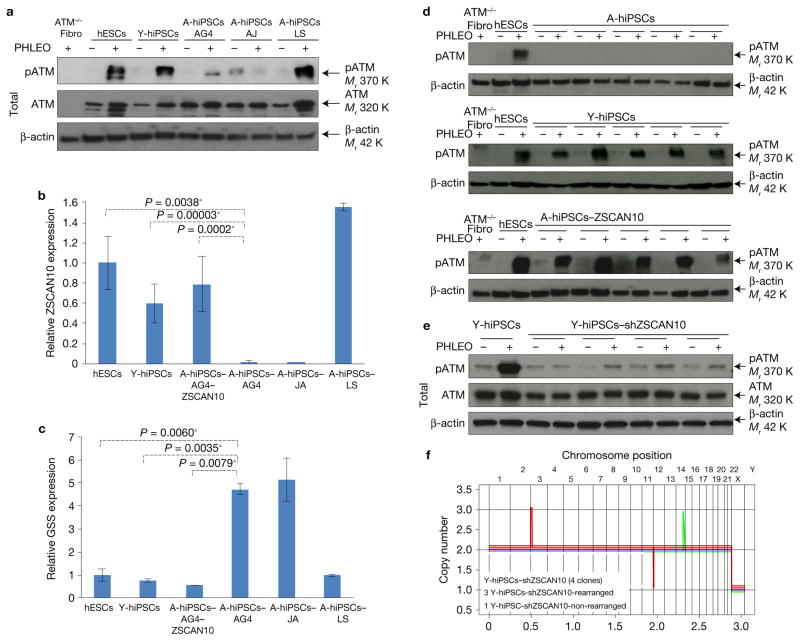
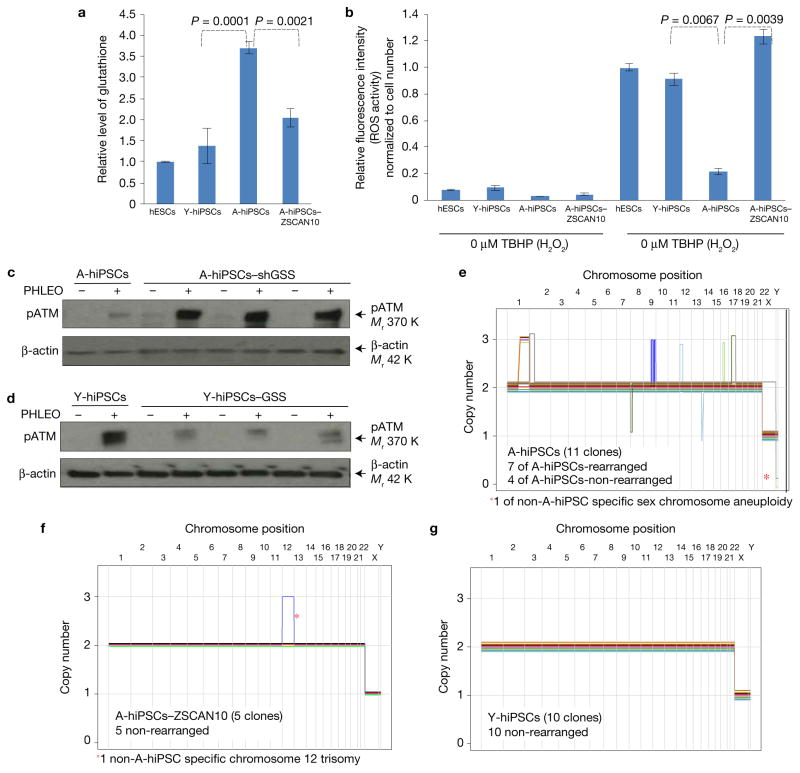
Induced pluripotent stem cells (iPSCs), which are used to produce transplantable tissues, may particularly benefit older patients, who are more likely to suffer from degenerative diseases. However, iPSCs generated from aged donors (A-iPSCs) exhibit higher genomic instability, defects in apoptosis and a blunted DNA damage response compared with iPSCs generated from younger donors. We demonstrated that A-iPSCs exhibit excessive glutathione-mediated reactive oxygen species (ROS) scavenging activity, which blocks the DNA damage response and apoptosis and permits survival of cells with genomic instability. We found that the pluripotency factor ZSCAN10 is poorly expressed in A-iPSCs and addition of ZSCAN10 to the four Yamanaka factors (OCT4, SOX2, KLF4 and c-MYC) during A-iPSC reprogramming normalizes ROS-glutathione homeostasis and the DNA damage response, and recovers genomic stability. Correcting the genomic instability of A-iPSCs will ultimately enhance our ability to produce histocompatible functional tissues from older patients' own cells that are safe for transplantation.


Conflict of interest statement

COMPETING FINANCIAL INTERESTS

The authors declare no competing financial interests.

Figures

Figure 1
Figure 1
Impaired genomic integrity and DNA damage response of mouse A-iPSCs compared with Y-iPSCs and ESCs, and recovery following transient expression of ZSCAN10. (a) Structural abnormalities observed by cytogenetic analysis in each A-iPSC clone, and recovery with ZSCAN10 expression. The error bars indicate s.e.m. of independent clones analysed per group. Numbers n represent individual metaphases, values are provided in the figure and source data are in Supplementary Table 5. Statistical significance by two-sided t-test followed by post hoc Holm–Bonferroni correction for a significance level of 0.05, * indicates significant and NS not significant. (b) In situ cell death assays of ESCs, Y-iPSCs, A-iPSCs and A-iPSCs–ZSCAN10 were carried out 15 h after phleomycin treatment (PHLEO; 2 h, 30 μg ml−1). A-iPSCs show less staining for cell death. The negative control is Y-iPSCs treated with dye in the absence of enzymatic reaction. The scale bar indicates 100 μm. DAPI, 4,6-diamidino-2-phenylindole. (c) Quantification by image analysis of apoptotic response by DNA fragmentation assay. The error bars indicate s.e.m. of technical and biological replicates. The number of biological replicates is indicated below each group in the figure. Statistical significance by two-sided t-test followed by post hoc Holm–Bonferroni correction for a significance level of 0.05; * indicates significant and NS not significant (Supplementary Table 5). (d) Reduced pATM in A-iPSCs as monitored by immunoblot after phleomycin treatment (2 h, 30 μg ml−1), and recovery of ATM activation following ZSCAN10 expression. The red box indicates the same ESC sample loaded in both immunoblots as an internal control. (e) pATM immunoblot illustrating the differential DNA damage response of A-ntESCs and A-iPSCs generated from an aged tissue donor. Three independent clones of A-ntESCs show a normal DNA damage response after phleomycin treatment. (f) qPCR of ZSCAN10 mRNA levels showing poor activation of ZSCAN10 expression in A-iPSCs and complete activation with transient expression of ZSCAN10. Endogenous ZSCAN10 levels normalized to β-actin. Error bars indicate s.e.m. of two replicates with three independent clones in each sample group (n = 6). Statistical significance by two-sided t-test followed by post hoc Holm–Bonferroni correction for a significance level of 0.05; * indicates significant and NS not significant. Unprocessed original scans of blots are shown in Supplementary Fig. 7.
Figure 2
Figure 2
Evaluation of ZSCAN10 function in DNA damage response and genomic stability of mouse A-iPSCs compared with Y-iPSCs and ESCs. (a) Immunohistochemistry showing low γ-H2AX (phosphorylated H2AX) in A-iPSCs after phleomycin treatment (2 h, 30 μg ml−1) and recovery of γ-H2AX signal with ZSCAN10 expression. (b) Ratio of γ-H2AX-positive cells to DAPI-stained nuclei quantified by immunostaining. Only cells showing punctate γ-H2AX foci were counted. Numbers n represent independent colonies and values are provided in the figure. The error bars indicate s.e.m. of independent colonies. Statistical significance was determined by unpaired two-sided t-test (Supplementary Table 5). (c) Immunoblot analysis of γ-H2AX confirms the immunohistochemistry findings. (d) Immunoblot showing impaired p53 DNA damage response in A-iPSCs and recovery with transient expression of ZSCAN10 in three independent clones after phleomycin treatment (2 h, 30 μg ml−1). The red box indicates the same ESC sample loaded in both immunoblots as an internal control. (e) Immunoblot showing impaired ATM/H2AX/p53 DNA damage response in Y-iPSCs with ZSCAN10 shRNA expression in three independent clones after phleomycin treatment (2 h, 30 μg ml−1). (f) ATM/H2AX/p53-mediated DNA damage response after irradiation. ESCs and Y-iPSCs, but not A-iPSCs, show an increase in pATM/γ-H2AX/p53 level after irradiation (10 Gy). The ATM/H2AX/p53 response to irradiation in A-iPSCs is recovered by transient expression of ZSCAN10. (g) Estimation of higher mutation rate in A-iPSCs, and recovery with ZSCAN10 expression. The mutation frequency was estimated by the inactivation of HPRT promoter activity in the presence of 6-thioguanine (6-TG)-mediated negative selection, and confirmed by qPCR. The error bars indicate s.e.m. of three independent clones in each sample group (n= 3). Statistical significance was determined by two-sided t-test followed by post hoc Holm–Bonferroni correction for a significance level of 0.05; * indicates significant and NS not significant. Unprocessed original scans of blots are shown in Supplementary Fig. 7.
Figure 3
Figure 3
Imbalance of ROS–glutathione homeostasis in mouse A-iPSCs, and recovery by ZSCAN10 expression via reduction of GSS. (a,b) Whole-genome expression profiles of aged and young fibroblast cells (A-SCs and Y-SCs) and pluripotent cell lines (ESCs, Y-iPSCs, A-iPSC and A-iPSCs–ZSCAN10) with independent clones for each line as biological repeats (n ≥ 2). (a) Principal component (PC) analysis using whole-genome expression profiles. (b) Heatmap showing hierarchical clustering of samples and pairwise gene expression similarities measured using Pearson correlation coefficient. (c) qPCR of GSS mRNA levels, indicating excessive expression in A-iPSCs and downregulation with ZSCAN10 expression. The error bars indicate s.e.m. of two replicates with three independent clones in each group (n = 6). Statistical significance by two-sided t-test followed by post hoc Holm–Bonferroni correction for a significance level of 0.05 (Supplementary Table 5). (d) High levels of glutathione in A-iPSCs, and recovery by ZSCAN10 expression. Mean ± s.d. is plotted for four biological replicates with two independent clones in each group (n = 8). Statistical significance was determined by two-sided t-test; * indicates significant. (e) ROS scavenging activity. A-iPSCs show strong H2O2 scavenging activity, with reduced response against treatment with tert-butyl hydrogen peroxide (TBHP); the response is recovered by ZSCAN10 expression. Mean ± s.d. is plotted for three independent clones in each group (n = 3). Statistical significance by two-sided t-test (Supplementary Table 5). (f) Apoptosis assay in A-iPSCs with GSS shRNA expression and Y-iPSCs–GSS by image quantification. A lower apoptotic response is seen 15 h after the end of phleomycin treatment (2 h, 30 μg ml−1) in A-iPSCs and in Y-iPSCs–GSS, and is recovered with GSS downregulation in A-iPSCs. The error bars indicate s.e.m. of three biological replicates with two independent clones in each group (n = 6). Statistical significance by two-sided t-test (Supplementary Table 5).
Figure 4
Figure 4
Evaluation of GSS regulation on DNA damage response and effects of different genetic backgrounds on GSS regulation. (a) Immunoblot of pATM showing recovery of the DNA damage response after phleomycin (PHLEO) treatment in three independent clones of A-iPSCs with shRNA-mediated knockdown of GSS (also see Supplementary Fig. 4c). (b) Immunoblot of pATM showing that expression of GSS complementary DNA (also see Supplementary Fig. 4f) impairs the DNA damage response in three independent clones of Y-iPSCs after phleomycin treatment. (c) Immunoblot of pATM showing recovery of the DNA damage response after phleomycin treatment in 10 independent clones of A-iPSCs with BSO (0.5 mM)-mediated inhibition of GSS. (d) Copy number profiling analysis of A-iPSCs (n = 10) generated from fibroblasts from tail tip skin of a 1.5-year-old B6129 mouse. (e) Immunoblot of p53 showing DNA damage response after phleomycin treatment in the majority of independent clones of A-iPSCs generated from a B6129 mouse. A poor DNA damage response (indicated by a lack of p53 upregulation after phleomycin treatment) was seen less frequently in A-iPSCs from B6129 mouse donors than in A-iPSCs from B6CBA mouse donors. However, the poor DNA damage response clone still shows the minimum induction of the DNA damage response. (f,g) Expression levels of ZSCAN10 and GSS in A-iPSCs from a B6129 mouse. The error bars indicate s.e.m. of two technical replicates with three independent clones in each sample group (n = 3). Statistical significance was determined by two-sided t-test followed by post hoc Holm–Bonferroni correction for a significance level of 0.05; * indicates significant and NS not significant. Unprocessed original scans of blots are shown in Supplementary Fig. 7.
Figure 5
Figure 5
Evaluation of ZSCAN10 function in DNA damage response and genomic integrity in human A-hiPSCs. (a) Immunoblots showing the levels of pATM and β-actin proteins with three imported A-hiPSC clones with known abnormal cytogenetic signature. (b) qPCR of ZSCAN10. The error bars indicate s.e.m. of two replicates with three independent clones (n= 6) in each sample group, except three biological replicates (n = 3) in the sample of A-iPSC-JA and A-iPSC-LS. Statistical significance was determined by two-sided t-test followed by post hoc Holm–Bonferroni correction for a significance level of 0.05; * indicates significant. (c) qPCR of GSS. Statistical significance was determined by two-sided t-test followed by post hoc Holm–Bonferroni correction for a significance level of 0.05; * indicates significant. The error bars indicate s.e.m. of two replicates with three independent clones (n = 6) in each sample group, except three biological replicates (n= 3) in the sample of A-iPSC-JA and A-iPSC-LS. (d) Immunoblots showing the levels of pATM and β-actin in five independent clones of A-hiPSCs, five independent clones of Y-hiPSCs and five clones of A-hiPSCs expressing ZSCAN10. (e) Immunoblot showing impaired ATM DNA damage response in Y-hiPSCs with ZSCAN10 shRNA expression in three independent clones after phleomycin treatment (2 h, 30 μg ml−1). (f) Copy number profiling analysis of Y-hiPSCs with ZSCAN10 shRNA expression in four independent clones. Unprocessed original scans of blots are shown in Supplementary Fig. 7.
Figure 6
Figure 6
Impaired DNA damage response in human A-hiPSCs caused by deregulation of ZSCAN10 and GSS and recovered by ZSCAN10 expression. (a) Excessive oxidation capacity with elevated glutathione in A-hiPSCs, and recovery by ZSCAN10 expression. The total glutathione level was measured to determine the maximum oxidation capacity. Excessive oxidation capacity of glutathione in A-hiPSCs is normalized to the level of hESCs and Y-hiPSCs by transient expression of ZSCAN10. Glutathione analysis was conducted with the glutathione fluorometric assay. Mean ± s.d. is plotted for three biological replicates with two independent clones (n = 6) in each sample group from each condition. Statistical significance was determined by two-sided t-test. (b) ROS scavenging activity of hESCs, Y-hiPSCs, A-hiPSCs and A-hiPSCs–ZSCAN10. A cellular ROS assay kit (DCFDA assay) was used to measure H2O2 scavenging activity. A-hiPSCs show strong H2O2 scavenging activity, with a reduced response against treatment with TBHP (tert-butyl hydrogen peroxide; stable chemical form of H2O2, 3 h); the response is recovered by ZSCAN10 expression. Mean ± s.d. is plotted for four biological replicates in each sample group from each condition (n= 4). Statistical significance was determined by two-sided t-test. (c) Immunoblot of pATM showing recovery of the DNA damage response after phleomycin treatment in three independent clones of A-hiPSCs with shRNA-mediated knockdown of GSS. (d) Immunoblot of pATM showing that lentiviral expression of GSS cDNA impairs the DNA damage response in three independent clones of Y-hiPSCs after phleomycin treatment. (eg) Copy number profiling analysis of human iPSCs. Schematic diagrams represent seven rearranged A-hiPSCs, four non-rearranged A-hiPSCs and five non-rearranged A-hiPSCs–ZSCAN10 in the genetically controlled setting of A-hiPSCs. Ten non-rearranged Y-hiPSCs, which were generated from a different tissue donor, were also included. A-hiPSCs (n = 11 (7/11), P = 0.64), A-hiPSCs–ZSCAN10 (n= 5 (0/5), P* = 6.3× 10⁻³) and Y-hiPSCs (n= 10 (0/10), P* < 4× 10⁻⁵). The number in parentheses represents detected rearrangements and P and P* are the observed and estimated likelihoods of detecting no rearrangements in the absence of lineage effects using a binomial distribution, respectively. Unprocessed original scans of blots are shown in Supplementary Fig. 7.

Similar articles

Cited by

References

    1. Prigione A, et al. Mitochondrial-associated cell death mechanisms are reset to an embryonic-like state in aged donor-derived iPS cells harboring chromosomal aberrations. PLoS ONE. 2011;6:e27352. - PMC - PubMed
    1. Kang E, et al. Age-related accumulation of somatic mitochondrial DNA mutations in adult-derived human iPSCs. Cell Stem Cell. 2016;18:625–636. - PubMed
    1. Lo Sardo V, et al. Influence of donor age on induced pluripotent stem cells. Nat Biotechnol. 2016;35:69–74. - PMC - PubMed
    1. Garber K. RIKEN suspends first clinical trial involving induced pluripotent stem cells. Nat Biotechnol. 2015;33:890–891. - PubMed
    1. Coghlan A. Unexpected mutations put stem cell trial on hold. New Sci. 2015;227:9.

MeSH terms