

TiO₂-Based Nanoheterostructures for Promoting Gas Sensitivity Performance: Designs, Developments, and Prospects
- PMID: 28846621
- PMCID: PMC5621145
- DOI: 10.3390/s17091971
TiO₂-Based Nanoheterostructures for Promoting Gas Sensitivity Performance: Designs, Developments, and Prospects
Abstract
Gas sensors based on titanium dioxide (TiO₂) have attracted much public attention during the past decades due to their excellent potential for applications in environmental pollution remediation, transportation industries, personal safety, biology, and medicine. Numerous efforts have therefore been devoted to improving the sensing performance of TiO₂. In those effects, the construct of nanoheterostructures is a promising tactic in gas sensing modification, which shows superior sensing performance to that of the single component-based sensors. In this review, we briefly summarize and highlight the development of TiO₂-based heterostructure gas sensing materials with diverse models, including semiconductor/semiconductor nanoheterostructures, noble metal/semiconductor nanoheterostructures, carbon-group-materials/semiconductor nano- heterostructures, and organic/inorganic nanoheterostructures, which have been investigated for effective enhancement of gas sensing properties through the increase of sensitivity, selectivity, and stability, decrease of optimal work temperature and response/recovery time, and minimization of detectable levels.
Keywords: TiO2; gas sensor; nanoheterostructures.
Conflict of interest statement
The authors declare no conflict of interest.
Figures


Similar articles
-
Highly Selective Room-Temperature Blue LED-Enhanced NO2 Gas Sensors Based on ZnO-MoS2-TiO2 Heterostructures.Sensors (Basel). 2025 Mar 13;25(6):1781. doi: 10.3390/s25061781. Sensors (Basel). 2025. PMID: 40292913 Free PMC article.
-
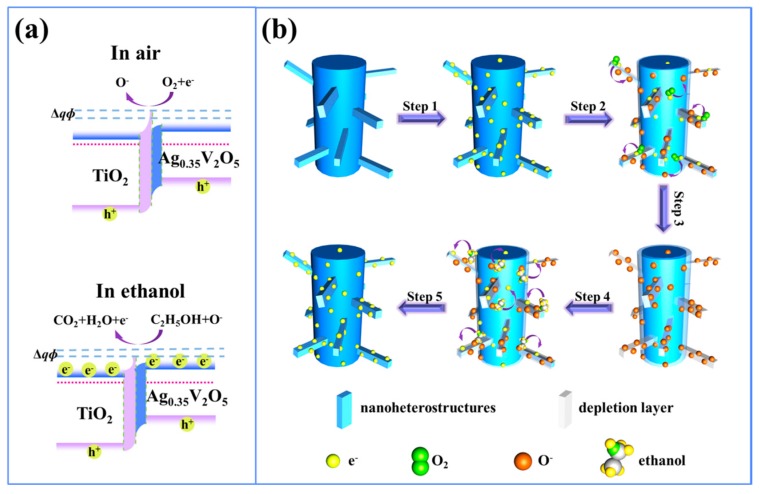
A novel ethanol gas sensor based on TiO2/Ag0.35V2O5 branched nanoheterostructures.Sci Rep. 2016 Sep 12;6:33092. doi: 10.1038/srep33092. Sci Rep. 2016. PMID: 27615429 Free PMC article.
-
Recent Advances in Semiconductor-Graphene and Semiconductor-Ferroelectric/Ferromagnetic Nanoheterostructures for Efficient Hydrogen Generation and Environmental Remediation.ACS Omega. 2020 May 21;5(21):11874-11882. doi: 10.1021/acsomega.9b03913. eCollection 2020 Jun 2. ACS Omega. 2020. PMID: 32548366 Free PMC article. Review.
-
A high-response ethanol gas sensor based on one-dimensional TiO2/V2O5 branched nanoheterostructures.Nanotechnology. 2016 Oct 21;27(42):425503. doi: 10.1088/0957-4484/27/42/425503. Epub 2016 Sep 19. Nanotechnology. 2016. PMID: 27640550
-
Nickel Oxide Nanostructures for Gas Sensing: Recent Advances, Challenges, and Future Perspectives.ACS Sens. 2025 Mar 28;10(3):1641-1674. doi: 10.1021/acssensors.4c02946. Epub 2025 Mar 10. ACS Sens. 2025. PMID: 40059852 Review.
Cited by
-
TiO2-x/TiO2-Structure Based 'Self-Heated' Sensor for the Determination of Some Reducing Gases.Sensors (Basel). 2019 Dec 21;20(1):74. doi: 10.3390/s20010074. Sensors (Basel). 2019. PMID: 31877794 Free PMC article.
-
PbS Quantum Dots Decorating TiO2 Nanocrystals: Synthesis, Topology, and Optical Properties of the Colloidal Hybrid Architecture.Molecules. 2020 Jun 26;25(12):2939. doi: 10.3390/molecules25122939. Molecules. 2020. PMID: 32604749 Free PMC article.
-
Visible-Light Active Titanium Dioxide Nanomaterials with Bactericidal Properties.Nanomaterials (Basel). 2020 Jan 9;10(1):124. doi: 10.3390/nano10010124. Nanomaterials (Basel). 2020. PMID: 31936581 Free PMC article. Review.
-
Ultraviolet Photoactivated Room Temperature NO2 Gas Sensor of ZnO Hemitubes and Nanotubes Covered with TiO2 Nanoparticles.Nanomaterials (Basel). 2020 Mar 4;10(3):462. doi: 10.3390/nano10030462. Nanomaterials (Basel). 2020. PMID: 32143528 Free PMC article.
-
Utilization of Nano-TiO2 as an Influential Additive for Complementing Separation Performance of a Hybrid PVDF-PVP Hollow Fiber: Boron Removal from Leachate.Polymers (Basel). 2020 Oct 28;12(11):2511. doi: 10.3390/polym12112511. Polymers (Basel). 2020. PMID: 33126619 Free PMC article.
References
Publication types
LinkOut - more resources
Full Text Sources
Other Literature Sources
Miscellaneous
