Review
. 2017 Aug 28;18(9):1865.
doi: 10.3390/ijms18091865.

Monitoring and Measuring Autophagy

Affiliations
Review

Monitoring and Measuring Autophagy

Saori R Yoshii et al. Int J Mol Sci. .

Abstract

Autophagy is a cytoplasmic degradation system, which is important for starvation adaptation and cellular quality control. Recent advances in understanding autophagy highlight its importance under physiological and pathological conditions. However, methods for monitoring autophagic activity are complicated and the results are sometimes misinterpreted. Here, we review the methods used to identify autophagic structures, and to measure autophagic flux in cultured cells and animals. We will also describe the existing autophagy reporter mice that are useful for autophagy studies and drug testing. Lastly, we will consider the attempts to monitor autophagy in samples derived from humans.

Keywords: Keima; LC3; autophagic flux; autophagosome; isolation membrane; p62/SQSTM1.


Conflict of interest statement

The authors declare no conflicts of interest.

Figures

Figure 1
Figure 1
(A) The site of autophagosome formation. Upstream autophagy factors and autophagy substrates accumulate at the autophagosome formation site independently from one another. The most upstream autophagy factors are ATG9A in vesicles and the ULK1 complex. Autophagy substrates include p62/SQSTM1, ferritin, and damaged mitochondria. The autophagosome formation site localizes in close apposition to the endoplasmic reticulum (ER); (B) Isolation membrane formation. Isolation membranes emerge from within the ring-shaped structure called the omegasome. The omegasome is a phosphatidylinositol 3-phosphate -rich ER subdomain characterized by the existence of double-FYVE domain-containing protein 1 (DFCP1). ATG factors commonly used to visualize isolation membranes include ULK1, WIPI1/2, ATG5, and LC3. Most ATG factors but not LC3 homologs detach from the isolation membranes before completion of autophagosomes. These isolation membrane markers are localized on the outer membrane, whereas LC3 and its homologs and associating p62/SQSTM1 are localized on both outer and inner membranes. Isolation membranes are observed by electron microscopy as crescent-shaped structures that are often flanked by rough ER; (C) Completion of autophagosome formation. Several minutes after detachment of ATG factors, LC3-positive autophagosomes acquire syntaxin17 (STX17). STX17 localizes to ER, mitochondria, and complete autophagosomes; therefore, not all the STX17 signals represent autophagosomes. Cytoplasmic components enclosed in the characteristic double-membraned structures mark autophagosomes observed by electron microscopy (EM). The width of the cleft between the outer and inner membranes can vary due to experimental procedures such as fixation; (D) Fusion with lysosomes. Autophagosomes that have acquired STX17 fuse with lysosomes to degrade the contents of the autophagosomes. Upon fusion with lysosomes, the space between the outer and inner autophagosomal membranes becomes acidified, followed by collapse of the inner membrane; (E) Autolysosome. Fusion of autophagosomes and lysosomes generates autolysosomes that contain degraded cytoplasmic components. Autolysosomes can be identified by EM or colocalization of LC3 and lysosomal markers by fluorescence microscopy.
Figure 2
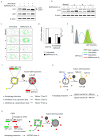
Figure 2
(A) A schematic illustration of detection of autophagic flux by immunoblotting. Both LC3-II and p62 are degraded by autophagy; therefore, the amounts of LC3-II and p62 degraded by autophagy, but not their expression levels, provide an estimate of the autophagic activity. Typically, autophagy induction, for instance by nutrient starvation, converts LC3-I to LC3-II and induces an increase in LC3-II and a concurrent decrease in p62. Inhibition of lysosomal degradation by bafilomycin A1 causes accumulation of LC3-II and p62, and this increment reflects the amount of LC3-II and p62 that would have been degraded by autophagy over the treatment period; (B) A schematic illustration of the interpretation of LC3 immunoblotting results. Autophagic flux in normal cells is estimated by an increase in the LC3-II amount under bafilomycin A1 treatment. Group “a” has an increased amount of LC3-II in the basal state, which further increases in the presence of bafilomycin A1, suggesting increased autophagic flux in these cells. Group “b” has a low level of LC3-II under basal conditions and does not respond to bafilomycin A1 treatment, suggesting that autophagy is suppressed in these cells. Group “c” has a large amount of LC3-II under basal conditions, which does not increase by bafilomycin A1 treatment, suggesting decreased autophagic flux (e.g., by a defect in lysosomal degradation) rather than induction of autophagy in these cells; (C) Detection of autophagic flux by fluorescence microscopy. LC3 is recruited to autophagosomes forming punctate structures as indicated by green dots. The number of LC3-positive puncta increases in the presence of bafilomycin A1 in normal cells. Cells with activated autophagy (group “a”) have a larger number of LC3 puncta, which further increases with bafilomycin A1 treatment. Cells that are defective in autophagy induction (group “b”) have a small number of LC3 puncta in basal conditions, and the number does not increase by bafilomycin A1 treatment. It should be noted that protein aggregates in these autophagy-deficient cells are also observed as puncta positive for LC3 as well as p62. Cells that are deficient for lysosomal degradation (group “c”) have many LC3-positive puncta under basal conditions but the number of these puncta does not increase by bafilomycin A1 treatment as observed in normal cells; (D) Measurement of degradation of long-lived proteins labeled with radioisotopes. Degradation of long-lived proteins is detected by the release of isotope-labeled amino acids. The release is inhibited by lysosomal inhibitors (e.g., bafilomycin A1). Autophagy-deficient cells have a reduced release of isotope-labeled amino acids without lysosomal inhibitors. The amount indicated by “x” reflects autophagy-dependent protein degradation; the amount indicated by “y” reflects autophagy-independent protein degradation by the lysosome; (E) GFP-LC3 degradation assay by flow cytometry. GFP-LC3 on the inner autophagosomal membrane is degraded by the lysosome along with the autophagosome contents; therefore, a decrease in GFP-LC3 over time provides an estimate of the autophagic flux. Degradation of GFP-LC3 is inhibited by bafilomycin A1 treatment; (F) mRFP-GFP-LC3 tandem fluorescent probe. In the lysosome, the fluorescence of GFP is quenched due to its low pH whereas that of mRFP is stable. Formation of autophagosomes causes an increase in the number of GFP-positive/mRFP-positive (yellow) puncta, and the puncta become GFP-negative /mRFP-positive (red) upon fusion with lysosomes. Autophagy induction results in the increase in both yellow and red puncta, inhibition of autophagy induction results in a decrease in both yellow and red puncta, and inhibition of lysosomal acidification or lysosome fusion results in an increase in yellow puncta and a decrease in red puncta; (G) Keima, a fluorescent protein with bimodal excitation. Keima, a fluorescent protein with an emission peak at 620 nm, has bimodal excitation spectra dependent on the surrounding pH. In neutral pH, Keima has an excitation peak at 440 nm, and in the acidic compartment its excitation peak shifts to 586 nm. Therefore, the amount of Keima delivered to the lysosome over time can be estimated by the ratio of signal strength excited at 550 nm divided by that excited at 438 nm. Delivery of cytosolic Keima to the lysosome reflects non-selective (bulk) autophagy, and delivery of Keima fused to a specific protein (such as mitochondria-targeted Keima) reflects selective autophagy. H. GFP-LC3-RFP-LC3ΔG, a fluorescent probe that releases an internal control. The C-terminus of LC3 is cleaved by ATG4, thus one GFP-LC3-RFP-LC3ΔG tandem protein is cleaved into two equimolar proteins, GFP-LC3 and RFP-LC3ΔG. GFP-LC3 is conjugated to phosphatidylethanolamine (PE) and degraded by autophagy. Conversely, RFP-LC3ΔG cannot be conjugated to PE and remains cytosolic; therefore, autophagic flux can be estimated by a decrease in GFP fluorescence in comparison to RFP fluorescence (decrease in the GFP/RFP ratio).

Similar articles

Cited by

References

    1. Mizushima N., Komatsu M. Autophagy: Renovation of cells and tissues. Cell. 2011;147:728–741. doi: 10.1016/j.cell.2011.10.026. - DOI - PubMed
    1. Li W.W., Li J., Bao J.K. Microautophagy: Lesser-known self-eating. Cell. Mol. Life Sci. 2012;69:1125–1136. doi: 10.1007/s00018-011-0865-5. - DOI - PMC - PubMed
    1. Mijaljica D., Prescott M., Devenish R.J. Microautophagy in mammalian cells: Revisiting a 40-year-old conundrum. Autophagy. 2011;7:673–682. doi: 10.4161/auto.7.7.14733. - DOI - PubMed
    1. Cuervo A.M., Wong E. Chaperone-mediated autophagy: Roles in disease and aging. Cell Res. 2014;24:92–104. doi: 10.1038/cr.2013.153. - DOI - PMC - PubMed
    1. Patel B., Cuervo A.M. Methods to study chaperone-mediated autophagy. Methods. 2015;75:133–140. doi: 10.1016/j.ymeth.2015.01.003. - DOI - PMC - PubMed

Substances