

HLA class I haplotype diversity is consistent with selection for frequent existing haplotypes
- PMID: 28846675
- PMCID: PMC5590998
- DOI: 10.1371/journal.pcbi.1005693
HLA class I haplotype diversity is consistent with selection for frequent existing haplotypes
Abstract
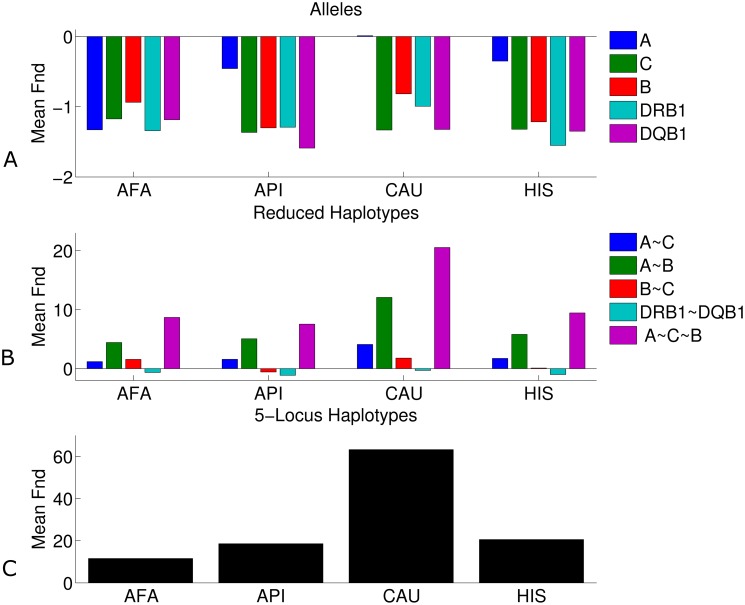
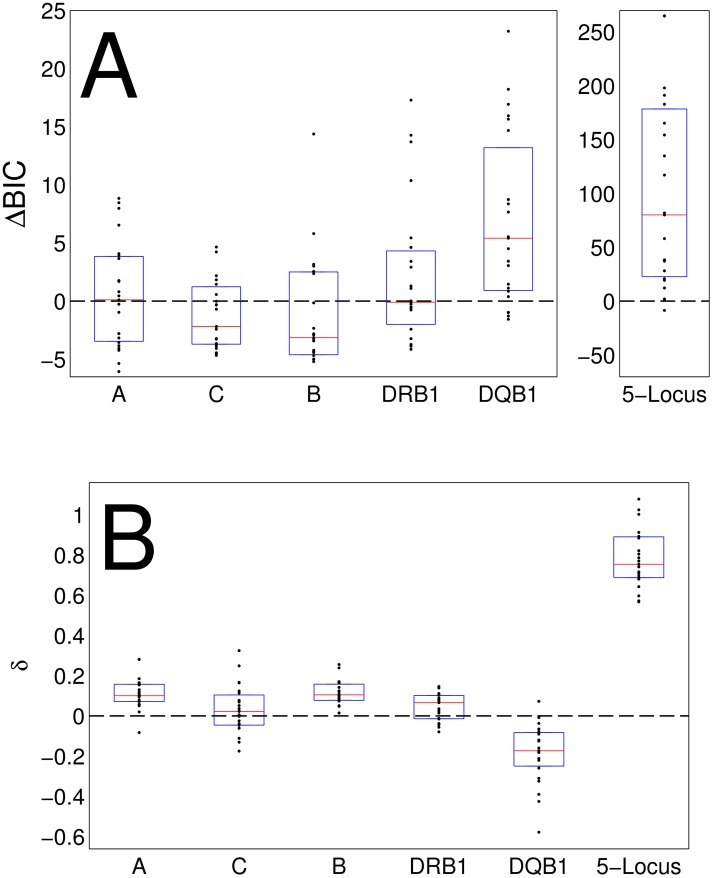
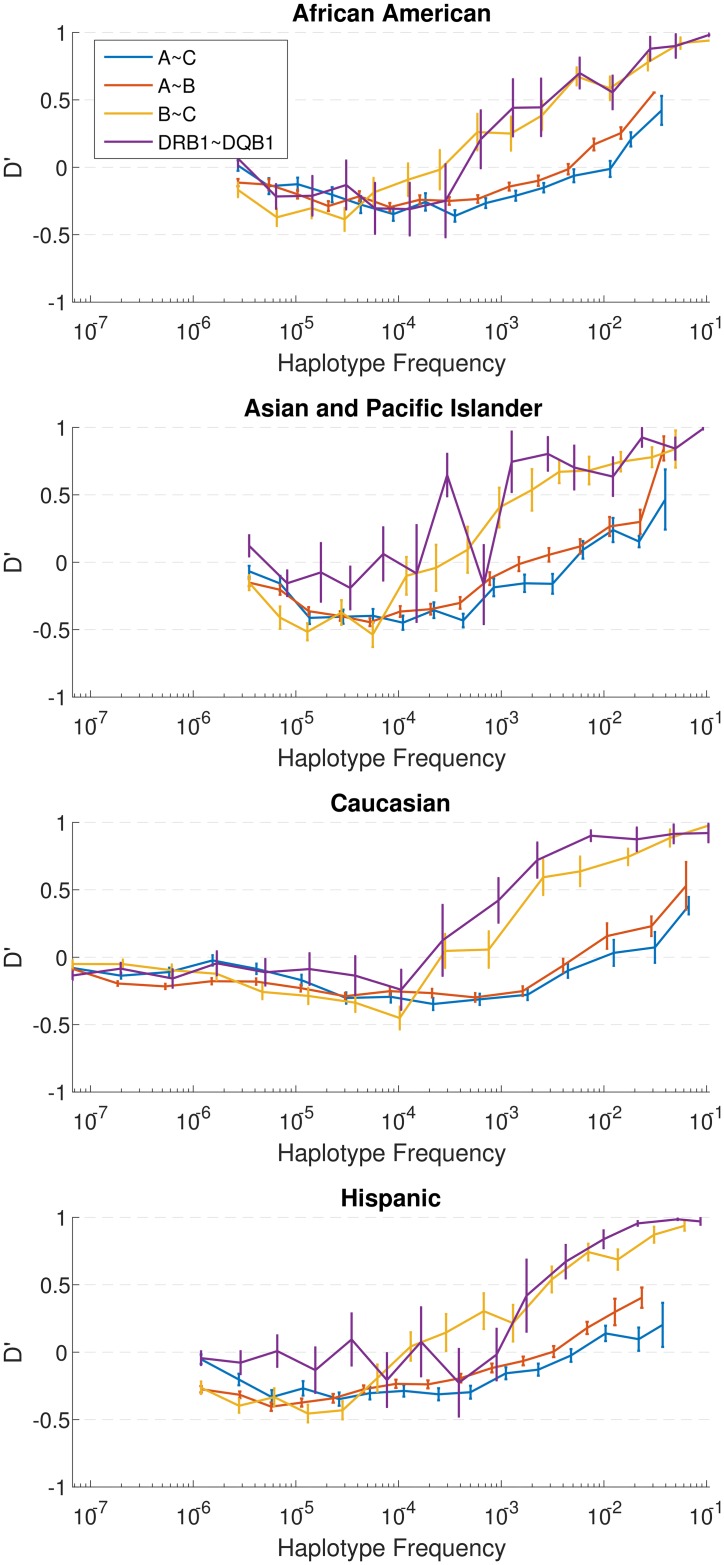
The major histocompatibility complex (MHC) contains the most polymorphic genetic system in humans, the human leukocyte antigen (HLA) genes of the adaptive immune system. High allelic diversity in HLA is argued to be maintained by balancing selection, such as negative frequency-dependent selection or heterozygote advantage. Selective pressure against immune escape by pathogens can maintain appreciable frequencies of many different HLA alleles. The selection pressures operating on combinations of HLA alleles across loci, or haplotypes, have not been extensively evaluated since the high HLA polymorphism necessitates very large sample sizes, which have not been available until recently. We aimed to evaluate the effect of selection operating at the HLA haplotype level by analyzing HLA A~C~B~DRB1~DQB1 haplotype frequencies derived from over six million individuals genotyped by the National Marrow Donor Program registry. In contrast with alleles, HLA haplotype diversity patterns suggest purifying selection, as certain HLA allele combinations co-occur in high linkage disequilibrium. Linkage disequilibrium is positive (Dij'>0) among frequent haplotypes and negative (Dij'<0) among rare haplotypes. Fitting the haplotype frequency distribution to several population dynamics models, we found that the best fit was obtained when significant positive frequency-dependent selection (FDS) was incorporated. Finally, the Ewens-Watterson test of homozygosity showed excess homozygosity for 5-locus haplotypes within 23 US populations studied, with an average Fnd of 28.43. Haplotype diversity is most consistent with purifying selection for HLA Class I haplotypes (HLA-A, -B, -C), and was not inferred for HLA Class II haplotypes (-DRB1 and-DQB1). We discuss our empirical results in the context of evolutionary theory, exploring potential mechanisms of selection that maintain high linkage disequilibrium in MHC haplotype blocks.
Conflict of interest statement
The authors have declared that no competing interests exist.
Figures
Similar articles
-
HLA class I (A, B, C) and class II (DRB1, DQA1, DQB1, DPB1) alleles and haplotypes in the Han from southern China.Tissue Antigens. 2007 Dec;70(6):455-63. doi: 10.1111/j.1399-0039.2007.00932.x. Epub 2007 Sep 27. Tissue Antigens. 2007. PMID: 17900288
-
Differentiation between African populations is evidenced by the diversity of alleles and haplotypes of HLA class I loci.Tissue Antigens. 2004 Apr;63(4):293-325. doi: 10.1111/j.0001-2815.2004.00192.x. Tissue Antigens. 2004. PMID: 15009803
-
Extended HLA Haplotypes and Their Impact on DPB1 Matching of Unrelated Hematologic Stem Cell Transplant Donors.Biol Blood Marrow Transplant. 2019 Oct;25(10):1956-1964. doi: 10.1016/j.bbmt.2019.07.008. Epub 2019 Jul 12. Biol Blood Marrow Transplant. 2019. PMID: 31306777
-
HLA-A, -B, and -DRB1 allele and haplotype diversity in a cohort of Brazilian renal transplant candidates.Hum Immunol. 2016 Jun;77(6):464-9. doi: 10.1016/j.humimm.2016.04.017. Epub 2016 Apr 22. Hum Immunol. 2016. PMID: 27108963 Review.
-
Genetic Diversity and Ethnic Tapestry of Kazakhstan as Inferred from HLA Polymorphism and Population Dynamics: A Comprehensive Review.Genes (Basel). 2025 Mar 15;16(3):342. doi: 10.3390/genes16030342. Genes (Basel). 2025. PMID: 40149493 Free PMC article. Review.
Cited by
-
Reply to Hedrick and Klitz: High haplotype discovery rate in the HLA locus.Proc Natl Acad Sci U S A. 2019 Nov 19;116(47):23388-23389. doi: 10.1073/pnas.1916124116. Epub 2019 Oct 29. Proc Natl Acad Sci U S A. 2019. PMID: 31662470 Free PMC article. No abstract available.
-
High Resolution Class I HLA -A, -B, and -C Diversity in Eastern and Southern African Populations.bioRxiv [Preprint]. 2024 Sep 8:2024.09.04.611164. doi: 10.1101/2024.09.04.611164. bioRxiv. 2024. Update in: Sci Rep. 2025 Jul 2;15(1):23667. doi: 10.1038/s41598-025-06704-4. PMID: 39282263 Free PMC article. Updated. Preprint.
-
Polygenic polymorphism is associated with NKG2A repertoire and influences lymphocyte phenotype and function.Blood Adv. 2024 Oct 22;8(20):5382-5399. doi: 10.1182/bloodadvances.2024013508. Blood Adv. 2024. PMID: 39158076 Free PMC article.
-
Clinical settings in which human leukocyte antigen typing is still useful in the diagnosis of celiac disease.World J Gastroenterol. 2025 Apr 14;31(14):104397. doi: 10.3748/wjg.v31.i14.104397. World J Gastroenterol. 2025. PMID: 40248378 Free PMC article. Review.
-
MHC Haplotyping of SARS-CoV-2 Patients: HLA Subtypes Are Not Associated with the Presence and Severity of COVID-19 in the Israeli Population.J Clin Immunol. 2021 Aug;41(6):1154-1161. doi: 10.1007/s10875-021-01071-x. Epub 2021 May 29. J Clin Immunol. 2021. PMID: 34050837 Free PMC article.
References
-
- Beck S, Geraghty D, Inoko H, Rowen L (1999) Complete sequence and gene map of a human major histocompatibility complex. Nature 401: 921–923. doi: 10.1038/44853 - DOI - PubMed
-
- Consortium TMHCs (1999) Complete sequence and gene map of a human major histocompatibility complex. Nature 401: 921–923. doi: 10.1038/44853 - DOI - PubMed
-
- Yeager M, Hughes AL (1999) Evolution of the mammalian MHC: natural selection, recombination, and convergent evolution. Immunological Reviews 167: 45–58. - PubMed
-
- Carrington M, O'Brien SJ (2003) The Influence of HLA Genotype on AIDS*. Annual review of medicine 54: 535–551. doi: 10.1146/annurev.med.54.101601.152346 - DOI - PubMed
MeSH terms
Substances
LinkOut - more resources
Full Text Sources
Other Literature Sources
Research Materials
