. 2017 Aug 28;13(8):e1006990.
doi: 10.1371/journal.pgen.1006990. eCollection 2017 Aug.

β-catenin is required for taste bud cell renewal and behavioral taste perception in adult mice

Affiliations

β-catenin is required for taste bud cell renewal and behavioral taste perception in adult mice

Dany Gaillard et al. PLoS Genet. .

Abstract

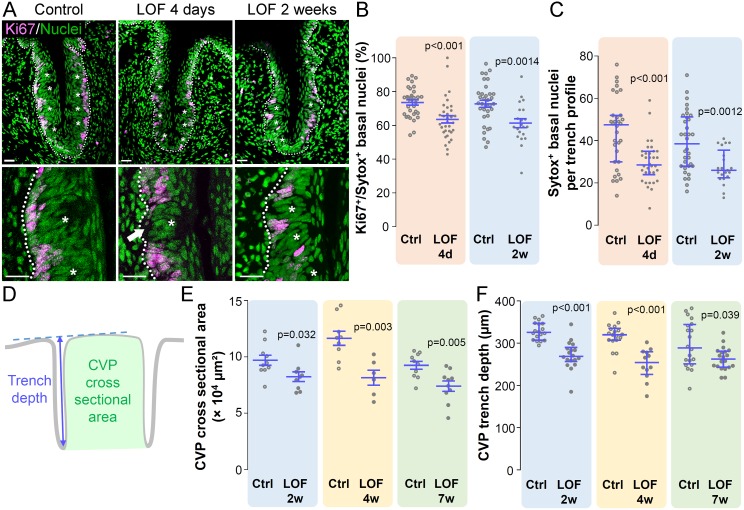
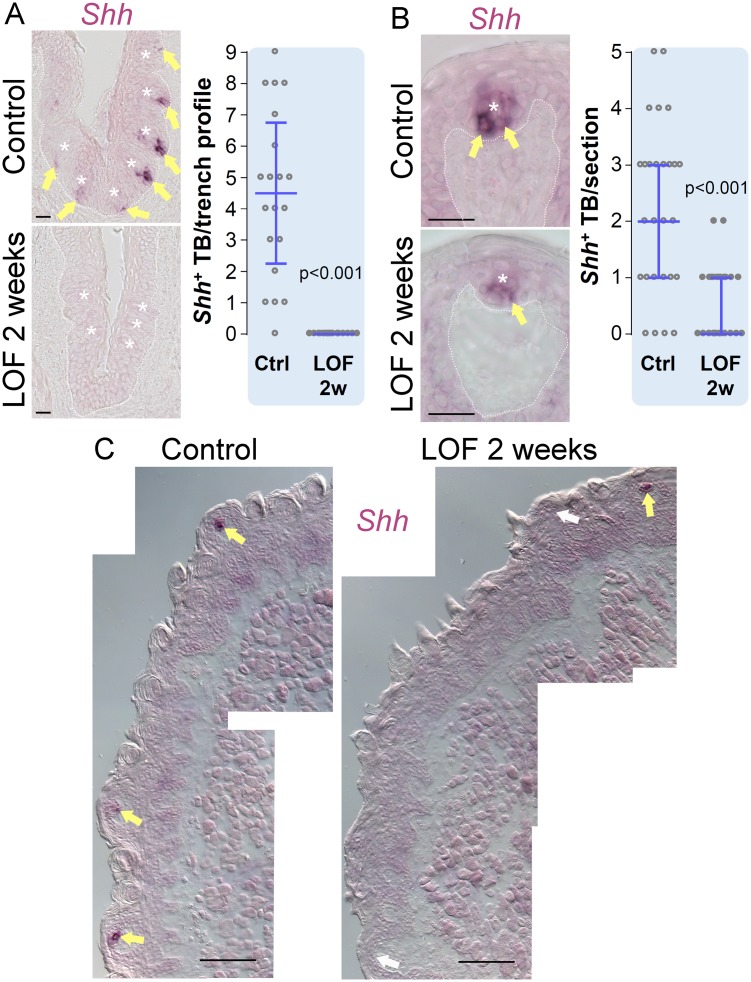
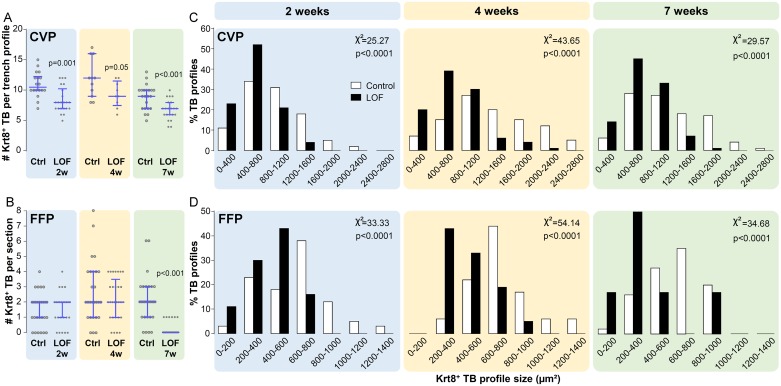
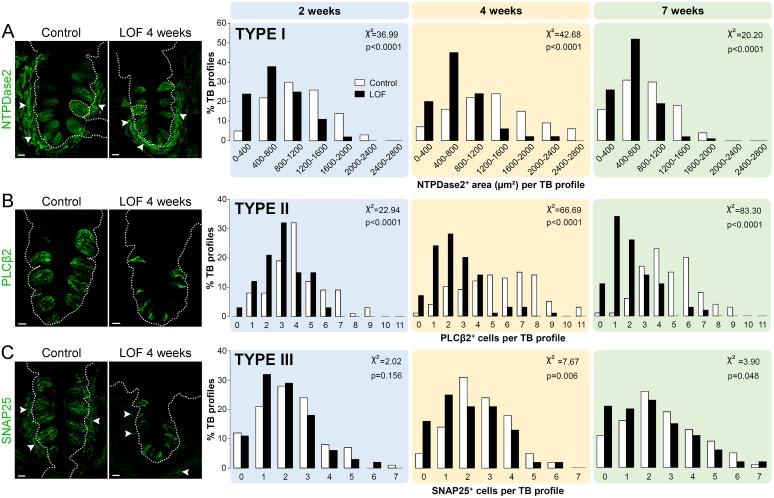
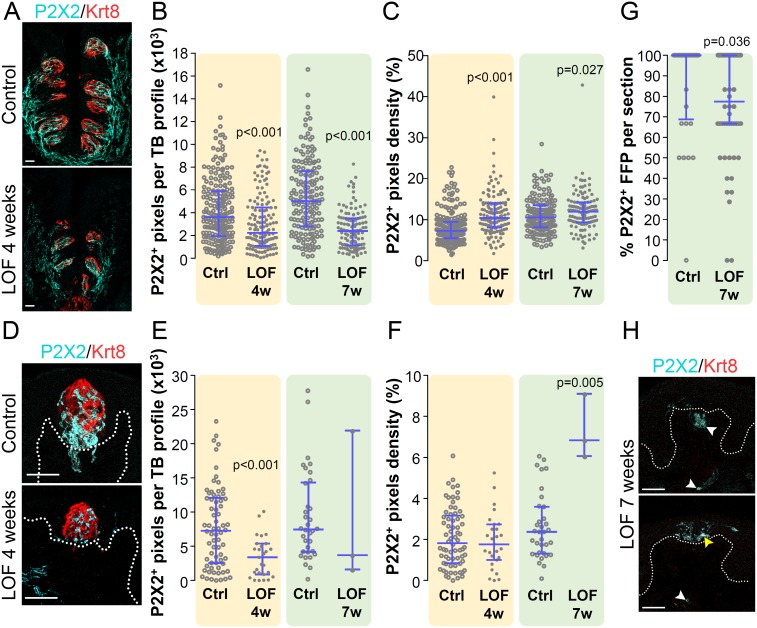
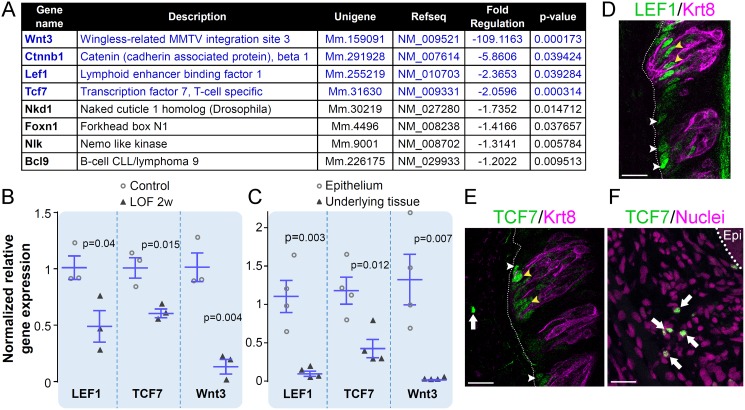
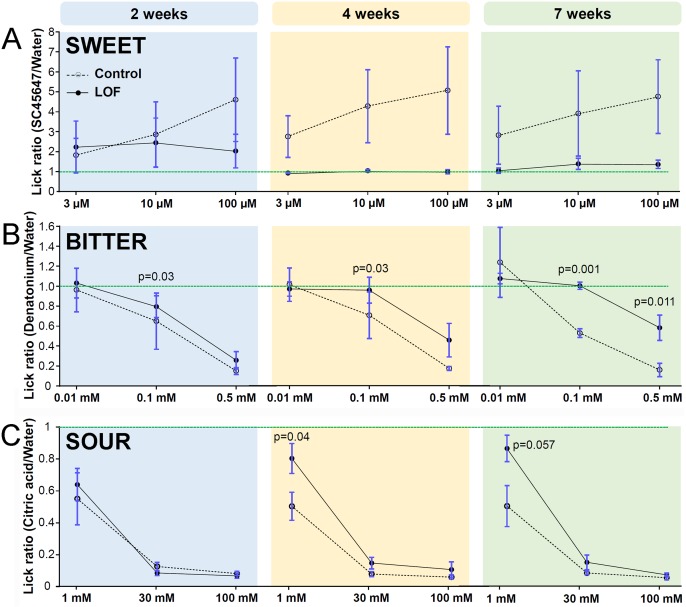
Taste stimuli are transduced by taste buds and transmitted to the brain via afferent gustatory fibers. Renewal of taste receptor cells from actively dividing progenitors is finely tuned to maintain taste sensitivity throughout life. We show that conditional β-catenin deletion in mouse taste progenitors leads to rapid depletion of progenitors and Shh+ precursors, which in turn causes taste bud loss, followed by loss of gustatory nerve fibers. In addition, our data suggest LEF1, TCF7 and Wnt3 are involved in a Wnt pathway regulatory feedback loop that controls taste cell renewal in the circumvallate papilla epithelium. Unexpectedly, taste bud decline is greater in the anterior tongue and palate than in the posterior tongue. Mutant mice with this regional pattern of taste bud loss were unable to discern sweet at any concentration, but could distinguish bitter stimuli, albeit with reduced sensitivity. Our findings are consistent with published reports wherein anterior taste buds have higher sweet sensitivity while posterior taste buds are better tuned to bitter, and suggest β-catenin plays a greater role in renewal of anterior versus posterior taste buds.


Conflict of interest statement

The authors have declared that no competing interests exist.

Figures

Fig 1
Fig 1. Krt5-β-catenin-LOF results in reduced basal keratinocytes and proliferation, and leads to a smaller CVP.
(A) Many proliferating Ki67+ cells (magenta) are evident at the basement membrane of a control CVP, while in Krt5-β-catenin LOF mutants at 4 days and 2 weeks, fewer Ki67+ cells are evident in each CVP trench. Representative images are compressed z-stacks. Nuclei were counterstained with Sytox Green (green). Dotted line delineates the basement membrane. Taste buds are marked with asterisks. Scale bars = 20 μm. (B) Progenitor proliferation was significantly decreased in LOF mutants compared to controls at both 4 days and 2 weeks. (C) The total number of basal progenitor cells residing along the basement membrane was significantly lower in mutants compared to controls after 4 days and 2 weeks of Krt5-β-catenin LOF (white arrow). CVP size was assessed via the cross sectional area between the two trenches (D, green area), and CVP trench depth (D, blue arrow). By 2 weeks of doxycycline chow, CVP size and trench depth were reduced in mutant mice compared with controls (E,F). Data are represented as scatter plots (individual symbols), and mean ± SEM (B,E, blue bars. Student’s t-test) or median with 1st and 3rd quartile (C,F, blue bars. Mann & Whitney test). Sample sizes: (B,C) 32 vs 34 CVP trench sections at 4 days and 34 vs 21 CVP trench sections at 2 weeks from 3 control mice vs 3 mutant mice, respectively. (E) 6–10 CVP profiles from 3–4 control mice and 3 mutant mice; (F) 12–20 CVP trench profiles from 3–4 control mice and 3 mutant mice.
Fig 2
Fig 2. Beta-catenin deletion in Krt5+ progenitors reduces Shh expressing taste precursor cells in CVP and FFP taste buds.
In control mice, Shh is expressed in taste precursors that give rise to all three cell types (A,B,C, yellow arrows). In the CVP, Shh expression is abolished in mutants after 2 weeks on doxycycline chow (A), while the number of Shh+ taste buds is greatly reduced in mutant FFP (B,C). Dotted line delineates the basement membrane. Taste buds are marked with asterisks. Shh- FFPs are marked with white arrows. TB: taste bud. Data are represented as scatter plots (individual symbols), and median with 1st and 3rd quartile (blue bars. Mann & Whitney test). (A) 18–20 CVP trench profiles. (B) 27 FFP profiles. N = 3 control mice and 3 mutant mice. Scale bars in A, B = 20 μm, C = 100 μm.
Fig 3
Fig 3. Taste bud number and size are reduced by deletion of β-catenin in Krt5+ progenitors.
(A) The number of Krt8+ taste buds was significantly reduced in the CVP of mutants by 2 weeks on doxycycline chow, and this reduction remained relatively constant at 4 and 7 weeks. (B) The number of Krt8+ FFP taste buds in the anterior tongue did not differ between mutants and controls at 2 and 4 weeks of β-catenin deletion, but Krt8+ taste buds were virtually absent in mutant tongues at 7 weeks; only 6 FFP taste buds were observed in 5 mutant animals, compared to 51 in 4 controls. Both the CVP (C) and FFP (D) of mutant mice housed smaller taste buds than those of controls after 2, 4 and 7 weeks of doxycycline chow. TB: taste bud. Data are represented as scatter plots (individual symbols), and median with 1st and 3rd quartile (A,B blue bars. Mann & Whitney test), or taste bud size distribution (C,D Two-sample chi-square for trend). Sample sizes: (A) 9–22 CVP trench profiles from 3–4 control mice and 3 mutant mice per time point; (B) 25–59 anterior tongue sections from 3–4 control mice and 3–5 mutant mice per time point; (C) 84–198 CVP taste bud profiles from 3–4 control mice and 3 mutant mice per time point; (D) 6–51 FFP taste bud profiles from 4 control mice and 5 mutant mice per time point.
Fig 4
Fig 4. Krt5-β-catenin LOF reduces all 3 taste cell types in the CVP.
(A) NTPDase2 (green) marks the membranes of Type I glial-like taste cells, as well as a subset of mesenchymal cells adjacent to the CVP epithelium (white arrowheads). The area of taste buds (selected by outlining Krt8+ immunostaining) occupied by NTPDase2+ signal within the CVP epithelium is a proxy for Type I cell prevalence (yellow dotted circles; and see Methods), and NTPDase2+ area per taste bud profile become progressively smaller in mutants (black bars, yellow dotted circle) compared to controls (white bars, yellow dotted circle). (B) PLCβ2 (green) marks the cytoplasm of Type II taste cells, and individual cells are easily counted. In mutants, the number of PLCβ2+ Type II cells per taste bud is significantly reduced in mutant CVP at all time points. (C) SNAP25 (green) is expressed by Type III cells, and by nerve fibers innervating lingual epithelium (white arrowheads). Type III cells per taste bud in mutants did not differ from controls at 2 weeks, and were only mildly reduced in the CVP of Krt5-β-catenin LOF mice at 4 and 7 weeks. TB: taste bud. Taste cell type data are presented as the number of taste buds falling into each bin along the X axis (NTPdase2+ area per Krt8+ bud profile in A, PLCβ2+ cell number per Krt8+ bud profile in B, and SNAP25+ cell number per Krt8+ bud profile in C). For all histogram panels, significance was determined by a Two-sample chi-square for trend. Sample sizes: (A) 82–227 CVP taste bud profiles; (B) 34–216 CVP taste bud profiles; (C) 118–308 CVP taste bud profiles, from 3–6 control mice and 3–5 mutant mice at each time point. Representative images are compressed z-stacks. Dotted lines delineate basement membrane. Scale bars = 20 μm.
Fig 5
Fig 5. Gustatory innervation is reduced following loss of taste buds in Krt5-β-catenin LOF mice.
P2X2 is expressed by gustatory fibers innervating taste buds. In mutants, CVP taste buds had fewer P2X2+ pixels than controls at 4 and 7 weeks of doxycycline chow (A,B); however, because CVP taste buds become smaller in mutants, the density of P2X2+ pixels per bud increased (C). Total P2X2+ pixels per FFP taste bud were reduced in mutant mice fed doxycycline for 4 weeks (D,E), while P2X2+ innervation of the few remaining taste buds at 7 weeks was highly variable (E). P2X2+ pixel density in mutant FFP did not differ from controls at 4 weeks, despite the smaller size of mutant taste buds at this time (see Fig 3D), but was significantly greater in the few remaining taste buds in mutants at 7 weeks (F). In the absence of Krt8+ taste buds, empty FFP are identified via P2X2+ fibers. Compared to controls, fewer P2X2+ FFP were present in mutant mice fed doxycycline for 7 weeks (G,H); of these, P2X2+ fibers were evident in the mesenchymal core of FFP (H, white arrowheads), and were seldom observed in the epithelium (H, yellow arrowhead). Data are represented as scatter plots (individual symbols), and median with 1st and 3rd quartile (blue bars. Mann & Whitney test). Sample sizes: (B,C) 125–215 CVP taste bud profiles from 3–4 control mice and 3–4 mutant mice per time point; (E,F) 34–70 FFP taste bud profiles from 3–4 control mice and 3–27 FFP taste bud profiles from 3 mutant mice per time point; (G) 32–54 FFP profiles from 3–4 control mice and 3–4 mutant mice per time point. Note: low numbers of taste buds observed represent those measured at 7 weeks, when few FFP taste buds remained in all animals. (A,D,H) Representative images are compressed z-stacks. Dotted lines delineate the basement membrane. Scale bars = 20 μm.
Fig 6
Fig 6. LEF1, TCF7 and Wnt3 are downregulated in Krt5-β-catenin LOF CVP.
To identify Wnt pathway genes regulated in the absence of β-catenin, a Wnt pathway RT2 profiler PCR assay was run on RNAs extracted from whole CVP of Krt5-β-catenin LOF mice and their control counterparts (see Methods). As expected, β-catenin expression was downregulated 6 fold in Krt5-β-catenin LOF mice compared with controls (A). Seven other genes were significantly regulated; all being downregulated (A) and attention was focused on genes which expression changed more than 2 fold, i.e. LEF1, TCF7 and Wnt3 (A, genes in blue). Regulation of LEF1, TCF7 and Wnt3 expression was confirmed by qRT-PCR (B). qRT-PCR analysis of epithelium versus underlying tissue (mesenchyme and Von Ebner’s glands) of wild-type CVPs revealed that LEF1 and Wnt3 are specifically expressed in the epithelium whereas expression of TCF7 is predominant in the epithelium and lower in the underlying tissue (C). Immunolabelling of LEF1 and TCF7 is localized in perigemmal basal cell, which include progenitors (D,E, white arrowheads) and within taste buds (D,E, yellow arrowheads). In addition, TCF7 signal was observed in the mesenchyme (E,F, white arrows) supporting the qRT-PCR data. Dotted line delineates the basement membrane; Epi: CVP trench epithelium. N = 3 mice per group, except C (n = 4). Data are represented as scatter plots (individual symbols), and mean ± SEM (blue bars. Student’s t-test). Representative images are compressed z-stacks. Dotted lines delineate the basement membrane. Nuclei were counterstained with DRAQ5. Scale bars = 20 μm.
Fig 7
Fig 7. β-catenin deletion in Krt5+ progenitors causes early loss of behavioral discrimination of sweet, followed by reduced sensitivity to bitter.
Taste sensitivity of control and mutant mice was assessed using brief-access lickometers. By 4 weeks, mutant mice could not distinguish the artificial sweetener SC45647 from water (A). (B) Detection of the bitter tastant, denatonium, was slightly impaired in mutants at 2 and 4 weeks; by 7 weeks, LOF mice displayed highly reduced sensitivity to bitter. Detection of the lowest concentration of citric acid tested was slightly reduced in mutant mice at 4 and 7 weeks (C). The lick ratio is the average number of licks triggered by a tastant stimulus divided by the average number of licks triggered by water; green dash line marks a lick ratio of 1, i.e. absence of perception of the tastant compared to water. Data are represented as mean ± SEM; Mann & Whitney test used for all panels. N = 8–15 control mice and 6–13 mutant mice per time point.

Similar articles

Cited by

References

    1. Bachmanov AA, Beauchamp GK. Taste receptor genes. Annu Rev Nutr. 2007;27(1):389–414. 10.1146/annurev.nutr.26.061505.111329 - DOI - PMC - PubMed
    1. Hoon MA, Adler E, Lindemeier J, Battey JF, Ryba NJ, Zuker CS. Putative mammalian taste receptors: a class of taste-specific GPCRs with distinct topographic selectivity. Cell. 1999;96(4):541–51. 10.1016/S0092-8674(00)80658-3. . - DOI - PubMed
    1. Ninomiya Y, Kajiura H, Mochizuki K. Differential taste responses of mouse chorda tympani and glossopharyngeal nerves to sugars and amino acids. Neuroscience letters. 1993;163(2):197–200. . - PubMed
    1. Ninomiya Y, Funakoshi M. Peripheral neural basis for behavioural discrimination between glutamate and the four basic taste substances in mice. Comparative Biochemistry and Physiology Part A: Physiology. 1989;92(3):371–6. - PubMed
    1. Shingai T, Beidler LM. Response characteristics of three taste nerves in mice. Brain Res. 1985;335(2):245–9. 10.1016/0006-8993(85)90476-7. . - DOI - PubMed