. 2017 Sep 7;549(7670):54-59.
doi: 10.1038/nature23482. Epub 2017 Aug 23.

A heterochromatin-dependent transcription machinery drives piRNA expression

Affiliations

A heterochromatin-dependent transcription machinery drives piRNA expression

Peter Refsing Andersen et al. Nature. .

Abstract

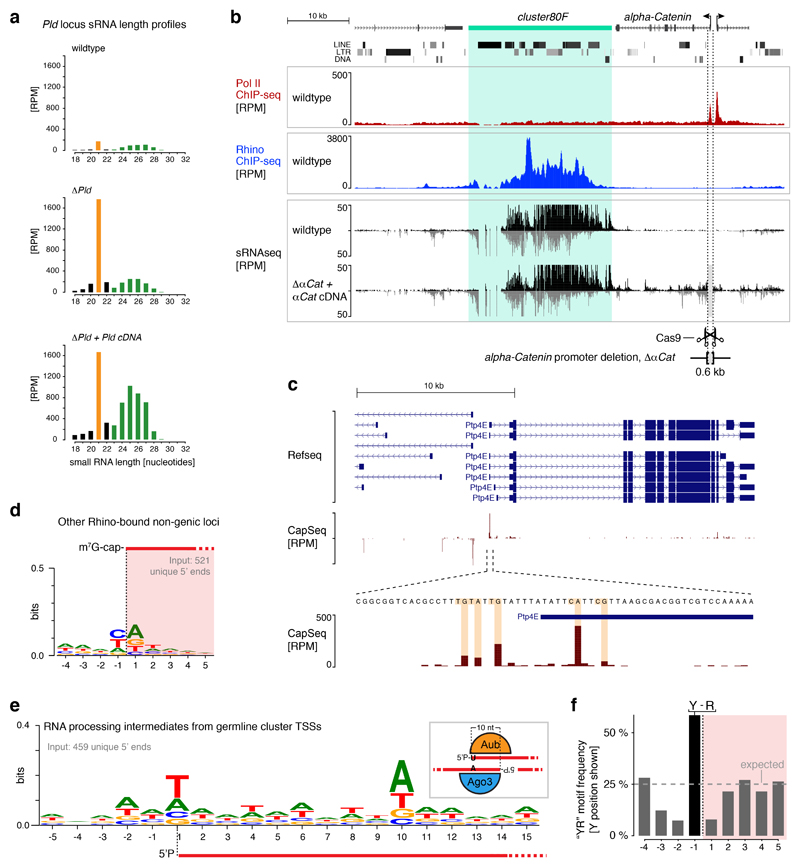
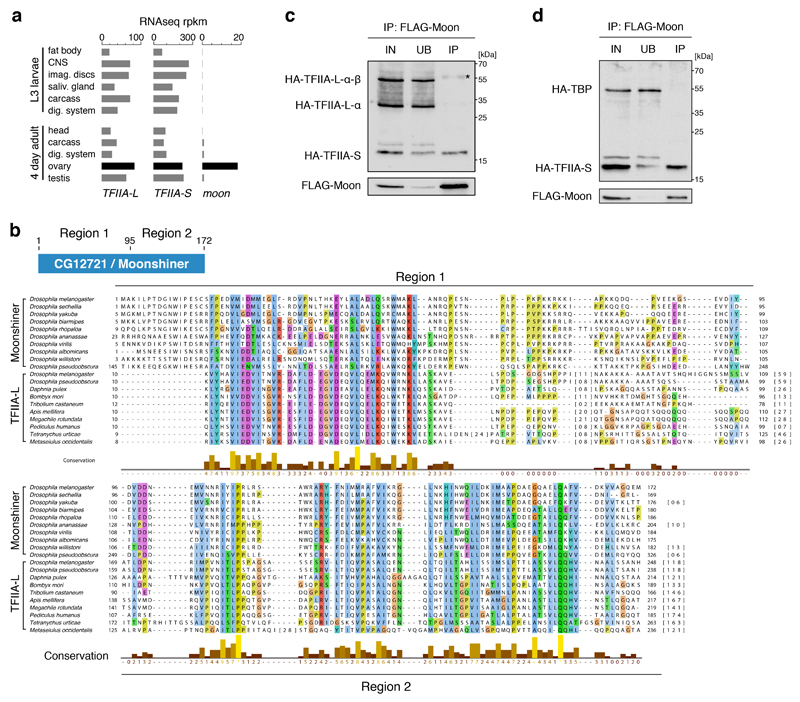
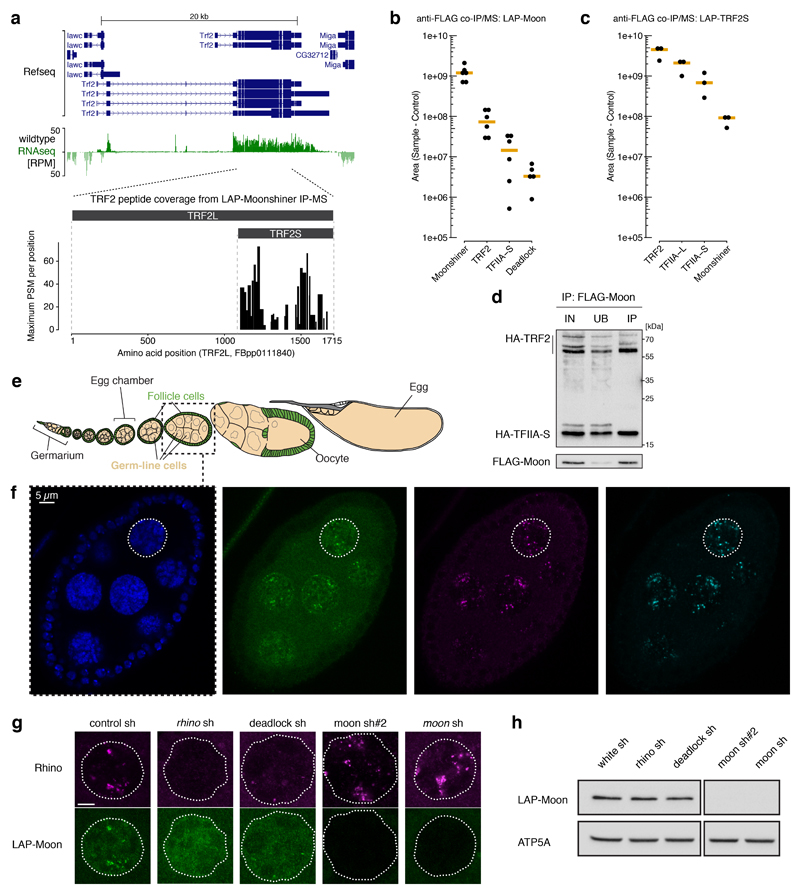
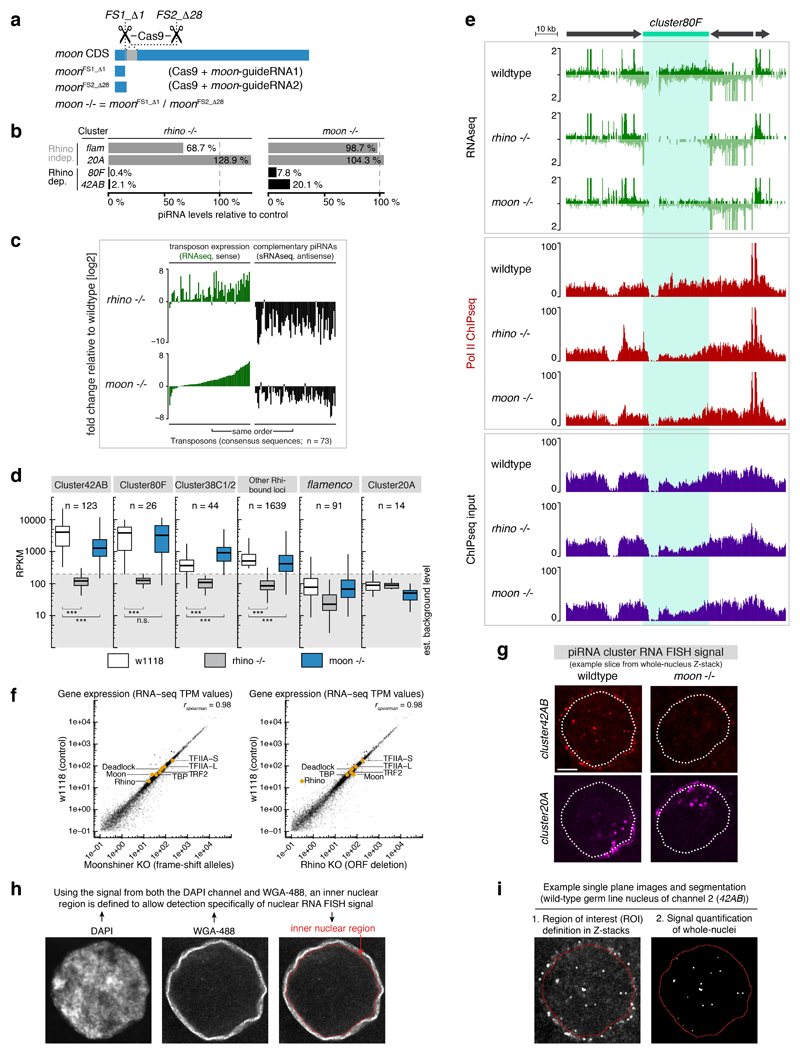
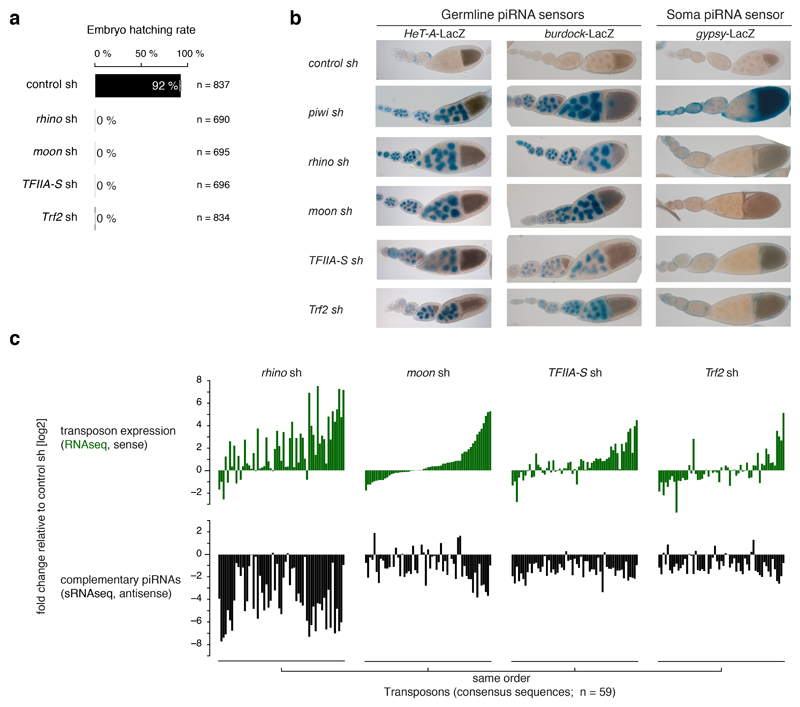
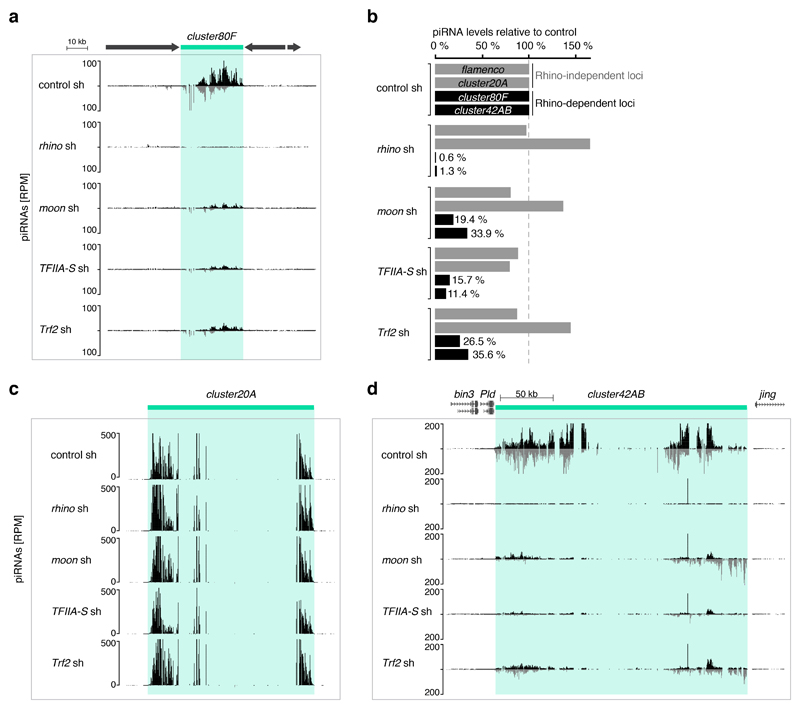
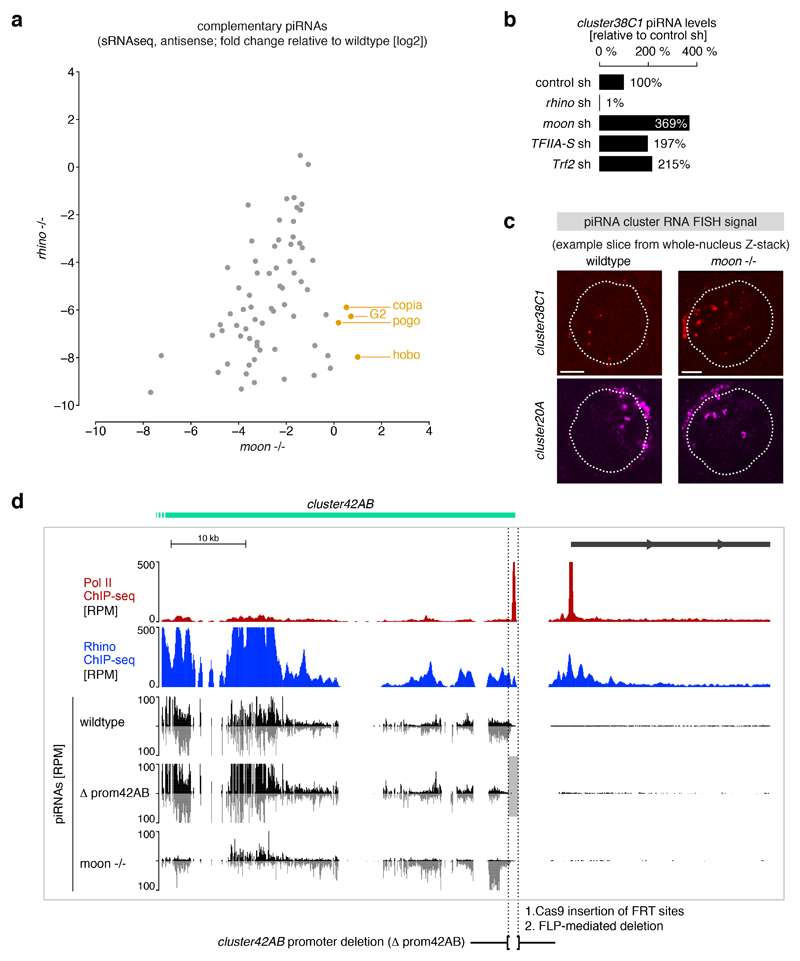
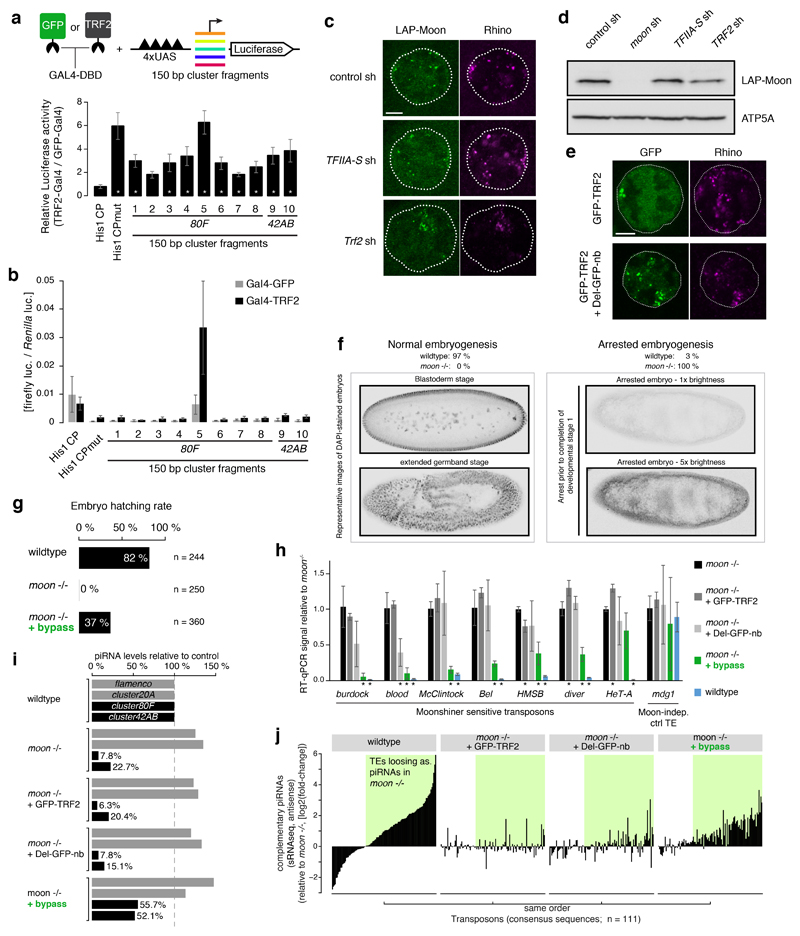
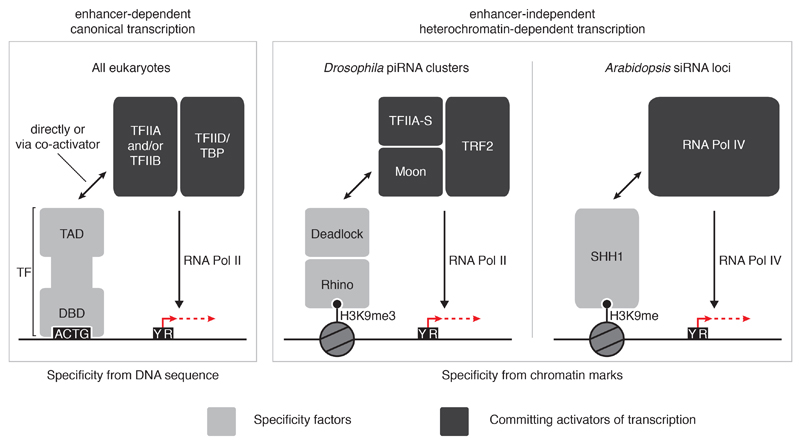
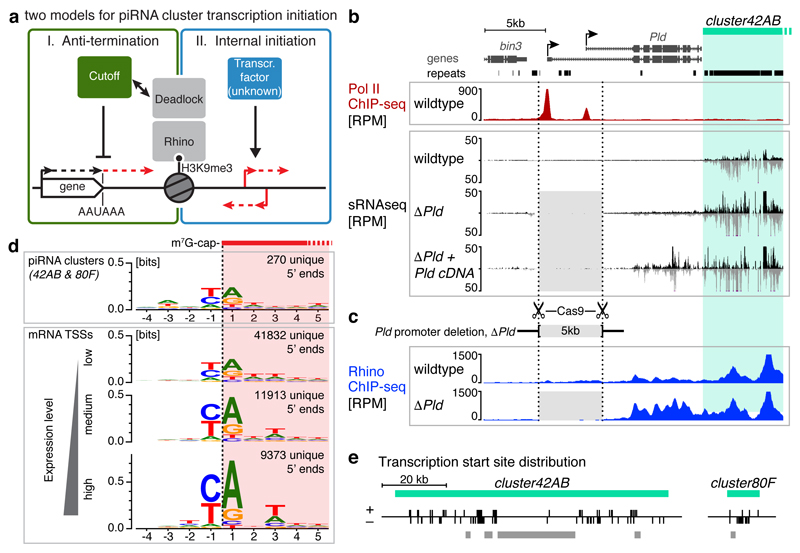
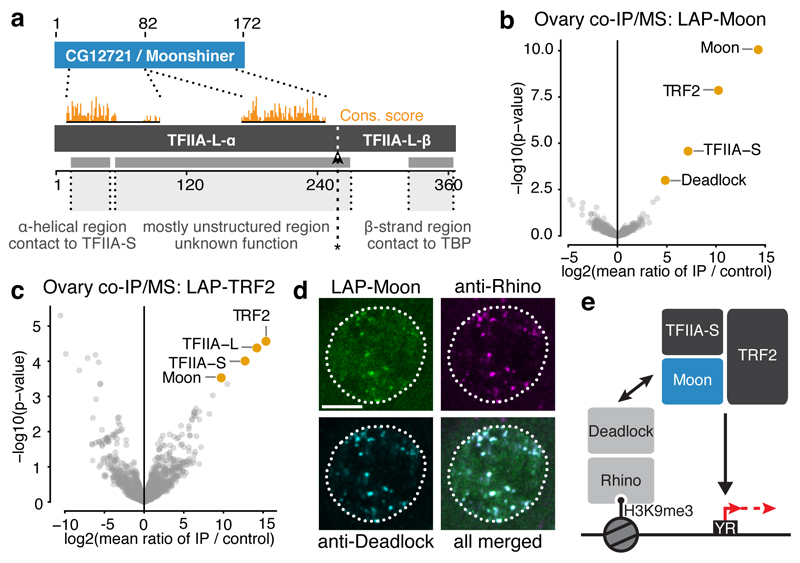
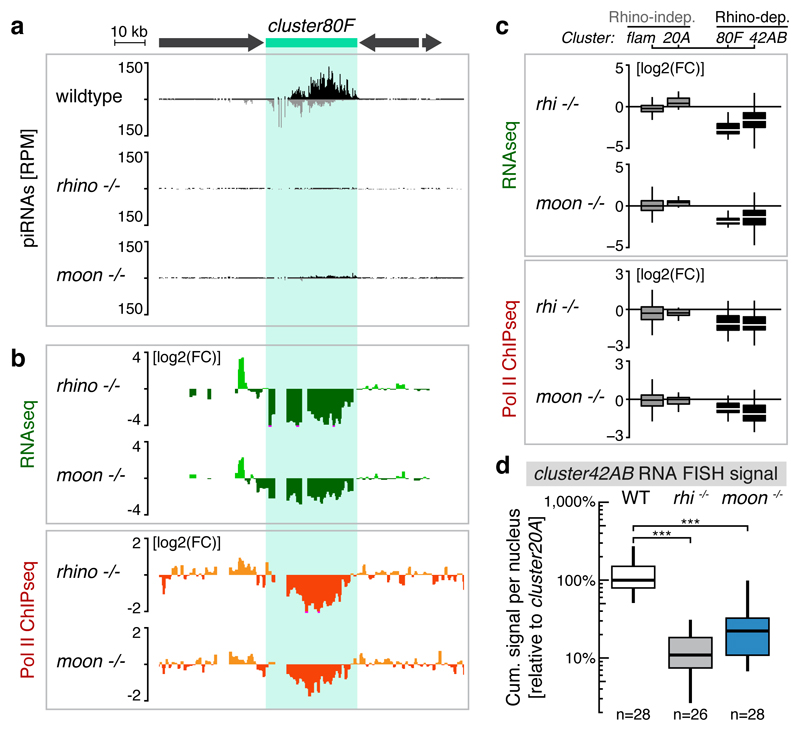
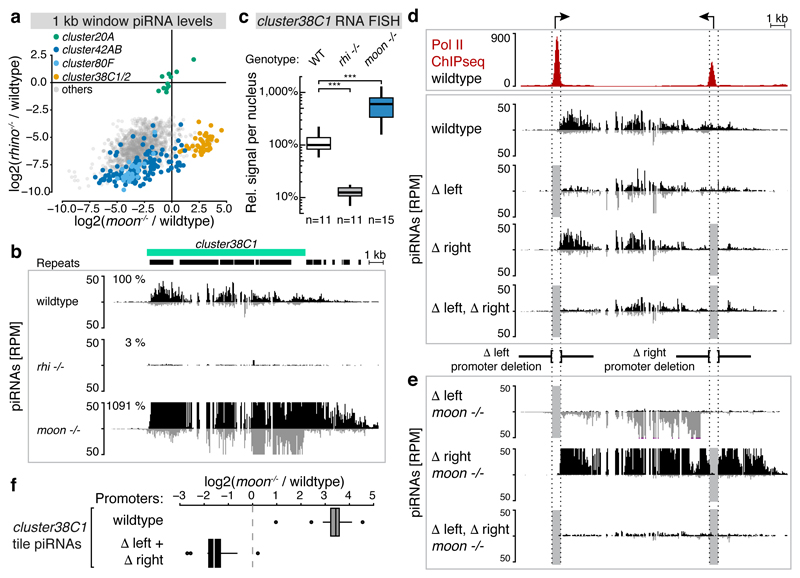
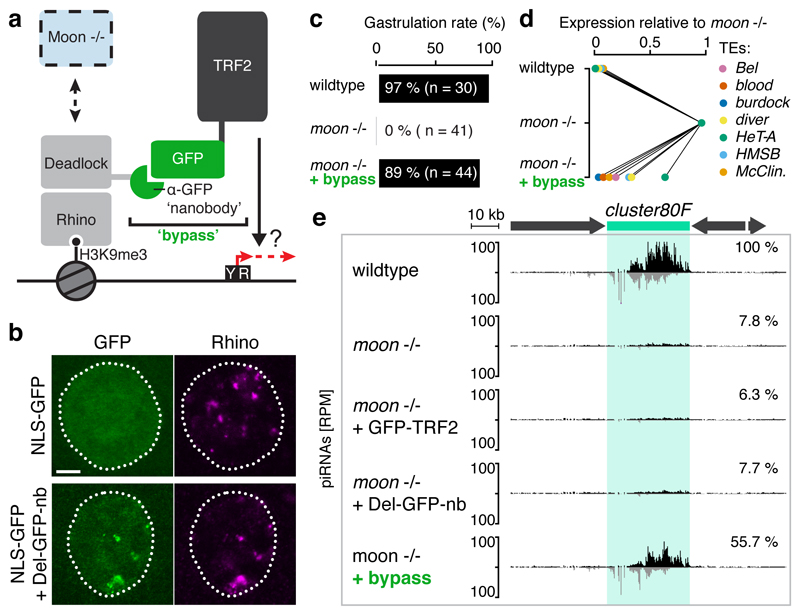
Nuclear small RNA pathways safeguard genome integrity by establishing transcription-repressing heterochromatin at transposable elements. This inevitably also targets the transposon-rich source loci of the small RNAs themselves. How small RNA source loci are efficiently transcribed while transposon promoters are potently silenced is not understood. Here we show that, in Drosophila, transcription of PIWI-interacting RNA (piRNA) clusters-small RNA source loci in animal gonads-is enforced through RNA polymerase II pre-initiation complex formation within repressive heterochromatin. This is accomplished through Moonshiner, a paralogue of a basal transcription factor IIA (TFIIA) subunit, which is recruited to piRNA clusters via the heterochromatin protein-1 variant Rhino. Moonshiner triggers transcription initiation within piRNA clusters by recruiting the TATA-box binding protein (TBP)-related factor TRF2, an animal TFIID core variant. Thus, transcription of heterochromatic small RNA source loci relies on direct recruitment of the core transcriptional machinery to DNA via histone marks rather than sequence motifs, a concept that we argue is a recurring theme in evolution.


Conflict of interest statement

Competing financial interests

The authors declare no competing financial interests

Figures

Extended Data Figure 1
Extended Data Figure 1. Characterization of transcription initiation events at piRNA clusters.
a, Size profile histograms of small RNAs mapping to the Pld gene locus from ovaries with indicated genotypes. siRNAs (21 nt) are highlighted in orange and piRNAs (23-29 nt) are highlighted in green. b, UCSC genome browser panels showing cluster80F for which flanking promoter dependency was investigated by deletion of the promoter region of alpha-Catenin. Shown are Pol II occupancy (red), Rhino occupancy (blue) and piRNA levels (black/grey). Flanking transcription units are shown in grey, light grey shading indicates the experimental promoter deletion. As alpha-Catenin is an essential gene, a cDNA rescue transgene was expressed from another locus. c, UCSC genome browser panels showing the CapSeq profile at the promoter of a canonical gene. d, DNA sequence motif at 5' ends of capped RNAs mapping to Rhino-bound genomic loci (Rhino ChIPseq RPKM > 300; cluster80F and 42AB excluded) outside of known transcription units. e, DNA sequence motif at 5' ends of 5'-monophosphorylated RNAs mapping to cluster42AB or cluster80F. The schematic to the right shows how the ‘ping-pong’ amplification loop involving Aub and Ago3-mediated cleavages gives rise to the observed sequence biases at position +1 and +10. f, Histogram of the ‘YR’ dinucleotide occurrence around cluster42AB and cluster80F transcription start sites (expected chance occurrence: 25%).
Extended Data Figure 2
Extended Data Figure 2. CG12721/Moonshiner is a germline-specific TFIIA-L paralog.
a, Expression levels of indicated genes in larval/adult tissues based on modENCODE RNAseq data. RPKM: reads per kilobase per million mappers. b, The top schematic denotes the two regions of homology shown in Fig. 2a. Shown below is the amino acid sequence alignment of these two regions from Drosophilid species (Moonshiner) and selected insect species (TFIIA-L). The alignment was created using JalView with standard ClustalX color coding and conservation score calculation. c-d, Western blot analyses of FLAG-Moonshiner co-immunoprecipitation from lysates of S2 cells transfected with indicated expression constructs (IN: input; UB: unbound; IP: immunoprecipitate; asterisk indicates signal from anti-FLAG heavy chain).
Extended Data Figure 3
Extended Data Figure 3. Moonshiner forms an alternative TFIIA-TRF2 complex enriched at piRNA clusters.
a, TRF2 isoform characterization by total wildtype ovary RNAseq (top panel) and LAP-Moon co-IP mass spectrometry (lower panel). The identified TRF2 peptides show that Moonshiner is in complex only with the shorter TRF2 isoform. We therefore investigated specifically this isoform, also known as TRF2S, in the remainder of the paper. b-c, Absolute peptide peak intensities for the main protein interactors identified in Fig. 2b,c. Peak area intensities are displayed as IP values subtracted that of the paired control IP experiment. Based on this, we conclude that TFIIA-S and TRF2 are robust Moonshiner interactors (supportive of an alternative TFIIA-TRF2 complex), while only a small fraction of Moonshiner is bound to Deadlock. Furthermore, the data show that in ovaries, TRF2 interacts predominantly with canonical TFIIA, but also clearly with Moonshiner. Black dots represent individual replicate values. Orange bars show median values. d, Western blot analyses as Extended Data Fig. 2d, but addressing interaction with HA-TRF2 (lower bands likely represent TRF2 decay intermediates). e, Schematic of a developing Drosophila ovariole with germline cells in beige and somatic support cells in green. Confocal images were typically taken from egg-chambers of stage 7 (highlighted by a dashed box). f, Whole egg chamber confocal image stained for DNA (DAPI; blue), LAP-Moonshiner (GFP auto-fluorescence; green), Rhino (magenta), and Deadlock (cyan). The circled nucleus is shown in Fig. 2d. g, Fluorescence images of nurse cell nuclei (depleted for indicated factors using sh-lines) indicating levels and localization of Moonshiner and Rhino (scale bar: 5 µM). h, Western blot showing levels of LAP-Moonshiner in ovaries where the indicated factors were depleted in the germline via sh-lines (ATP synthase serves as loading control).
Extended Data Figure 4
Extended Data Figure 4. Moonshiner mutants reveal highly specific function at Rhino-bound piRNA clusters.
a, Schematic of the moonshiner frameshift alleles generated by CRISPR/Cas9. b, piRNA levels from ovaries with indicated genotype (relative to wildtype) mapping uniquely to indicated piRNA clusters. c, Left panels indicate the deregulation of steady state transposon transcript levels (RNAseq; sense only) in ovaries of the indicated mutants fly strains. The right panels show changes in corresponding piRNA levels (antisense only). The y-axis values show log2 fold-change of TPM (Transcripts Per Million) values relative to wildtype. Each bar represents one transposon consensus sequence (n=73; shown are only transposons with minimum expression of RNAseq TPM > 5 in any library). Sorting of transposons in all panels is identical. The plotted values are available as figure source data. d, Rhino occupancy at indicated major piRNA clusters as well as all other Rhino-bound loci is shown as boxplot quantification (n = 1kb windows analyzed for each group) of Rhino ChIPseq read coverage in the indicated genotypes. Boxplots are defined as in Fig. 3c; *** : p value < 0.0001 based on Mann-Whitney-Wilcoxon non-parametric tests). e, Genome browser panel showing read coverage at cluster80F of the data underlying the log2 fold-change tracks shown in Fig. 3b. Shown are RNAseq (green), Pol II ChIPseq (red) and ChIPseq input samples (purple) generated from the indicated genotypes. f, RNAseq TPM values for canonical genes compared between control and moonshiner-/- (left panel) or rhino-/- (right panel); key genes related to Moonshiner biology are highlighted in orange. g, Representative confocal images underlying the quantitative RNA FISH-based detection of piRNA precursors from cluster20A (Rhino-independent) and cluster42AB (Rhino-dependent) in germline nuclei of wildtype and moonshiner mutant ovaries. h, Example confocal images of germline nuclei stained for of DNA (DAPI) and nuclear pore complexes (wheat germ agglutinin, WGA-488), which were used to define the nuclear region in whole-nucleus Z-stack images acquired in parallel with images of RNA FISH signal. i, Example single plane images of dual-channel RNA FISH quantification of whole germline nuclei. RNA FISH signal within the nuclear regions (left panels, segmented using DAPI and WGA-488 signal) was used to define regions of interest (ROIs, right panels), representing active sites of piRNA cluster transcription. Signal in the foci was subsequently quantified for whole nuclei.
Extended Data Figure 5
Extended Data Figure 5. Depletion of Moonshiner, TFIIA-S, or Trf2 activates transposon expression.
a, Percentages of eggs hatching into larvae laid by females expressing sh-constructs against the indicated target genes in their germline cells. Error bars indicate standard error of the mean from four independent countings while n represent the sum of counted eggs (see also figure source data). b, Ovarioles from flies expressing indicated piRNA sensors and indicated germline knockdown constructs (sh-lines) stained for beta-Galactosidase with X-gal. c, Upper panels indicate the deregulation of steady state transposon transcript levels (sense only; compared to control ovaries) in ovaries expressing the indicated germline knockdown constructs. Each bar represents one transposon consensus sequence (n=59; shown are only transposons with minimum expression of RNAseq TPM > 5 in any library). Lower panels show changes in corresponding piRNA levels (antisense only). Sorting of transposons in all panels is identical. For plotted values see figure source data.
Extended Data Figure 6
Extended Data Figure 6. piRNA production from Rhino-bound clusters requires Moonshiner, TFIIA-S, and Trf2.
a, UCSC genome browser panel showing piRNA profiles at cluster80F in ovaries expressing indicated germline knockdown constructs. b, Levels of piRNAs (relative to control) mapping uniquely to indicated Rhino-dependent or Rhino-independent piRNA clusters and derived from ovaries depleted of the indicated factors. c-d, UCSC genome browser panel showing cluster20A (c) or cluster42AB (d) piRNA levels from ovaries expressing indicated germline knockdown constructs.
Extended Data Figure 7
Extended Data Figure 7. Characterization of Rhino-dependent, but Moonshiner-independent piRNA production.
a, Log2 fold-changes in levels of piRNAs mapping antisense to transposons are plotted for rhino mutants versus moonshiner mutants. An outlier group of transposons for which the level of antisense piRNAs is decreased in rhino mutants, but increased in moonshiner mutants is apparent and elements enriched in cluster38C1/2 are highlighted in orange. The same transposons are shown as in Extended Data Fig. 4c (n=73). b, Quantification of relative piRNA levels originating from cluster38C1 in ovaries from flies subjected to the indicated germline knockdowns. Percentages relative to control knockdowns were calculated with the total numbers of piRNA reads mapping uniquely to cluster38C1. c, Representative confocal images underlying the quantitative RNA FISH-based detection of piRNA precursors from cluster20A (Rhino-independent) and cluster38C1 (Rhino-dependent) in germline nuclei of wildtype and moonshiner mutant ovaries. d, UCSC genome browser panel showing the most distal part of cluster42AB for which piRNA production dependency on the right flanking promoter was investigated by deletion of the promoter region. Shown are Pol II occupancy (red), Rhino occupancy (blue), and piRNA levels (black/grey). Flanking transcription units are shown in grey, light grey shading indicates the experimental promoter deletion.
Extended Data Figure 8
Extended Data Figure 8. Moonshiner function can be bypassed by directly connecting Deadlock to Trf2.
a, Experimental scheme used to recruit GFP or TRF2 to DNA upstream of sequences of interest to test for stimulation of Luciferase transcription. Bar diagram shows fold changes in reporter activity upon tethering of TRF2 versus GFP to wildtype or mutant Histone 1 core promoter or to random piRNA cluster fragments (error bars: standard error; n=5; *: p value < 0.05 based on two-tailed paired t-tests). b, Firefly luciferase values underlying the relative activities shown in a. Firefly luciferase activity was normalized to Renilla luciferase activity (transfection and viability control) upon tethering of TRF2 versus GFP to wildtype or mutant Histone 1 core promoter or to ten random piRNA cluster fragments (error bars indicate standard deviation (SD) of 5 biological replicates with each 6 technical replicates. c, Confocal images showing localization of LAP-Moonshiner and Rhino in germline nuclei of ovaries depleted for indicated factors (scale bar: 5 µM). d, Western blot showing levels of LAP-Moonshiner in ovaries where the indicated factors were depleted in the germline via sh-lines (ATP synthase serves as loading control). e, Confocal images showing localization of germline-expressed LAP-TRF2 and endogenous Rhino in control ovaries (top) or in ovaries expressing the Deadlock:GFP-nanobody fusion protein (scale bar: 5 µM). The TRF2 accumulations in wildtype nuclei do not overlap with Rhino-foci and instead are reported to be TRF2 accumulations at the repetitive histone loci. We note that TRF2 accumulation at Rhino foci is not visible in wildtype cells, most likely as the levels of this protein are too high to detect this local enrichment, that depends on Moonshiner (a protein expressed at only low levels). f, Representative images of DAPI-stained embryos (inverted monochromatic) assessed for progress of early embryogenesis. The left panels show two images of normal embryo development at the blastoderm stage (upper image) and at the extended germband stage (after gastrulation; lower image). The right panels show a typical moonshiner mutant embryo arrested early in development (no distinct nuclei are visible; the lower image displays the top image at increased brightness). g, Percentages of embryos with the indicated genotype displaying successful hatching. h, Relative levels of steady state transposon mRNAs that are underlying the panel displayed in Fig. 5d. Bars show mean levels relative to those measured in moon-/- samples. Error bars display standard deviation values of three biological replicates and * denotes a p value of < 0.05 from two-tailed t-tests for difference to moonshiner full mutant samples. i, Levels of piRNAs mapping uniquely to the indicated clusters (grey: Rhino-independent; black: Rhino-dependent) in the indicated genotypes (values are normalized to the wildtype control levels). j, Log2 fold-changes in levels of piRNAs mapping antisense to transposons are plotted relative to levels in moonshiner mutants. The green boxes highlight the set of transposons for which mutation of moonshiner results in decreased antisense piRNAs (n=111; transposons with fewer then 100 antisense piRNAs per million were removed from the analyses).
Extended Data Figure 9
Extended Data Figure 9. Comparison of canonical enhancer-dependent and heterochromatin-dependent transcription activation pathways.
Schematic comparison of canonical (enhancer-dependent) transcription and transcription of small RNA source loci in Drosophila and Arabidopsis specified by chromatin marks (enhancer-independent). Canonical transcription initiation is driven by sequence-specific transcription factor binding to DNA motifs in accessible enhancer and promoter regions, which subsequently leads to positioning of TFIID/TBP onto core promoters (left panel). In contrast, while Moonshiner-mediated transcription also converges on recruitment of TFIID to DNA, this pathway exclusively utilizes the TBP paralog TRF2. Furthermore, Moonshiner-mediated transcription gains locus specificity via recognition of heterochromatic histone marks via the HP1 protein Rhino, rather than through DNA motifs, thereby circumventing the transcriptional inhibition imposed by the compact state of heterochromatic DNA (middle panel). In plants, a conceptually similar pathway has evolved using an entirely different set of proteins (right panel). Here, the homeodomain protein SHH1 binds H3K9me histone marks and subsequently recruits the Pol IV variant RNA polymerase complex to transcribe small RNA precursors.
Figure 1
Figure 1. Heterochromatic piRNA source loci utilize internal transcription initiation sites.
a, Two models for transcription initiation at Rhino-dependent piRNA source loci: read-through from flanking genes aided by Cutoff (left) or internal initiation (right). b-c, Genome browser panels showing investigation of flanking promoter dependency for the centromere-proximal part of cluster42AB. Shown are piRNA levels, Rhino occupancy, and Pol II occupancy. Light grey shading indicates the promoter deletion. d, DNA sequence motif at 5' ends of capped cluster42AB- and cluster80F-derived RNAs compared to that of mRNA 5' ends (binned by expression strength). e, Distribution of transcription start sites with ‘YR’-motif inside cluster42AB/80F (grey bars: regions with low mappability).
Figure 2
Figure 2. The TFIIA-L paralog Moonshiner localizes to Rhino domains and forms an alternative TFIIA-TRF2 complex.
a, Schematic alignment showing homology between CG12721/Moonshiner and TFIIA-L; Orange bars: conservation score (see Extended Data Fig. 2b). Also shown are TFIIA-L parts with known interaction partners and the Taspase1 cleavage site (asterisk). b-c, Volcano plots showing enrichment values and corresponding significance levels for proteins co-purifying with LAP-Moonshiner (n=6) or LAP-TRF2 (n=3) from ovary lysates (four most significantly enriched proteins are labeled). d, Localization of LAP-Moonshiner, Rhino and Deadlock within an ovarian germline nucleus (see also Extended Data Fig. 3f). e, Model summarizing the identified protein interactions in the context of Rhino-dependent piRNA cluster transcription.
Figure 3
Figure 3. Rhino-bound piRNA clusters require Moonshiner for their efficient transcription.
a, Genome browser panel showing cluster80F piRNA levels from ovaries with indicated genotype. b, piRNA precursor abundance (RNAseq) and Pol II occupancy (ChIPseq) at cluster80F in wildtype ovaries and the corresponding changes in rhino or moonshiner mutant ovaries (log2 fold change calculated for 1 kb windows). c, Boxplots showing piRNA precursor abundance (top panel) and Pol II occupancy (lower panel) for indicated piRNA clusters in rhino or moonshiner mutant ovaries relative to wildtype (log2 fold-change of 1 kb windows; box plots display median (line), first and third quartiles (box) and highest/lowest value within 1.5*inner quartile range (whiskers)). d, Quantification of cluster42AB RNA FISH signal in germline nuclei of ovaries with indicated genotype relative to that of cluster20A (boxplots as in c; ***: p value <0.0001; Mann-Whitney-Wilcoxon tests).
Figure 4
Figure 4. Endogenous piRNA cluster promoters bypass Moonshiner-dependent transcription initiation.
a, Fold changes (log2) of piRNAs mapping uniquely to Rhino-dependent genomic 1kb tiles in rhino versus moonshiner mutants (relative to wildtype). Tiles from major piRNA clusters are colored (cluster20A tiles serve as Rhino-independent control group). b, Genome browser panel showing cluster38C1 piRNA levels from ovaries with indicated genotype. c, Quantification of cluster38C1 RNA FISH signal in germline nuclei relative to that of cluster20A (***: p value < 0.0001; Mann-Whitney-Wilcoxon tests; boxplots as in Fig. 3c). d, Pol II occupancy and piRNA levels at cluster38C1 in ovaries with indicated genotypes. Δleft and Δright indicate cluster38C1 promoter deletions (light grey boxes). e, as d, but from moonshiner mutant ovaries. f, Boxplot (defined as in Fig. 3c) displaying log2(fold changes) in cluster38C1 piRNA levels (n=12 1kb windows) in moonshiner mutant compared to wildtype ovaries when both cluster38C1 promoters are wildtype or deleted.
Figure 5
Figure 5. Moonshiner stimulates heterochromatic transcription by recruiting TRF2 to Rhino domains.
a, Schematic of the bypass experiment where GFP-TRF2 is recruited directly to Rhino-domains via a Deadlock:GFP-nanobody fusion protein. b, Localization of NLS-GFP and Rhino in control (top) or in germline nuclei expressing the Deadlock:GFP-nanobody fusion protein (bottom); scale bar: 5 µM. c, Percentages of embryos with the indicated genotype displaying successful gastrulation; see also Extended Data Fig. 8f. d, Steady state levels of transposon mRNAs in ovaries with indicated genotype relative to their level in moonshiner mutants (average of 3 biological replicates; for details see Extended Data Fig. 8h). e, cluster80F piRNA profiles in ovaries with indicated genotype.

Comment in

References

    1. Fedoroff NV. Transposable Elements, Epigenetics, and Genome Evolution. Science. 2012;338:758–767. - PubMed
    1. Castel SE, Martienssen RA. RNA interference in the nucleus:roles for small RNAs in transcription,epigenetics and beyond. Nat Rev Genet. 2013;14:100–112. - PMC - PubMed
    1. Holoch D, Moazed D. RNA-mediated epigenetic regulation of gene expression. Nat Rev Genet. 2015;16:71–84. - PMC - PubMed
    1. Siomi MC, Sato K, Pezic D, Aravin AA. PIWI-interacting small RNAs: the vanguard of genome defence. Nature reviews Molecular cell biology. 2011;12:246–258. - PubMed
    1. Czech B, Hannon GJ. One Loop to Rule Them All: The Ping-Pong Cycle and piRNA-Guided Silencing. Trends in Biochemical Sciences. 2016;41:324–337. - PMC - PubMed

Publication types

MeSH terms