. 2017 Aug 31;548(7669):602-606.
doi: 10.1038/nature23665. Epub 2017 Aug 23.

Homeostatic control of metabolic and functional fitness of Treg cells by LKB1 signalling

Affiliations

Homeostatic control of metabolic and functional fitness of Treg cells by LKB1 signalling

Kai Yang et al. Nature. .

Abstract

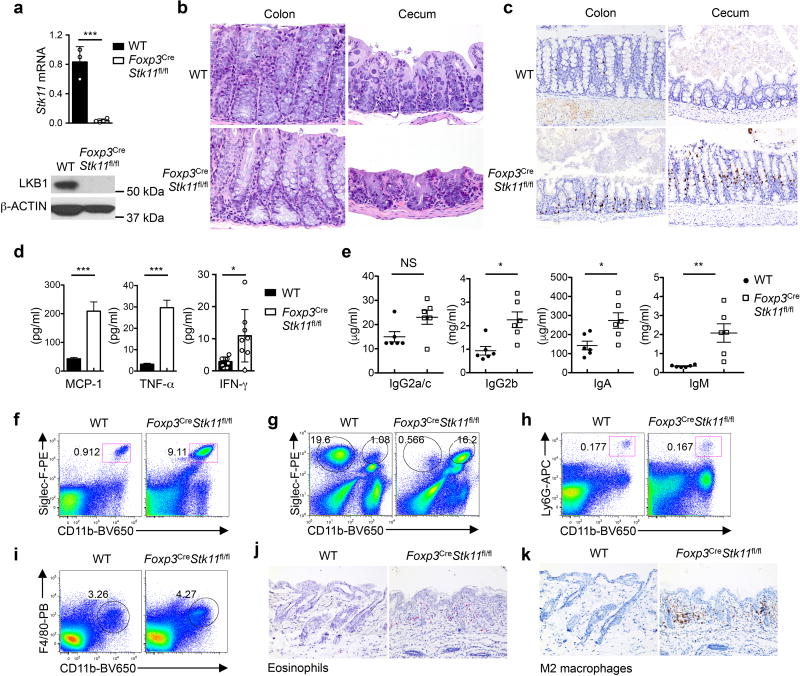
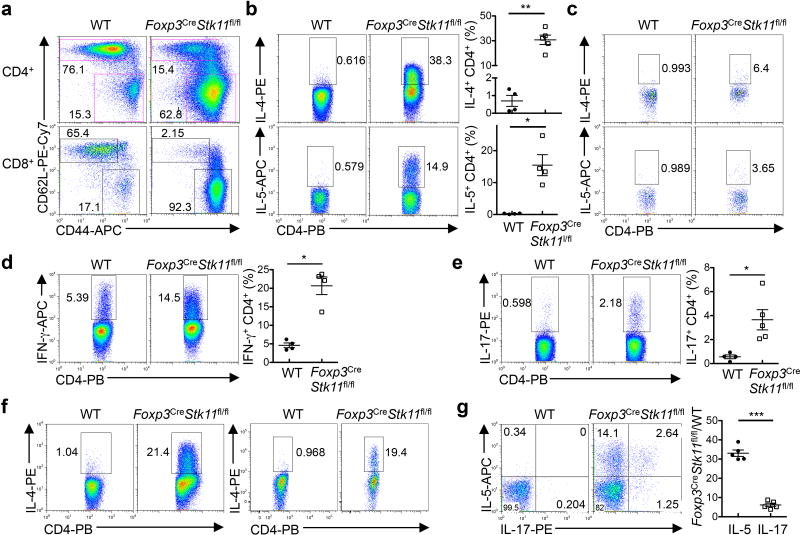
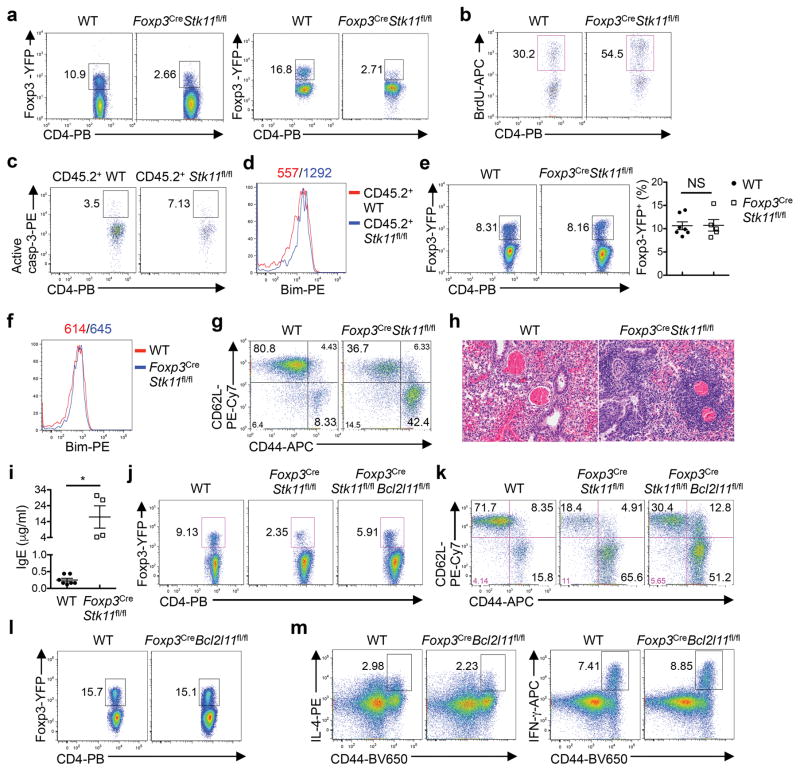
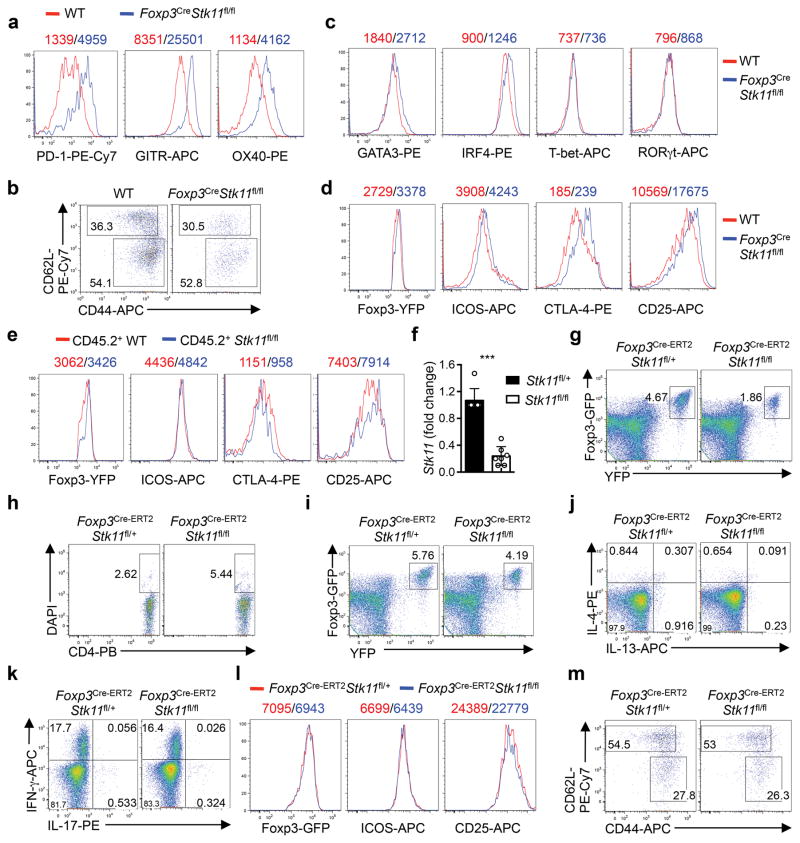
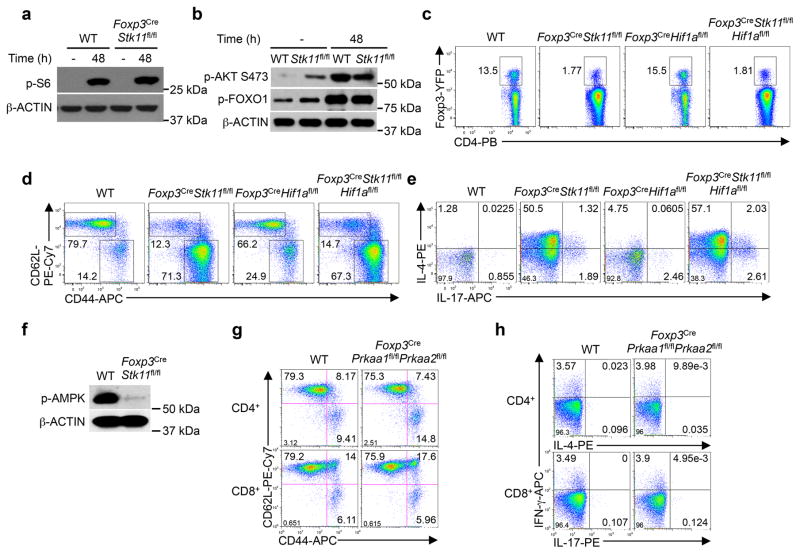
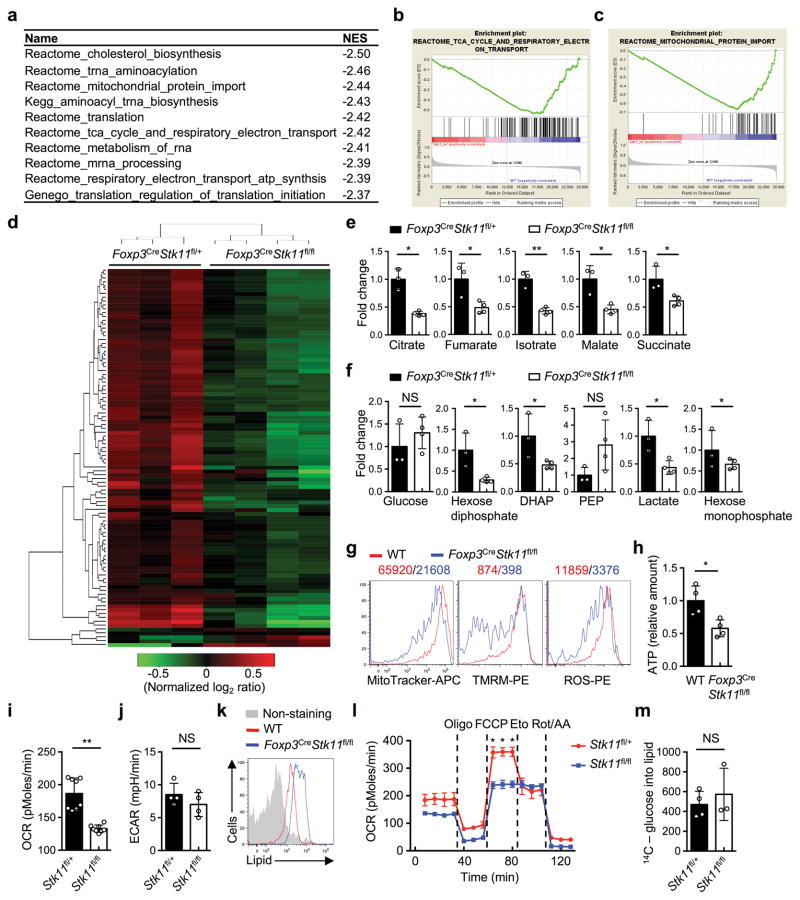
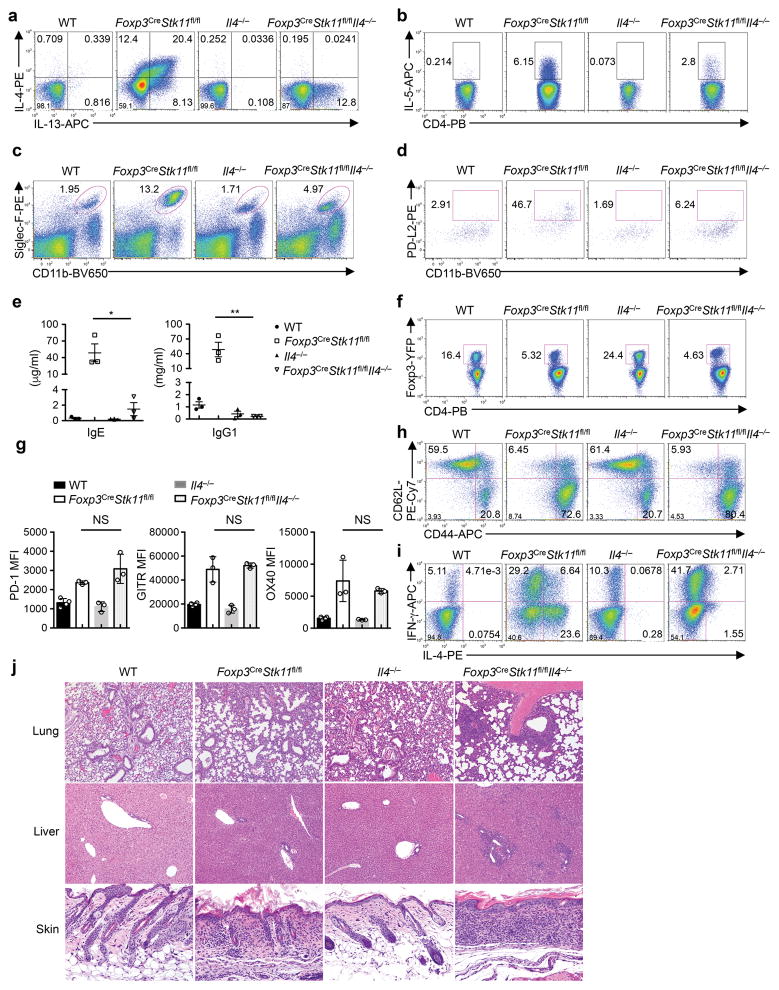
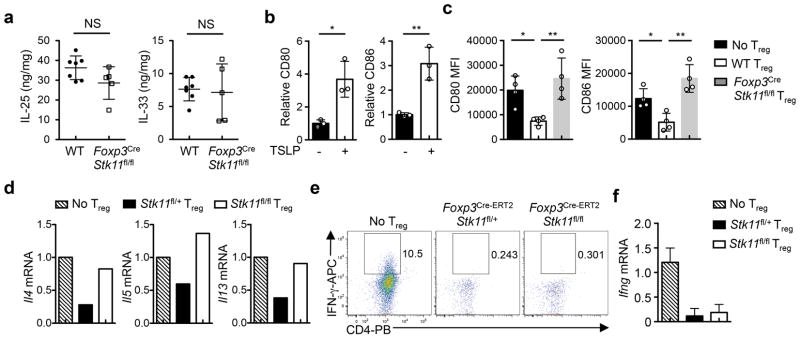
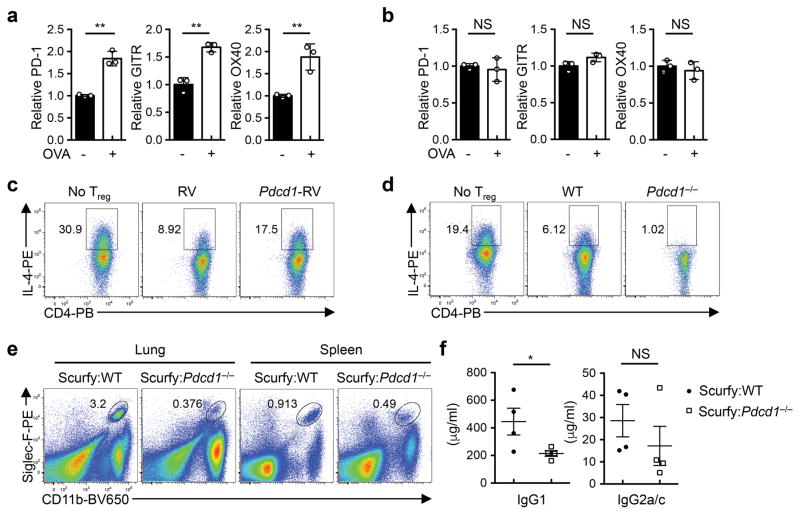
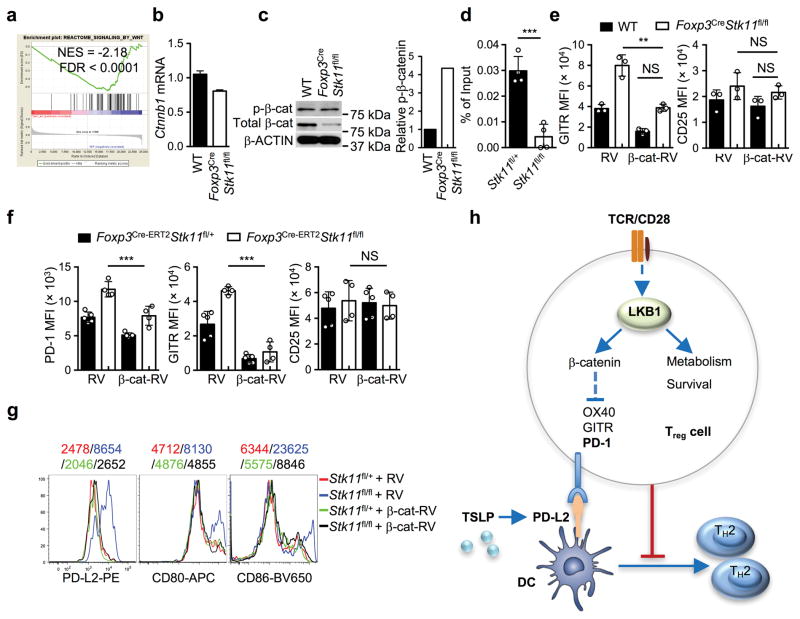
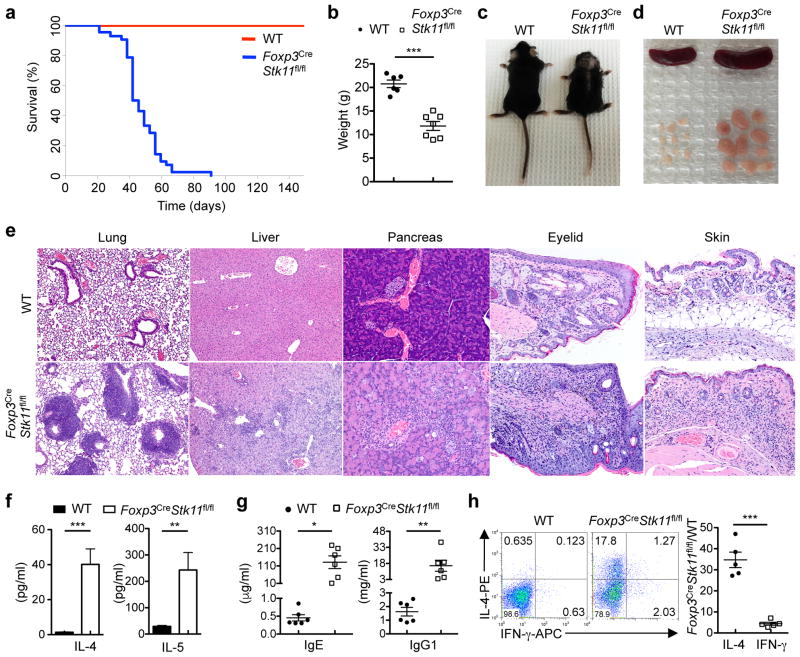
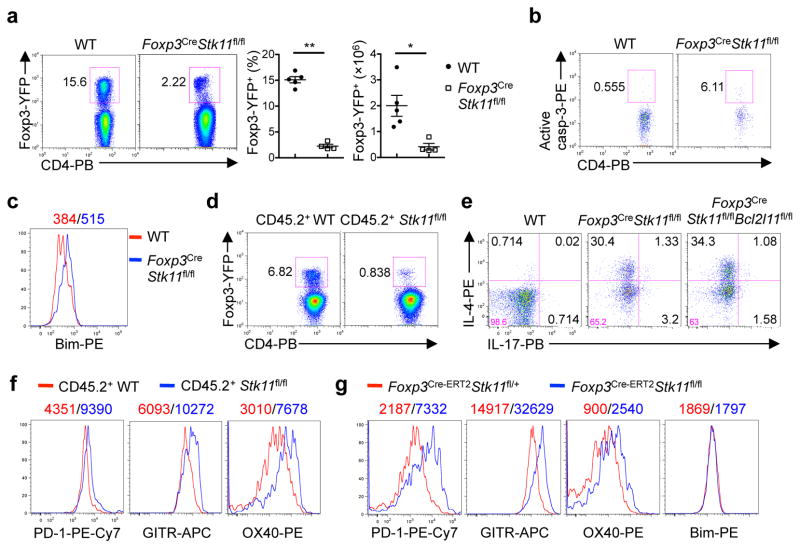
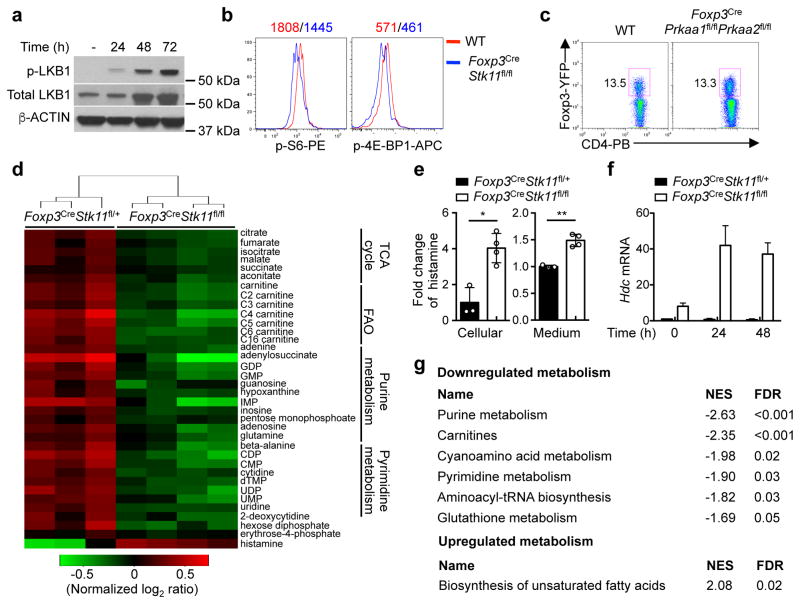
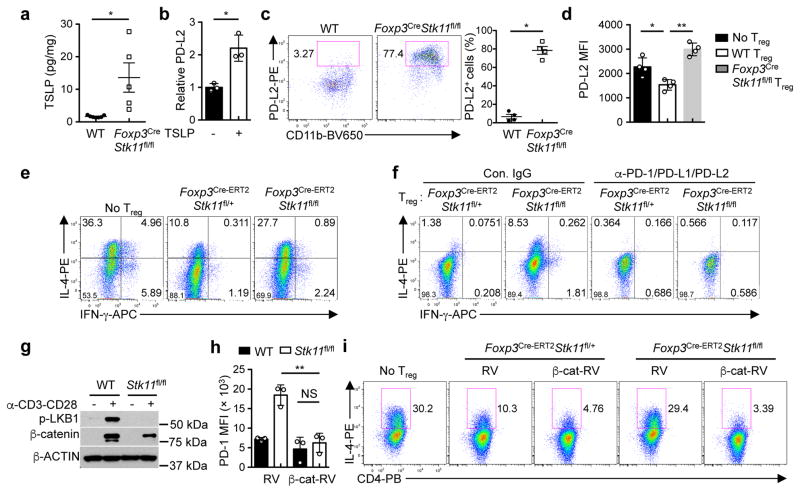
Regulatory T cells (Treg cells) have a pivotal role in the establishment and maintenance of immunological self-tolerance and homeostasis. Transcriptional programming of regulatory mechanisms facilitates the functional activation of Treg cells in the prevention of diverse types of inflammatory responses. It remains unclear how Treg cells orchestrate their homeostasis and interplay with environmental signals. Here we show that liver kinase B1 (LKB1) programs the metabolic and functional fitness of Treg cells in the control of immune tolerance and homeostasis. Mice with a Treg-specific deletion of LKB1 developed a fatal inflammatory disease characterized by excessive TH2-type-dominant responses. LKB1 deficiency disrupted Treg cell survival and mitochondrial fitness and metabolism, but also induced aberrant expression of immune regulatory molecules including the negative co-receptor PD-1 and the TNF receptor superfamily proteins GITR and OX40. Unexpectedly, LKB1 function in Treg cells was independent of conventional AMPK signalling or the mTORC1-HIF-1α axis, but contributed to the activation of β-catenin signalling for the control of PD-1 and TNF receptor proteins. Blockade of PD-1 activity reinvigorated the ability of LKB1-deficient Treg cells to suppress TH2 responses and the interplay with dendritic cells primed by thymic stromal lymphopoietin. Thus, Treg cells use LKB1 signalling to coordinate their metabolic and immunological homeostasis and to prevent apoptotic and functional exhaustion, thereby orchestrating the balance between immunity and tolerance.


Conflict of interest statement

The authors declare no competing financial interests.

Figures

Extended Data Figure 1
Extended Data Figure 1. Disrupted immune homeostasis in Foxp3CreStk11fl/fl mice
a, Expression of Stk11 mRNA and LKB1 protein in CD4+YFP+ T cells (Treg cells) from WT and Foxp3CreStk11fl/fl mice. b, Representative images of hematoxylin and eosin staining of colon (original magnification, ×20) and cecum (×10) from WT and Foxp3CreStk11fl/fl mice. c, Representative images of MCPT1 (mast cell protease 1) staining of colon (original magnification, ×20) and cecum (×20) from WT and Foxp3CreStk11fl/fl mice. MCPT1 (brown) labels the interepithelial mucosal mast cells (ieMMCs). d, Quantification of serum MCP-1 (WT n = 10; Foxp3CreStk11fl/fl n = 12), TNF-α (WT n = 11; Foxp3CreStk11fl/fl n = 12) and IFN-γ (WT n = 9; Foxp3CreStk11fl/fl n = 8). e, Quantification of IgG2a/c, IgG2b, IgA and IgM in the serum from WT and Foxp3CreStk11fl/fl mice (n = 6 each group). f, g, Flow cytometry of eosinophils (CD11b+Siglec-F+) in the spleen (f) and lung (g), and alveolar macrophages (CD11bSiglec-F+) in the lung (g) from WT and Foxp3CreStk11fl/fl mice. h, i, Flow cytometry of neutrophils (CD11b+Ly6G+, h) and macrophages (CD11b+F4/80+, i) in the spleen from WT and Foxp3CreStk11fl/fl mice. j, k, Representative images of MBP (major basic protein, pink, which labels eosinophils) (j) and YM1 (brown, which labels M2 macrophages) (k) staining of skin (×20) from WT and Foxp3CreStk11fl/fl mice. Data are representative of two (a–c, j, k), one (d, e) or at least three (f–i) independent experiments. Data are mean ± s.e.m. P values are determined by two-tailed Student’s t-test (d, e). NS, not significant; *P < 0.05, **P < 0.005, ***P < 0.0005. Numbers in gates indicate percentage of cells.
Extended Data Figure 2
Extended Data Figure 2. Excessive T cell activation and TH2-dominant inflammatory responses in Foxp3CreStk11fl/fl mice
a, Expression of CD62L and CD44 on CD4+ and CD8+ T cells in the spleen from WT and Foxp3CreStk11fl/fl mice. b, Flow cytometry and quantification of IL-4- and IL-5-producing CD4+ T cells in the spleen from WT and Foxp3CreStk11fl/fl mice (approximately 4–5 weeks old) after in vitro stimulation for 4 h. c, Flow cytometry of IL-4- and IL-5-producing Treg cells in the spleen from WT and Foxp3CreStk11fl/fl mice. d, e, Flow cytometry and quantification of IFN-γ-(d) and IL-17-producing (e) CD4+ T cells in the spleen from the mice in (b). f, Flow cytometry of IL-4-producing CD4+ T cells in the lung (left panel) and colon (right panel) from WT and Foxp3CreStk11fl/fl mice. g, Expression of IL-5 and IL-17 in CD4+ T cells in the spleen from young WT and Foxp3CreStk11fl/fl mice (approximately 16 days old). Right, fold changes of IL-5- or IL-17-producing CD4+ T cells from Foxp3CreStk11fl/fl versus WT counterparts (n = 5 each group). Data are representative of at least three (ag) independent experiments. Data are mean ± s.e.m. P values are determined by Mann-Whitney test (b, d, e) or two-tailed Student’s t-test (g). *P < 0.05, **P < 0.005, ***P < 0.0005. Numbers in quadrants or gates indicate percentage of cells.
Extended Data Figure 3
Extended Data Figure 3. LKB1 regulates Treg cell homeostasis and function
a, Flow cytometry of Treg cells in the lung (left panel) and colon (right panel) from WT and Foxp3CreStk11fl/fl mice. b, BrdU incorporation in splenic Treg cells from WT and Foxp3CreStk11fl/fl mice at 16 h after injection of BrdU. c, d, Expression of active caspase-3 (c) and Bim (d) in CD45.2+ Treg cells from CD45.1+:WT and CD45.1+:Foxp3CreStk11fl/fl mixed BM chimeras. e, Flow cytometry of splenic Treg cells from young WT and Foxp3CreStk11fl/fl mice (approximately 16 days old). Right, proportions of Treg cells (WT n = 7; Foxp3CreStk11fl/fl n = 5). f, g, Expression of Bim (f), and CD62L and CD44 (g) in splenic CD4+ T cells from young WT and Foxp3CreStk11fl/fl mice (approximately 16 days old). h, i, Representative images of hematoxylin and eosin staining of the lung (h) and measurement of IgE in the serum (i) from young WT and Foxp3CreStk11fl/fl mice (approximately 16 days old). j, Flow cytometry of splenic Treg cells from WT, Foxp3CreStk11fl/fl and Foxp3CreStk11fl/flBcl2l11fl/fl mice. k, Expression of CD62L and CD44 on CD4+ T cells from WT, Foxp3CreStk11fl/fl and Foxp3CreStk11fl/flBcl2l11fl/fl mice. l, Flow cytometry of splenic Treg cells from WT and Foxp3CreBcl2l11fl/fl mice. m, Expression of IL-4 and IFN-γ in CD4+ T cells from WT and Foxp3CreBcl2l11fl/fl mice after in vitro stimulation for 4 h. Data are representative of at least three (ad) or two (em) independent experiments. Data are mean ± s.e.m. P values are determined by Mann-Whitney test (e) or two-tailed Student’s t-test (i). NS, not significant; *P < 0.01. Numbers above graphs indicate the mean fluorescence intensity; numbers in quadrants or gates indicate percentage of cells.
Extended Data Figure 4
Extended Data Figure 4. LKB1 regulates the expression of distinct Treg signature molecules
a, Comparison of PD-1, GITR and OX40 expression on Treg cells from WT and Foxp3CreStk11fl/fl mice. b, Flow cytometry of resting (CD62LhiCD44low) and activated (CD62LlowCD44hi) Treg cells in the spleen from WT and Foxp3CreStk11fl/fl mice. c, Comparison of GATA3, IRF4, T-bet and RORγt in Treg cells from WT and Foxp3CreStk11fl/fl mice. d, Comparison of Foxp3, ICOS, CTLA-4 and CD25 expression in Treg cells from WT and Foxp3CreStk11fl/fl mice. e, Comparison of Foxp3, ICOS, CTLA-4 and CD25 expression in CD45.2+ WT and CD45.2+ Foxp3CreStk11fl/fl Treg cells from mixed BM chimeras. f, Expression of Stk11 mRNA in CD4+Foxp3-GFP+YFP+ T cells from Foxp3Cre-ERT2Stk11fl/+ and Foxp3Cre-ERT2Stk11fl/fl mice. g, Flow cytometry of Foxp3-GFP+YFP+ Treg cells from Foxp3Cre-ERT2Stk11fl/+ and Foxp3Cre-ERT2Stk11fl/fl mice at day 20 after the last tamoxifen administration. h, Proportion of DAPI+ Foxp3-GFP+YFP+ Treg cells in (g). i, Flow cytometry of Foxp3-GFP+YFP+ Treg cells from Foxp3Cre-ERT2Stk11fl/+ and Foxp3Cre-ERT2Stk11fl/fl mice at day 6 after the last tamoxifen administration. j, k, Expression of IL-4 versus IL-13 (j) and IFN-γ versus IL-17 (k) in CD4+ T cells from Foxp3Cre-ERT2Stk11fl/+ and Foxp3Cre-ERT2Stk11fl/fl mice after in vitro stimulation for 4 h. l, Comparison of Foxp3-GFP, ICOS and CD25 expression on Foxp3-GFP+YFP+ Treg cells from Foxp3Cre-ERT2Stk11fl/+ and Foxp3Cre-ERT2Stk11fl/fl mice. m, Flow cytometry of resting (CD62LhiCD44low) and activated (CD62LlowCD44hi) Treg cells in the spleen from Foxp3Cre-ERT2Stk11fl/+ and Foxp3Cre-ERT2Stk11fl/fl mice. Data are representative of at least three (ai, l, m) or two (j, k) independent experiments. Data are mean ± s.e.m. P values are determined by two-tailed Student’s t-test (f). ***P < 0.0001. Numbers above graphs indicate the mean fluorescence intensity; numbers in quadrants or gates indicate percentage of cells.
Extended Data Figure 5
Extended Data Figure 5. LKB1 regulates Treg cell function independently of mTOR-HIF-1α axis and AMPK signaling
a, b, Phosphorylation of S6 (a), and phosphorylation of AKT S473 and FOXO1 (b) in WT and Foxp3CreStk11fl/fl Treg cells stimulated with or without α-CD3-CD28 for 48 h. c, Flow cytometry of splenic Treg cells from WT, Foxp3CreStk11fl/fl, Foxp3CreHif1afl/fl and Foxp3CreStk11fl/flHif1afl/fl mice. d, Expression of CD62L and CD44 on CD4+ T cells from the mice in (c). e, Expression of IL-4 and IL-17 in CD4+ T cells from the mice in (c) after in vitro stimulation for 4 h. f, Phosphorylation of AMPK in WT and LKB1-deficient Treg cells stimulated with α-CD3-CD28 for 48 h. g, Expression of CD62L and CD44 on CD4+ (upper) and CD8+ T cells (lower) from WT and Foxp3CrePrkaa1fl/flPrkaa2fl/fl mice. h, Expression of IFN-γ, IL-4 and IL-17 in CD4+ (upper) and CD8+ T cells (lower) from WT and Foxp3CrePrkaa1fl/flPrkaa2fl/fl mice after in vitro stimulation for 4 h. Data are representative of two (af) or three (g, h) independent experiments. Numbers in quadrants or gates indicate percentage of cells.
Extended Data Figure 6
Extended Data Figure 6. LKB1-dependent gene expresison and metabolic programs in Treg cells
a, Gene set enrichment analysis (GSEA) of transcriptional profiles in WT and Foxp3CreStk11fl/fl Treg cells from mixed BM chimeras (n = 5 each group). The list of top 10 gene sets downregulated in Foxp3CreStk11fl/fl Treg cells were shown. NES, normalized enrichment score. b, c, The gene sets of TCA cycle and respiratory electron transport (b) and mitochondrial protein import (c) were enriched among the top 10 downregulated pathways in Foxp3CreStk11fl/fl Treg cells. d, Heat maps showing relative abundance of metabolites differentially expressed and unsupervised hierarchical clustering. e, f, Relative abundance of metabolites implicated in TCA cycle (e) or glycolytic pathways (f) in Foxp3CreStk11fl/+ and Foxp3CreStk11fl/fl Treg cells. DHAP: glyceraldehyde 3P; PEP: phosphoenolpyruvic acid. g, Comparison of mitochondrial mass, TMRM (indicative of mitochondrial membrane potential) and ROS production in WT and LKB1-deficient Treg cells. h, Relative amount of intracellular ATP in WT and LKB1-deficient Treg cells. i, j, Oxygen consumption rate (OCR) (i) and extracellular acidification rate (ECAR) (j) of activated Foxp3-GFP+YFP+ Treg cells from Foxp3Cre-ERT2Stk11fl/+ and Foxp3Cre-ERT2Stk11fl/fl mice. k, Comparison of lipid droplets in WT and LKB1-deficient Treg cells. l, OCR of activated Foxp3-GFP+YFP+ Treg cells responding to the treatment of inhibitors Oligomycin (Oligo), FCCP, etomoxir (Eto) and Rotenone/antimycin A (Rot/AA). m, De novo lipid biosynthesis of Foxp3-GFP+YFP+ Treg cells stimulated with α-CD3-CD28 for 48 h. Data are representative of one (ac; n = 5 mice each group; df; Foxp3CreStk11fl/+ n = 3, Foxp3CreStk11fl/fl n = 4) or two (gm) independent experiments. Data are mean ± s.e.m. P values are determined by two-tailed Student’s t-test (e, f, hj, m) or two-way ANOVA (l). NS, not significant; *P < 0.05, **P < 0.005. Numbers above graphs indicate the mean fluorescence intensity.
Extended Data Figure 7
Extended Data Figure 7. Deletion of IL-4 partially rescues dysregulated type 2 immune responses, but not Treg cell function or overall immune homeostasis
a, b, Expression of IL-4 and IL-13 (a) and IL-5 (b) in splenic CD4+ T cells from WT, Foxp3CreStk11fl/fl, Il4−/− and Foxp3CreStk11fl/flIl4−/− mice after in vitro stimulation for 4 h. c, d, Flow cytometry of eosinophils (CD11b+Siglec-F+) (c) and CD11b+PD-L2+ DCs (gated on CD11c+MHC-II+) (d) in the spleen from the mice in (a). e, Quantification of IgE and IgG1 in the serum from the mice in (a, n = 3 each group). f, Flow cytometry of splenic Treg cells from the mice in (a). g, Mean fluorescence intensity (MFI) of PD-1, GITR and OX40 expression on Treg cells from the mice in (a). h, Expression of CD62L and CD44 on splenic CD4+ T cells from the mice in (a). i, Expression of IFN-γ and IL-4 in splenic CD4+ T cells from the mice in (a) after in vitro stimulation for 4 h. j, Representative images of hematoxylin and eosin staining of the lung (original magnification, ×10), liver (×10) and skin (×20) from the mice in (a). Data are representative of at least three (ad, f, h, i) or two (e, g, j) independent experiments. Data are mean ± s.e.m. P values are determined by one-way ANOVA (e, g). NS, not significant; *P < 0.05, **P < 0.005. Numbers in quadrants or gates indicate percentage of cells.
Extended Data Figure 8
Extended Data Figure 8. Defects of LKB1-deficient Treg cells in suppressing DC maturation and TH2 cell differentiation
a, Production of IL-25 and IL-33 in the homogenate of the lung from WT and Foxp3CreStk11fl/fl mice, normalized by the weight of the lung (WT, n = 7; Foxp3CreStk11fl/fl, n = 5). b, Fold change of CD80 and CD86 expression on splenic DCs from C57BL/6 mice stimulated with TSLP for 18 h. c, Mean fluorescence intensity (MFI) of CD80 and CD86 expression on DCs (with or without TSLP) cultured alone, or together with WT or Foxp3CreStk11fl/fl Treg cells for 48 h. d, Naïve CD4+ T cells were cocultured with TSLP-DCs alone, or together with Treg cells from Foxp3Cre-ERT2Stk11fl/+ or Foxp3Cre-ERT2Stk11fl/fl mice (after tamoxifen treatment) for 5 days, and expression of Il4, Il5 and Il13 mRNA in cocultured CD4+ T cells was measured after restimulation with α-CD3 for 5 h. e, f, Naïve CD4+ T cells were cocultured with LPS-primed DCs alone, or together with Treg cells from Foxp3Cre-ERT2Stk11fl/+ or Foxp3Cre-ERT2Stk11fl/fl mice (after tamoxifen treatment) for 5 days, followed by analyses of IFN-γ expression after in vitro stimulation for 4 h (e), and Ifng mRNA expression after restimulation with α-CD3 for 5 h (f). Data are representative of two (a, df) or three (b, c) independent experiments. Data are mean ± s.e.m. P values are determined by two-tailed Student’s t-test (a, b) or one-way ANOVA (c). NS, not significant; *P < 0.05, **P < 0.005. Numbers in gates indicate percentage of cells.
Extended Data Figure 9
Extended Data Figure 9. Appropriate control of PD-1 expression is important for Treg cells in suppressing TH2 immune responses
a, b, Fold change of PD-1, GITR and OX40 expression on lung Treg cells (a), or splenic Treg cells (b) from OVA-sensitized C57BL/6 mice with or without OVA inhalation challenge. c, Expression of IL-4 in CD4+ T cells cocultured with TSLP-DCs, or together with Treg cells transduced with control retrovirus (RV) or PD-1-expressing retrovirus (Pdcd1-RV). d, Expression of IL-4 in CD4+ T cells cocultured with TSLP-DCs, or together with WT or PD-1-deficient Treg cells. e, Flow cytometry of eosinophils (CD11b+Siglec-F+) in the lung and spleen from Rag1−/− mice reconstituted with Scurfy:WT or Scurfy:Pdcd1−/− BM cells. f, Concentration of IgG1 and IgG2a/c in the serum from the mice in (e). Data are representative of two (af) independent experiments. Data are mean ± s.e.m. P values are determined by two-tailed Student’s t-test (a, b, f). NS, not significant; *P < 0.05, **P < 0.005. Numbers in gates indicate percentage of cells.
Extended Data Figure 10
Extended Data Figure 10. Treg cells require the LKB1-β-catenin axis to enforce their functional fitness in maintaining immune homeostasis
a, GSEA reveals the significant enrichment of the Wnt signaling gene set among the downregulated pathways in LKB1-deficient Treg cells. b, Relative expression of Ctnnb1 mRNA in activated WT and LKB1-deficient Treg cells. c, Expression of total and phosphorylated β-catenin in activated WT and LKB1-deficient Treg cells. Right, relative phosphorylation of β-catenin normalized by total β-catenin. d, ChIP and realtime PCR analysis of β-catenin-bound DNA of the Pdcd1 locus from activated Foxp3Cre-ERT2Stk11fl/+ and Foxp3Cre-ERT2Stk11fl/fl Treg cells (following in vivo tamoxifen treatment). e, Mean fluorescence intensity (MFI) of GITR and CD25 expression on WT and Foxp3CreStk11fl/fl Treg cells transduced with control retrovirus (RV) or mutant β-catenin-expressing retrovirus (β-cat-RV). f, MFI of PD-1, GITR and CD25 expression on Foxp3Cre-ERT2Stk11fl/+ and Foxp3Cre-ERT2Stk11fl/fl Treg cells (following in vivo tamoxifen treatment) transduced with control RV or β-cat-RV. g, Expression of PD-L2, CD80 and CD86 on DCs cocultured with WT or LKB1-deficient Treg cells transduced with RV or β-cat-RV. Numbers above graphs indicate the MFI. Data are representative of one (a) or two (bg) independent experiments. Data are mean ± s.e.m. P values are determined by two-tailed Student’s t-test (d) or two-way ANOVA (e, f). NS, not significant; **P < 0.005, ***P < 0.0005. h, Schematics of LKB1 signaling in the regulation of Treg cell function and immune homeostasis. LKB1 signaling in Treg cells establishes metabolic and homeostatic fitness required for preventing undesired immune responses through selectively controlling the expression of inhibitory regulators, including PD-1, GITR and OX40. Consequently, uncontrolled expression of PD-1 and possible other receptors impairs the capability of Treg cells in suppressing TH2 immune responses triggered by TSLP-induced PD-L2+ DCs. Although not depicted here, IL-4 contributes to the induction of PD-L2 on DCs and the amplification of TH2-mediated immunopathology.
Figure 1
Figure 1. Foxp3CreStk11fl/fl mice spontaneously develop a TH2-dominant inflammatory disease
a, Survival curve of WT (n = 10) and Foxp3CreStk11fl/fl mice (n = 42; P < 0.0001). b, Gross body weight of WT (n = 6) and Foxp3CreStk11fl/fl mice (n = 7). c, Representative images of WT and Foxp3CreStk11fl/fl mice. d, e, Representative images of the spleen and peripheral lymph nodes (d) or hematoxylin and eosin staining of the lung (original magnification, ×10), liver (×10), pancreas (×20), eyelid (×40) and skin (×20) (e). f, Quantification of serum IL-4 and IL-5 from WT and Foxp3CreStk11fl/fl mice (n = 11 each group). g, Quantification of serum IgE and IgG1 from WT and Foxp3CreStk11fl/fl mice (n = 6 each group). h, Expression of IL-4 and IFN-γ in CD4+ T cells from young mice (approximately 16 days old). Right, fold changes of IL-4- or IFN-γ-producing CD4+ T cells from Foxp3CreStk11fl/fl mice versus WT counterparts (n = 5 each group). Data are representative of one (a), two (b–g) or at least three (h) independent experiments. Data are mean ± s.e.m. P values are determined by Logrank test (a), or two-tailed Student’s t-test (b, f–h). *P < 0.05, **P < 0.005, ***P < 0.0005. Numbers in quadrants indicate percentage of cells.
Figure 2
Figure 2. LKB1 controls Treg cell survival and expression of selective co-receptors PD-1, GITR and OX40
a, Treg cells from WT and Foxp3CreStk11fl/fl mice. Right, proportion and number of Treg cells (WT n = 5; Foxp3CreStk11fl/fl n = 4). b, c, Caspase-3 activity (b) and Bim expression (c) in Treg cells. d, Donor WT and Foxp3CreStk11fl/fl Treg cells from mixed BM chimeras. e, IL-4- and IL-17-producing CD4+ T cells from the indicated mice. f, PD-1, GITR and OX40 expression on Treg cells in d. g, PD-1, GITR, OX40, and Bim expression in WT Treg cells and Treg cells with acute deletion of LKB1. Data are representative of at least three (ag) independent experiments. Data are mean ± s.e.m. P values are determined by Mann-Whitney test (a, cell proportion) or two-tailed Student’s t-test (a, cell number). *P < 0.05, **P < 0.005. Numbers above graphs indicate the mean fluorescence intensity; numbers in quadrants or gates indicate percentage of cells.
Figure 3
Figure 3. LKB1 regulates Treg cell metabolism through connecting immune signals and mitochondrial function
a, Phosphorylation and expression of LKB1 in resting and activated Treg cells. b, Phosphorylation of S6 and 4E-BP1 in resting Treg cells. c, Treg cells from WT and Foxp3CrePrkaa1fl/flPrkaa2fl/fl mice. d, Heat maps of differentially expressed intracellular metabolites and unsupervised hierarchical clustering (Foxp3CreStk11fl/+ n = 3; Foxp3CreStk11fl/fl n = 4). e, Relative abundance of histamine in the cells and culture medium in d (Foxp3CreStk11fl/+ n = 3; Foxp3CreStk11fl/fl n = 4). f, Hdc mRNA in resting and activated Treg cells. g, Metabolite set enrichment of the downregulated and upregulated metabolic pathways in Foxp3CreStk11fl/fl Treg cells (false discovery rate, FDR, ≤ 0.05). NES, normalized enrichment score. Data are representative of two (ac), one (d, e, g) or three (f) independent experiments. Data are mean ± s.e.m. P values are determined by two-tailed Student’s t-test (e). *P < 0.01, **P < 0.001. Numbers above graphs indicate the mean fluorescence intensity; numbers in gates indicate percentage of cells. For gel source data, see Supplementary Figure 1.
Figure 4
Figure 4. LKB1-β-catenin axis enforces Treg-mediated suppression of TH2 responses through the control of PD-1 expression
a, Production of TSLP in the lung (WT n = 7; Foxp3CreStk11fl/fl n = 5). b, Fold change of PD-L2 expression on DCs with or without TSLP stimulation (n = 3 each group). c, CD11b+PD-L2+ DCs from WT and Foxp3CreStk11fl/fl mice. Right, proportion of PD-L2+ DCs (n = 4 each group). d, Mean fluorescence intensity (MFI) of PD-L2 expression on DCs (with TSLP) cultured alone, or together with WT or Foxp3CreStk11fl/fl Treg cells (n = 4 each group). e, Expression of IL-4 and IFN-γ in CD4+ T cells cocultured with TSLP-DCs alone, or together with Foxp3Cre-ERT2Stk11fl/+ or Foxp3Cre-ERT2Stk11fl/fl Treg cells. f, Expression of IL-4 and IFN-γ in CD4+ T cells cocultured with TSLP-DCs and Foxp3Cre-ERT2Stk11fl/+ or Foxp3Cre-ERT2Stk11fl/fl Treg cells in the presence of control IgG or indicated blocking antibodies. g, Phosphorylation of LKB1 and expression of β-catenin in resting and activated Treg cells. h, MFI of PD-1 expression on Treg cells transduced with control retrovirus (RV) or mutant β-catenin-expressing retrovirus (β-cat-RV) (n = 3 each group). i, Expression of IL-4 in CD4+ T cells cocultured with TSLP-DCs, or together with RV- or β-cat-RV-transduced Treg cells. Data are representative of at least two (ai) independent experiments. Data are mean ± s.e.m. P values are determined by two-tailed Student’s t-test (a, b), Mann-Whitney test (c) or one-way ANOVA (d, h). NS, not significant; *P < 0.05, **P < 0.005. Numbers in quadrants or gates indicate percentage of cells.

Comment in

References

    1. Liston A, Gray DH. Homeostatic control of regulatory T cell diversity. Nat Rev Immunol. 2014;14:154–165. - PubMed
    1. Sakaguchi S, Yamaguchi T, Nomura T, Ono M. Regulatory T cells and immune tolerance. Cell. 2008;133:775–787. - PubMed
    1. van der Veeken J, Arvey A, Rudensky A. Transcriptional control of regulatory T-cell differentiation. Cold Spring Harb Symp Quant Biol. 2013;78:215–222. - PubMed
    1. Panduro M, Benoist C, Mathis D. Tissue Tregs. Annu Rev Immunol. 2016;34:609–633. - PMC - PubMed
    1. Shackelford DB, Shaw RJ. The LKB1-AMPK pathway: metabolism and growth control in tumour suppression. Nat Rev Cancer. 2009;9:563–575. - PMC - PubMed

Publication types

MeSH terms