

Accuracy of Cardiovascular Risk Prediction Varies by Neighborhood Socioeconomic Position: A Retrospective Cohort Study
- PMID: 28847012
- PMCID: PMC6435027
- DOI: 10.7326/M16-2543
Accuracy of Cardiovascular Risk Prediction Varies by Neighborhood Socioeconomic Position: A Retrospective Cohort Study
Abstract
Background: Inequality in health outcomes in relation to Americans' socioeconomic position is rising.
Objective: First, to evaluate the spatial relationship between neighborhood disadvantage and major atherosclerotic cardiovascular disease (ASCVD)-related events; second, to evaluate the relative extent to which neighborhood disadvantage and physiologic risk account for neighborhood-level variation in ASCVD event rates.
Design: Observational cohort analysis of geocoded longitudinal electronic health records.
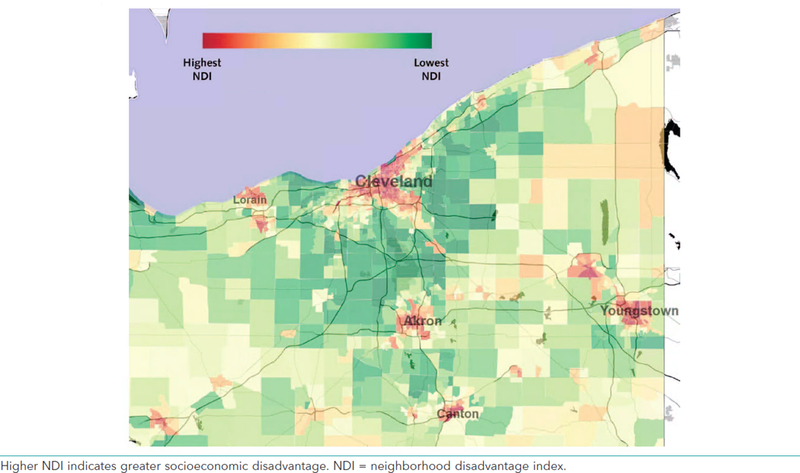
Setting: A single academic health center and surrounding neighborhoods in northeastern Ohio.
Patients: 109 793 patients from the Cleveland Clinic Health System (CCHS) who had an outpatient lipid panel drawn between 2007 and 2010. The date of the first qualifying lipid panel served as the study baseline.
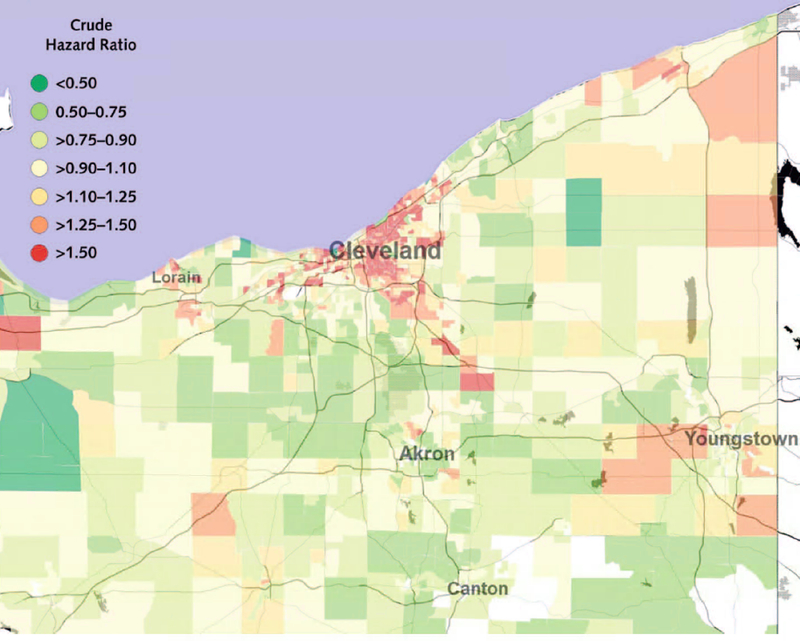
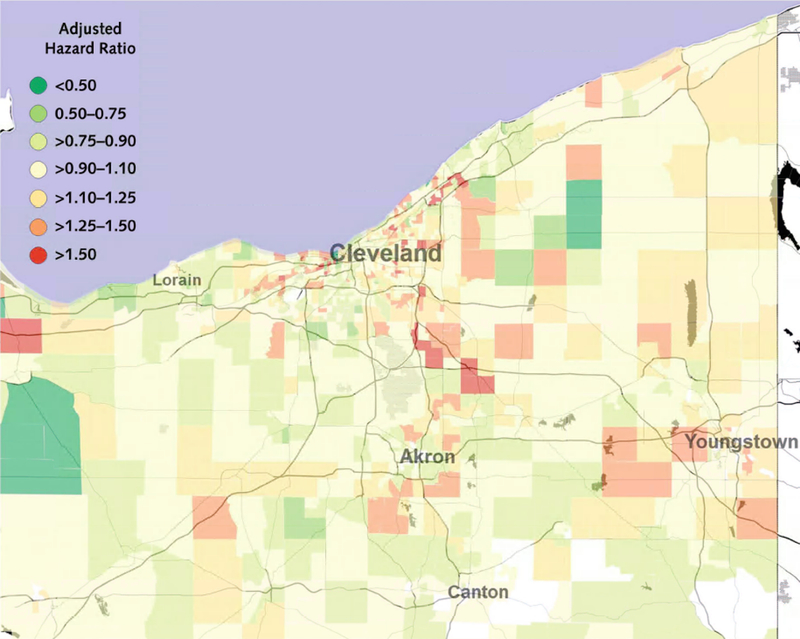
Measurements: Time from baseline to the first occurrence of a major ASCVD event (myocardial infarction, stroke, or cardiovascular death) within 5 years, modeled as a function of a locally derived neighborhood disadvantage index (NDI) and the predicted 5-year ASCVD event rate from the Pooled Cohort Equations Risk Model (PCERM) of the American College of Cardiology and American Heart Association. Outcome data were censored if no CCHS encounters occurred for 2 consecutive years or when state death data were no longer available (that is, from 2014 onward).
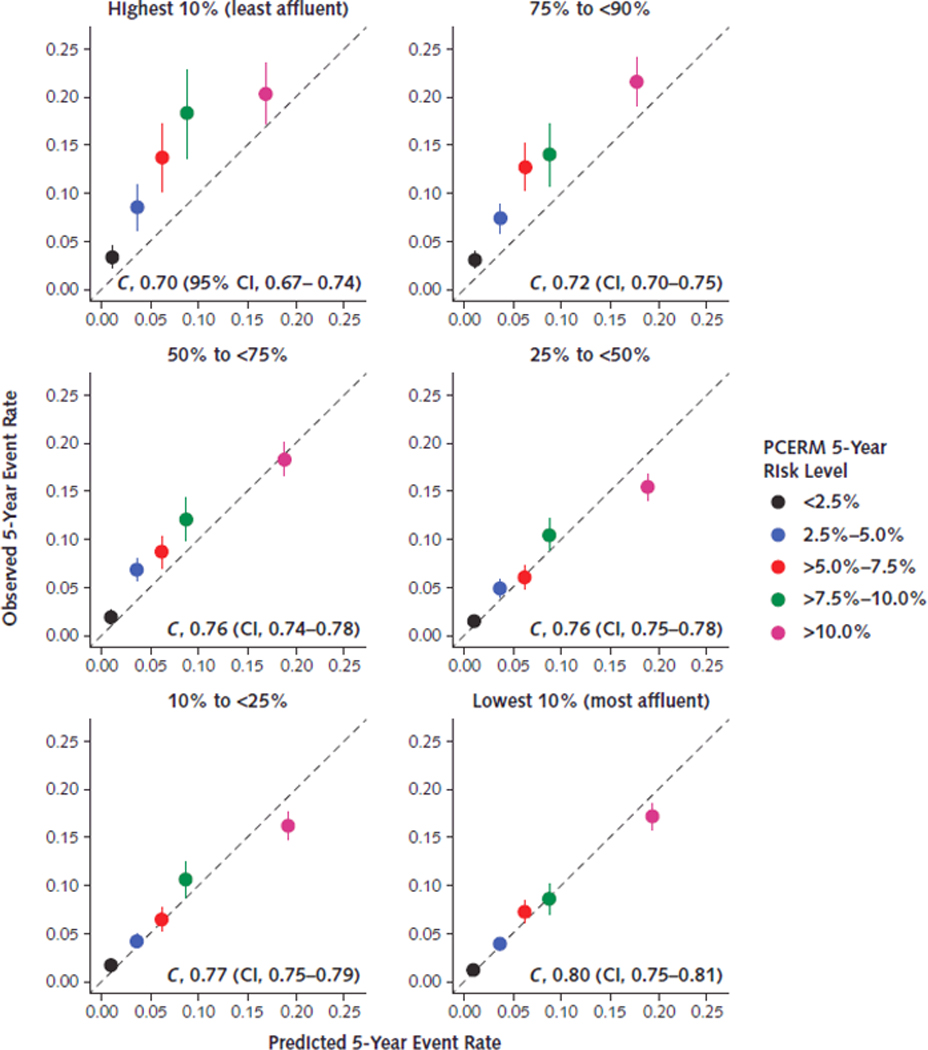
Results: The PCERM systematically underpredicted ASCVD event risk among patients from disadvantaged communities. Model discrimination was poorer among these patients (concordance index [C], 0.70 [95% CI, 0.67 to 0.74]) than those from the most affluent communities (C, 0.80 [CI, 0.78 to 0.81]). The NDI alone accounted for 32.0% of census tract-level variation in ASCVD event rates, compared with 10.0% accounted for by the PCERM.
Limitations: Patients from affluent communities were overrepresented. Outcomes of patients who received treatment for cardiovascular disease at Cleveland Clinic were assumed to be independent of whether the patients came from a disadvantaged or an affluent neighborhood.
Conclusion: Neighborhood disadvantage may be a powerful regulator of ASCVD event risk. In addition to supplemental risk models and clinical screening criteria, population-based solutions are needed to ameliorate the deleterious effects of neighborhood disadvantage on health outcomes.
Primary funding source: The Clinical and Translational Science Collaborative of Cleveland and National Institutes of Health.
Conflict of interest statement
All Authors: No conflicts of interest
Figures
Comment in
-
Population Health Science and the Challenges of Prediction.Ann Intern Med. 2017 Oct 3;167(7):511-512. doi: 10.7326/M17-1733. Epub 2017 Aug 29. Ann Intern Med. 2017. PMID: 28847011 Free PMC article. No abstract available.
-
Herzrisiko hängt von Nachbarschaft ab.MMW Fortschr Med. 2018 Apr;160(7):34. doi: 10.1007/s15006-018-0423-2. MMW Fortschr Med. 2018. PMID: 29663216 German. No abstract available.
-
Accuracy of Cardiovascular Risk Prediction Varies by Neighborhood Socioeconomic Position.Ann Intern Med. 2018 May 1;168(9):680-681. doi: 10.7326/L18-0007. Ann Intern Med. 2018. PMID: 29710254 No abstract available.
-
Accuracy of Cardiovascular Risk Prediction Varies by Neighborhood Socioeconomic Position.Ann Intern Med. 2018 May 1;168(9):681-682. doi: 10.7326/L18-0008. Ann Intern Med. 2018. PMID: 29710255 Free PMC article. No abstract available.
References
-
- Bosworth B, Burtless G, and Zhang K, Later Retirement, Inequality in Old Age, and the Growing Gap in Longevity Between Rich and Poor. 2016, Washington, DC: Brookings Institution.
-
- Harrell F, Regression Modeling Strategies: with Applications to Linear Models, Logistic and Ordinal Regression, and Survival Analysis. 2015: Springer.
Publication types
MeSH terms
Grants and funding
LinkOut - more resources
Full Text Sources
Other Literature Sources
Medical