. 2017 Nov 7;167(9):618-629.
doi: 10.7326/M17-1358. Epub 2017 Aug 29.

Do Less Harm: Evaluating HIV Programmatic Alternatives in Response to Cutbacks in Foreign Aid

Affiliations

Do Less Harm: Evaluating HIV Programmatic Alternatives in Response to Cutbacks in Foreign Aid

Rochelle P Walensky et al. Ann Intern Med. .

Abstract

Background: Resource-limited nations must consider their response to potential contractions in international support for HIV programs.

Objective: To evaluate the clinical, epidemiologic, and budgetary consequences of alternative HIV program scale-back strategies in 2 recipient nations, the Republic of South Africa (RSA) and Côte d'Ivoire (CI).

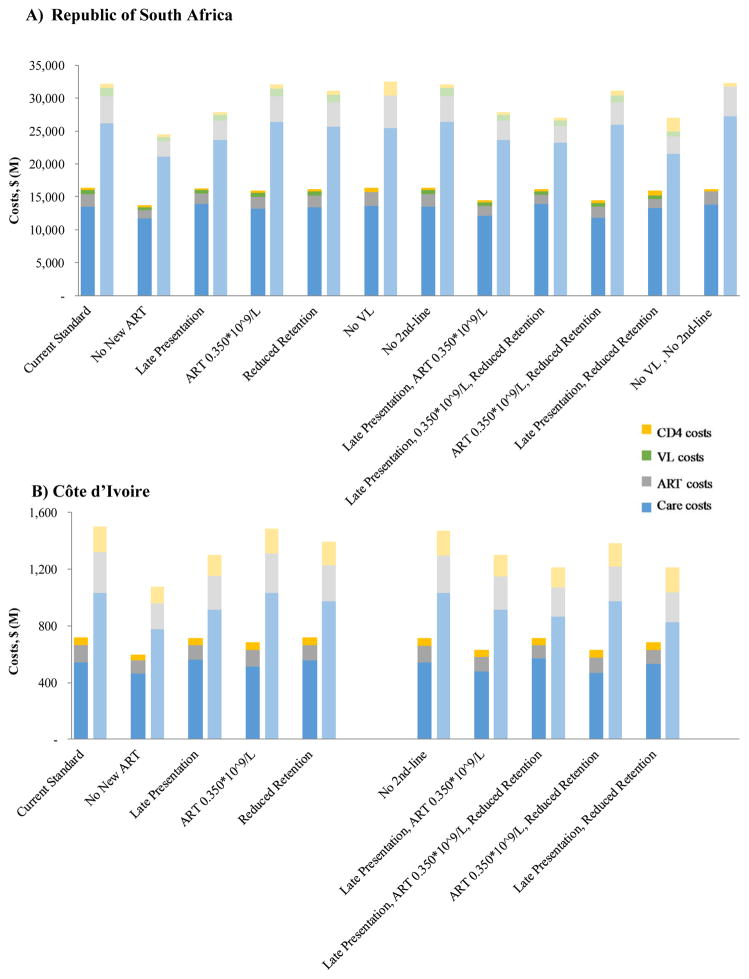
Design: Model-based comparison between current standard (CD4 count at presentation of 0.260 × 10⁹ cells/L, universal antiretroviral therapy [ART] eligibility, and 5-year retention rate of 84%) and scale-back alternatives, including reduced HIV detection, no ART or delayed initiation (when CD4 count is <0.350 × 10⁹ cells/L), reduced investment in retention, and no viral load monitoring or second-line ART.

Data sources: Published RSA- and CI-specific estimates of the HIV care continuum, ART efficacy, and HIV-related costs.

Target population: HIV-infected persons, including future incident cases.

Time horizon: 5 and 10 years.

Perspective: Modified societal perspective, excluding time and productivity costs.

Outcome measures: HIV transmissions and deaths, years of life, and budgetary outlays (2015 U.S. dollars).

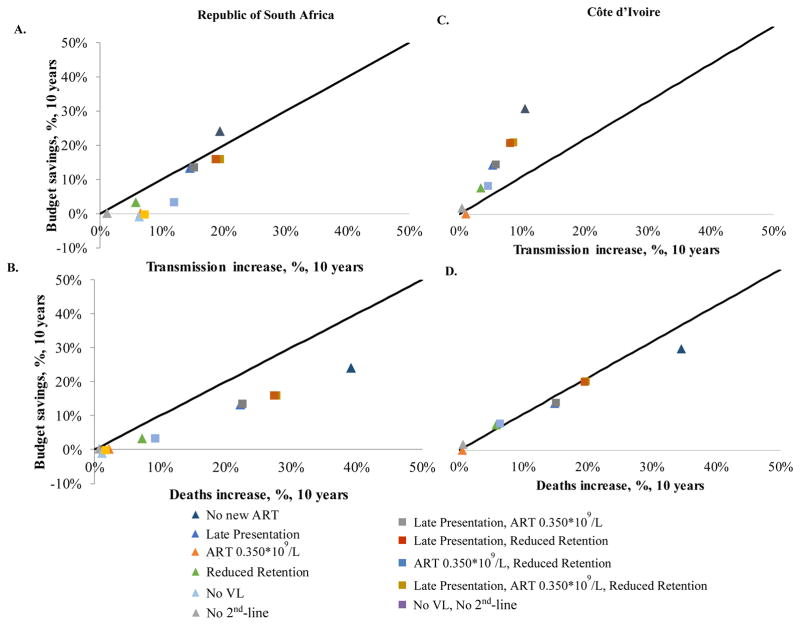
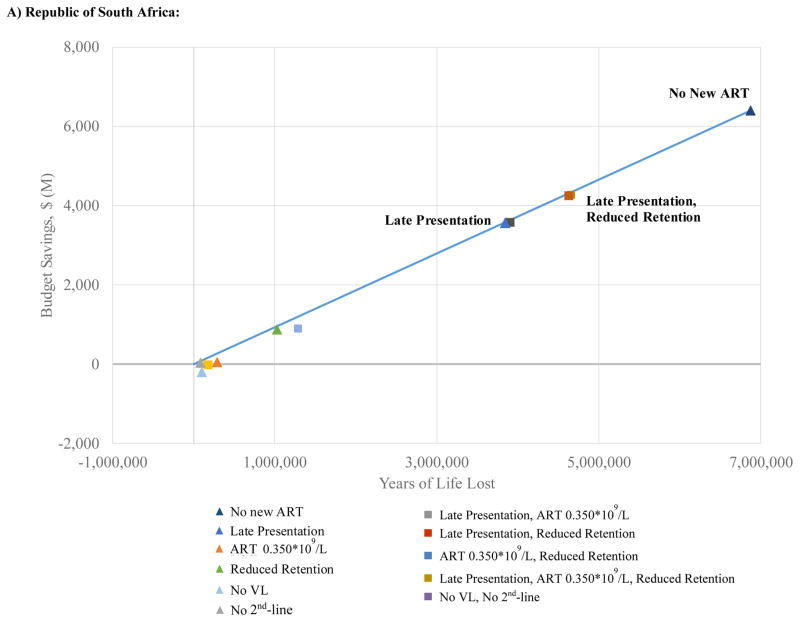
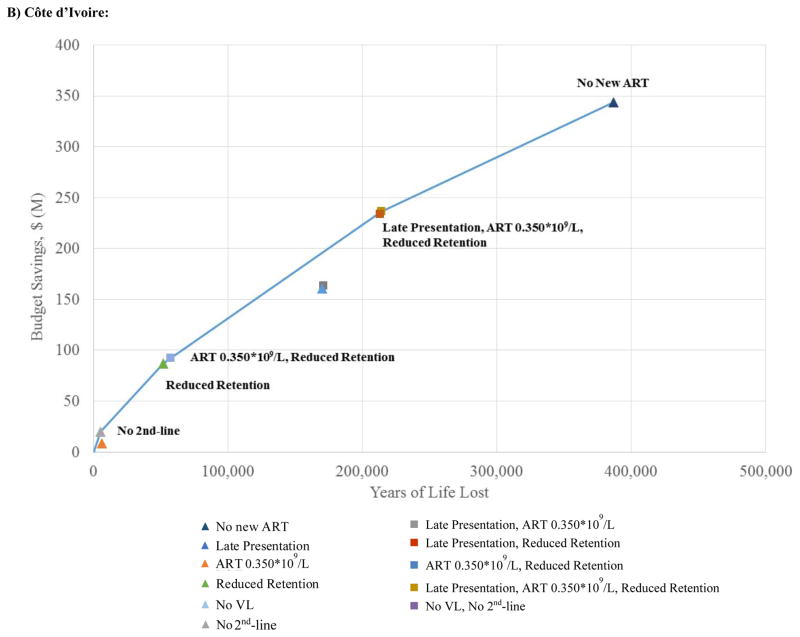
Results of base-case analysis: At 10 years, scale-back strategies increase projected HIV transmissions by 0.5% to 19.4% and deaths by 0.6% to 39.1%. Strategies can produce budgetary savings of up to 30% but no more. Compared with the current standard, nearly every scale-back strategy produces proportionally more HIV deaths (and transmissions, in RSA) than savings. When the least harmful and most efficient alternatives for achieving budget cuts of 10% to 20% are applied, every year of life lost will save roughly $900 in HIV-related outlays in RSA and $600 to $900 in CI.

Results of sensitivity analysis: Scale-back programs, when combined, may result in clinical and budgetary synergies and offsets.

Limitation: The magnitude and details of budget cuts are not yet known, nor is the degree to which other international partners might step in to restore budget shortfalls.

Conclusion: Scaling back international aid to HIV programs will have severe adverse clinical consequences; for similar economic savings, certain programmatic scale-back choices result in less harm than others.

Primary funding source: National Institutes of Health and Steve and Deborah Gorlin MGH Research Scholars Award.


Figures

Figure 1
Figure 1. 5- and 10-year HIV budget breakdown for alternative HIV/AIDS scale-back programs in the Republic of South Africa (A) and Côte d’Ivoire (B)
5-year outcomes are denoted by the dark bars on the left of each pair; 10-year outcomes by the light bars on the right. Alternative scale-back strategies are arrayed along the horizontal axis; the benchmark of the Current Standard is at the extreme left. Colors denote the type of expense (care [blue], ART [gray], VL monitoring [green], and CD4 monitoring [yellow]).
Figure 2
Figure 2. Comparison of proportional transmission increases and death increases versus proportional budget reductions for HIV scale-back strategies in the Republic of South Africa (A and B) and Côte d’Ivoire (C and D)
The figure compares the percent increase in adverse events against the percent decrease in financial outlays for each scale-back strategy, relative to the Current Standard. The vertical axis of each panel denotes the magnitude of the budgetary savings that can be achieved; the horizontal axis denotes the concomitant proportional increase in transmissions (panels A and C) and deaths (panels B and D). The solid black line with slope equal to 1 represents the “line of identity”; this denotes instances where the percent increase in adverse events equals the percent decrease in financial outlays. Different scale-back strategies are denoted by different colored points. Programs represented by triangles (single programmatic cuts) and squares (combination programmatic cuts) that lie above the line of identity indicate scale-back strategies that deliver greater proportional budgetary savings than the offsetting proportional increase they produce in transmissions or deaths. The figure reports the proportional increase in undiscounted adverse events produced by a given proportional reduction in the budget (undiscounted). It does not represent an assessment of economic value or incremental cost-effectiveness. Because of differences in the ratio of labor compared to ART costs between the two countries, most interventions in CI save proportionally more money, exceeding the line of identity for transmissions and approaching it for deaths.
Figure 3
Figure 3. Efficiency frontier at ten years (results discounted at 3% per year) for alternative HIV programmatic cuts in the Republic of South Africa (A) and Côte d’Ivoire (B)
The figure aims to inform decision making by portraying 10-year outcomes on a discounted basis. Colored points indicate different programmatic scale-back strategies examined. Triangles designate single programmatic cuts; squares denote combination programmatic cuts. The solid line represents the efficiency frontier. Each point represents the projected discounted budgetary savings (vertical axis) and anticipated years of life lost (horizontal axis) for a given strategy. Decision makers can maximize years of life for a given budget by opting for strategies that lie on the efficiency frontier.

References

    1. 90-90-90: an ambitious treatment target to help end the AIDS epidemic. Geneva, Switzerland: Joint United Nations Programme on HIV/AIDS (UNAIDS); 2014. [Accessed 14 July 2017]. at http://www.unaids.org/sites/default/files/media_asset/90-90-90_en_0.pdf.
    1. Walensky RP, Borre ED, Bekker LG, Resch SC, Hyle EP, Wood R, et al. The anticipated clinical and economic effects of 90-90-90 in South Africa. Ann Intern Med. 2016;165(5):325–33. - PMC - PubMed
    1. Williams BG, Gupta S, Wollmers M, Granich R. The impact and cost of ending AIDS in Botswana. Lancet HIV. 2016;3(9):e409. - PubMed
    1. Schneider K, Garrett L. The end of the era of generosity? Global health amid economic crisis. Philos Ethics Humanit Med. 2009;4:1. - PMC - PubMed
    1. Daschle T, Frist B. The case for strategic health diplomacy: a study of PEPFAR. Washington, DC: Bipartisan Policy Center; 2015. [Accessed 12 July 2017]. at http://cdn.bipartisanpolicy.org/wp-content/uploads/2015/11/BPC_Strategic....

MeSH terms

Substances