. 2017 Dec;153(6):1634-1646.e8.
doi: 10.1053/j.gastro.2017.08.037. Epub 2017 Aug 25.

A Panel of Methylated MicroRNA Biomarkers for Identifying High-Risk Patients With Ulcerative Colitis-Associated Colorectal Cancer

Affiliations

A Panel of Methylated MicroRNA Biomarkers for Identifying High-Risk Patients With Ulcerative Colitis-Associated Colorectal Cancer

Yuji Toiyama et al. Gastroenterology. 2017 Dec.

Abstract

Background & aims: Methylation of specific microRNAs (miRNAs) often occurs in an age-dependent manner, as a field defect in some instances, and may be an early event in colitis-associated carcinogenesis. We aimed to determine whether specific mRNA signature patterns (MIR1, MIR9, MIR124, MIR137, MIR34B/C) could be used to identify patients with ulcerative colitis (UC) who are at increased risk for colorectal neoplasia.

Methods: We obtained 387 colorectal tissue specimens collected from 238 patients with UC (152 without neoplasia, 17 with dysplasia, and 69 with UC-associated colorectal cancer [UC-CRC]), from 2 independent cohorts in Japan between 2005 and 2015. We quantified methylation of miRNAs by bisulfite pyrosequencing analysis. We analyzed clinical data to determine whether miRNA methylation patterns were associated with age, location, or segment of the colorectum (cecum, transverse colon, and rectum). Differences in tissue miRNA methylation and expression levels were compared among samples and associated with cancer risk using the Wilcoxon, Mann-Whitney, and Kruskal-Wallis tests as appropriate. We performed a validation study of samples from 90 patients without UC and 61 patients with UC-associated dysplasia or cancer to confirm the association between specific methylation patterns of miRNAs in non-tumor rectal mucosa from patients with UC at risk of UC-CRC.

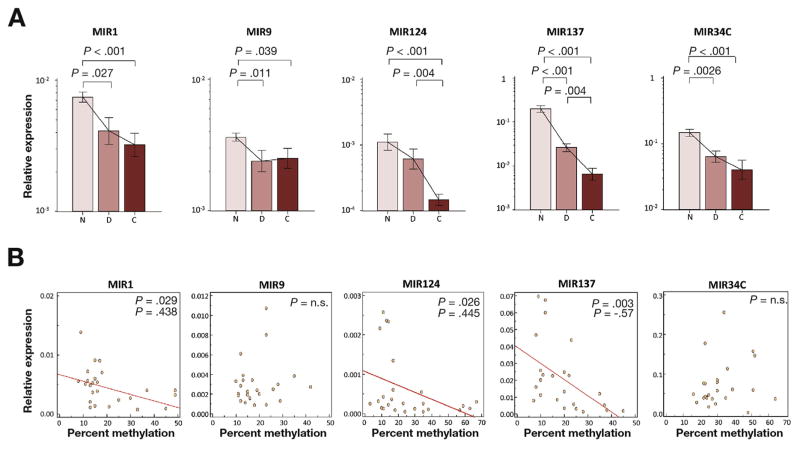
Results: Among patients with UC without neoplasia, rectal tissues had significantly higher levels of methylation levels of MIR1, MIR9, MIR124, and MIR137 than in proximal mucosa; levels of methylation were associated with age and duration of UC in rectal mucosa. Methylation of all miRNAs was significantly higher in samples from patients with dysplasia or CRC compared with samples from patients without neoplasia. Receiver operating characteristic analysis revealed that methylation levels of miRNAs in rectal mucosa accurately differentiated patients with CRC from those without. Methylation of MIR137 in rectal mucosa was an independent risk factor for UC-CRC. Methylation patterns of a set of miRNAs (panel) could discriminate discriminate UC patients with or without dysplasia or CRC in the evaluation cohort (area under the curve, 0.81) and the validation cohort (area under the curve, 0.78).

Conclusions: In evaluation and validation cohorts, we found specific miRNAs to be methylated in rectal mucosal samples from patients with UC with dysplasia or CRC compared with patients without neoplasms. This pattern also associated with patient age and might be used to identify patients with UC at greatest risk for developing UC-CRC. Our findings provide evidence for a field defect in rectal mucosa from patients with UC-CRC.

Keywords: Colitis-Associated Cancer; MIR1; MIR124; MIR137; MIR34B/C; MIR9; Methylation; Ulcerative Colitis.


Conflict of interest statement

Conflict of interests

The authors disclose no conflicts.

Figures

Figure 1
Figure 1
(A) MIR1, MIR9, MIR124, MIR137, and MIR34B/C methylation levels in UC mucosa (n = 186). Dot plots depicting methylation levels of miRNAs in mucosa from the cecum (C; n=62), transverse colon (T; n=62), and rectum (R; n=62) (MIR1, MIR9, MIR124, MIR137, and MIR34B/C, respectively). Statistically significant differences were determined using Mann–Whitney tests and Kruskal–Wallis tests. When multiple hypothesis testing was performed, the P value for significance was adjusted to .017 (= .05/3) by Bonferroni correction. (B) MIR1, MIR9, MIR124, MIR137, and MIR34B/C methylation levels in UC mucosa by disease status (n = 236). Dot plots illustrating miRNA methylation levels in non-neoplastic UC mucosa (N; n=211), dysplasia (D; n=12), and cancer (C; n=13) (MIR1, MIR9, MIR124, MIR137, and MIR34B/C, respectively). Statistically significant differences were determined using Mann–Whitney and Kruskal–Wallis tests. When multiple hypothesis testing was performed, the P value for significance was adjusted to .017 (= .05/3) by Bonferroni correction.
Figure 2
Figure 2
(A) ROC curve analysis for methylation levels of MIR1, MIR9, MIR124, MIR137, and MIR34B/C in distinguishing UC-associated dysplasia or cancer from non-neoplastic UC mucosa. AUC, area under the curve; Sen, sensitivity; Spe, specificity; PPV, positive predictive value; NPV, negative predictive value. ROC curve analyses demonstrate that methylation levels of all 5 miRNAs are robust in discriminating cancer from UC mucosa, with high sensitivity, specificity, NPV, and AUC values of MIR1 (Sensitivity: 84.6%, Specificity: 85.8%, PPV: 26.8%, NPV: 98.9%, AUC: 0.92), MIR9 (Sensitivity: 84.6%, Specificity: 88.6%, PPV: 31.4%, NPV: 98.9%, AUC: 0.94), MIR124 (Sensitivity: 100%, Specificity: 82.9%, PPV: 26.5%, NPV: 100%, AUC: 0.98), MIR137 (Sensitivity: 84.6%, Specificity: 97.6%, PPV: 68.7%, NPV: 99.0%, AUC: 0.98) and MIR34B/C (Sensitivity: 100%, Specificity: 89.1%, PPV: 36.1%, NPV: 100%, AUC: 0.98), respectively, in the upper panels. The lower panels represent ROC curve analyses for methylation levels of miRNAs in discriminating dysplasia from UC mucosa, with high NPV and AUC values of MIR1 (Sensitivity: 75.0%, Specificity: 79.1%, PPV: 17.0%, NPV: 98.2%, AUC: 0.75), MIR9 (Sensitivity: 91.7%, Specificity: 60.2%, PPV: 11.6%, NPV: 99.2%, AUC: 0.8), MIR124 (Sensitivity: 75.0%, Specificity: 79.6%, PPV: 17.3%, NPV: 98.2%, AUC: 0.79), MIR137 (Sensitivity: 83.3%, Specificity: 84.4%, PPV: 23.2%, NPV: 98.9%, AUC: 0.91) and MIR34B/C (Sensitivity: 83.3%, Specificity: 87.2%, PPV: 27.0%, NPV: 98.9%, AUC: 0.9), respectively. (B) Combination analysis for methylation levels of MIR1, MIR9, MIR124, MIR137, and MIR34B/C in discriminating dysplasia or cancer from non-neoplastic UC mucosa. Combined ROC analyses for the methylation levels of various miRNAs revealed a significantly improved AUC value of 0.99 (95% CI: 0.97–0.99) with 100% sensitivity and 95.7% specificity in discriminating UC-associated cancer (left panel), 0.94 (95% CI: 0.9–0.97) with 100% sensitivity and 77.3% specificity in discriminating UC-associated dysplasia (middle panel), and 0.97 (95% CI: 0.94–0.99) with 92.0% sensitivity and 95.3% specificity in discriminating UC-associated neoplasia (dysplasia or cancer; right panel).
Figure 3
Figure 3
(A) ROC curve analysis demonstrated that methylation levels of MIR1, MIR9, MIR124, MIR137, and MIR34B/C in non-neoplastic rectal mucosa could distinguish patients with UC-associated neoplasia from those without in the clinical evaluation cohort. AUC, area under the curve; Sen, sensitivity; Spe, specificity; PPV, positive predictive value; NPV, negative predictive value. The upper panels represent ROC curve analyses of miRNA methylation discriminating UC patients with cancer from those without cancer, with high NPV and AUC values of MIR1 (Sensitivity: 84.6%, Specificity: 75.8%, PPV: 42.3%, NPV: 95.9%, AUC: 0.84), MIR9 (Sensitivity: 61.5%, Specificity: 77.4%, PPV: 36.3%, NPV: 90.6%, AUC: 0.7), MIR124 (Sensitivity: 76.9%, Specificity: 67.7%, PPV: 33.3%, NPV: 93.3%, AUC: 0.76), MIR137 (Sensitivity: 76.9%, Specificity: 80.6%, PPV: 45.5%, NPV: 94.3%, AUC: 0.8), and MIR34B/C (Sensitivity: 100%, Specificity: 56.5%, PPV: 32.5%, NPV: 100%, AUC: 0.8), respectively. The lower panels demonstrate ROC curve analyses for methylation levels of these miRNAs in differentiating UC patients with cancer or dysplasia from those without, with corresponding AUC values of 0.7 (MIR1: Sensitivity: 84.0%, Specificity: 53.2%, PPV: 42.0%, NPV: 89.2%), 0.63 (MIR9: Sensitivity: 88.0%, Specificity: 38.7%, PPV: 36.7%, NPV: 88.9%), 0.61 (MIR124: Sensitivity: 24.0%, Specificity: 95.2%, PPV: 66.7%, NPV: 75.6%), 0.77 (MIR137: Sensitivity: 76.0%, Specificity: 71.0%, PPV: 51.4%, NPV: 88.0%), and 0.69 (MIR34B/C: Sensitivity: 84.0%, Specificity: 50.0%, PPV: 40.4%, NPV: 88.6%), respectively. (B) Combined ROC analysis revealed that methylation panel of MIR1, MIR9, MIR124, MIR137,and MIR34B/C inrectalnon-neoplastic mucosa could discriminate UC patients with neoplasia from those without in the clinical evaluation cohort. Combined ROC analyses for methylation levels revealed AUC values of0.85(95%CI: 0.75–0.92) with92.3% sensitivity and62.9% specificityindiscriminating UC-associated cancer (left panel), 0.80 (95% CI: 0.69–0.88) with 83.3% sensitivity and 69.4% specificity in discriminating UC-associated dysplasia (middle panel), and 0.81 (95% CI: 0.71–0.88) with 80.0% sensitivity and 74.2% specificity in discriminating UC-associated dysplasia or cancer (right panel). (C) ROC curve analysis demonstrated that methylation levels of MIR1, MIR9, MIR124, MIR137, and MIR34B/C in non-neoplastic rectal mucosa could distinguish patients with UC-associated neoplasia from those without in the external validation cohort. The upper panels represent ROC curve analysis of miRNA methylation discriminating UC patients with cancer from those without cancer, with high NPV and AUC values of MIR1 (Sensitivity: 58.2%, Specificity: 81.1%, PPV: 65.3%, NPV: 76.0%, AUC: 0.71), MIR9 (Sensitivity: 82.1%, Specificity: 51.1%, PPV: 51.1%, NPV: 82.1%, AUC: 0.7), MIR124 (Sensitivity: 78.6%, Specificity: 60.0%, PPV: 55.0%, NPV: 81.8%, AUC: 0.68), MIR137 (Sensitivity: 85.7%, Specificity: 57.8%, PPV: 55.8%, NPV: 86.7%, AUC: 0.77), and MIR34B/C (Sensitivity: 76.8%, Specificity: 56.7%, PPV: 52.4%, NPV: 79.7%, AUC: 0.7), respectively. (D) Combined ROC analysis revealed that methylation panel of MIR1, MIR9, MIR124, MIR137, and MIR34B/C in rectal non-neoplastic mucosa could discriminate UC patients with neoplasia from those without in the external validation cohort. Combined ROC analyses for the methylation levels revealed AUC values of 0.78 (95% CI: 0.71–0.85) with 67.3% sensitivity and 82.2% specificity in discriminating UC-associated cancer (left panel), and 0.78 (95% CI: 0.7–0.84) with 65.0% sensitivity and 81.1% specificity in discriminating UC-associated dysplasia or cancer (right panel).
Figure 4
Figure 4
Expression of MIR1, MIR9, MIR124, MIR137, and MIR34C in tissues from UC patients. (A) Expression levels of age-associated miRNAs in non-neoplastic UC mucosa (N, n=20), dysplasia (D, n=12), and cancer (C, n=13). The Y-axis represents relative expression of miRNAs normalized to MIR16 expression. Statistically significant differences were determined using Mann–Whitney tests and Kruskal–Wallis tests. When multiple hypothesis testing was performed, the P value for significance was adjusted to .017 (= .05/3) by Bonferroni correction. (B) Scatter plots of MIR1, MIR9, MIR124, MIR137, and MIR34B/C show correlations between expression levels (Y-axis) and methylation levels (X-axis) in samples obtained from UC patients with dysplasia and cancer. Negative correlations were found for MIR1, MIR124, and MIR137 by Spearman correlation (MIR1; ρ= −0.44, P = .029, MIR124; ρ= −0.445, P = .026, MIR137; ρ= −0.57, P = .003).

Comment in

References

    1. Hata K, Watanabe T, Kazama S, et al. Earlier surveillance colonoscopy programme improves survival in patients with ulcerative colitis associated colorectal cancer: results of a 23-year surveillance programme in the Japanese population. Br J Cancer. 2003;89:1232–1236. - PMC - PubMed
    1. Kornbluth A, Sachar DB. Ulcerative colitis practice guidelines in adults (update): American College of Gastroenterology, Practice Parameters Committee. Am J Gastroenterol. 2004;99:1371–1385. - PubMed
    1. Fujii S, Fujimori T, Chiba T, et al. Efficacy of surveillance and molecular markers for detection of ulcerative colitis-associated colorectal neoplasia. J Gastroenterol. 2003;38:1117–1125. - PubMed
    1. Toyota M, Ahuja N, Ohe-Toyota M, et al. CpG island methylator phenotype in colorectal cancer. Proc Natl Acad Sci U S A. 1999;96:8681–8686. - PMC - PubMed
    1. Issa JP. Aging, DNA methylation and cancer. Crit Rev Oncol Hematol. 1999;32:31–43. - PubMed

Publication types

MeSH terms