. 2017 Oct 11;37(41):9977-9998.
doi: 10.1523/JNEUROSCI.0658-17.2017. Epub 2017 Aug 28.

A Population of Indirect Pathway Striatal Projection Neurons Is Selectively Entrained to Parkinsonian Beta Oscillations

Affiliations

A Population of Indirect Pathway Striatal Projection Neurons Is Selectively Entrained to Parkinsonian Beta Oscillations

Andrew Sharott et al. J Neurosci. .

Abstract

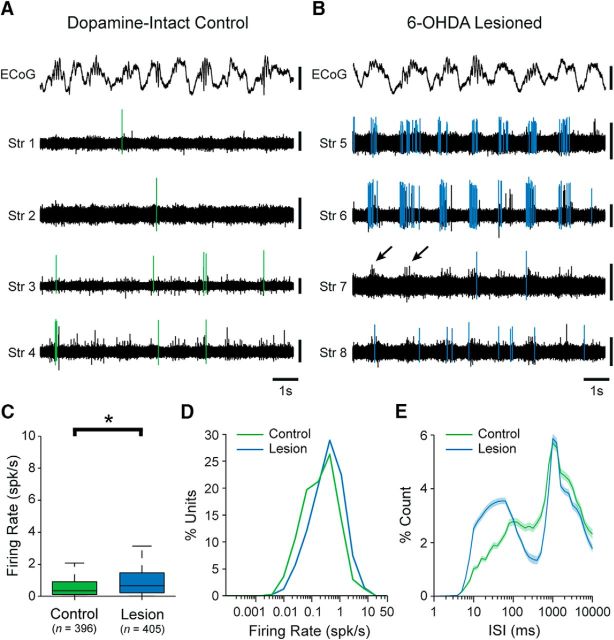
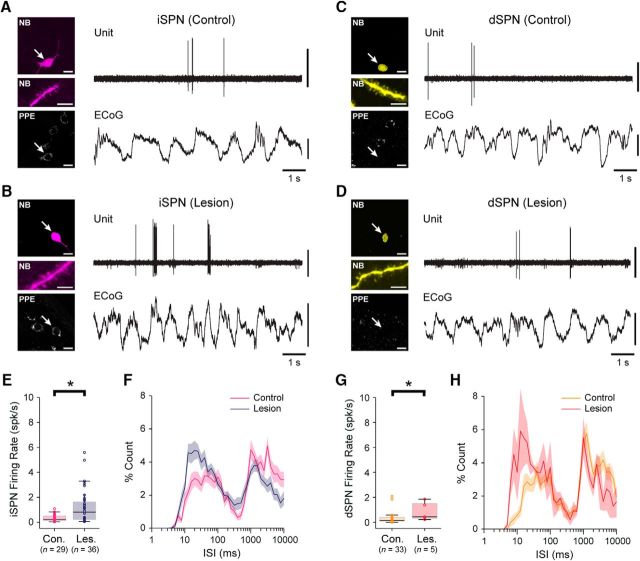
Classical schemes of basal ganglia organization posit that parkinsonian movement difficulties presenting after striatal dopamine depletion stem from the disproportionate firing rates of spiny projection neurons (SPNs) therein. There remains, however, a pressing need to elucidate striatal SPN firing in the context of the synchronized network oscillations that are abnormally exaggerated in cortical-basal ganglia circuits in parkinsonism. To address this, we recorded unit activities in the dorsal striatum of dopamine-intact and dopamine-depleted rats during two brain states, respectively defined by cortical slow-wave activity (SWA) and activation. Dopamine depletion escalated striatal net output but had contrasting effects on "direct pathway" SPNs (dSPNs) and "indirect pathway" SPNs (iSPNs); their firing rates became imbalanced, and they disparately engaged in network oscillations. Disturbed striatal activity dynamics relating to the slow (∼1 Hz) oscillations prevalent during SWA partly generalized to the exaggerated beta-frequency (15-30 Hz) oscillations arising during cortical activation. In both cases, SPNs exhibited higher incidences of phase-locked firing to ongoing cortical oscillations, and SPN ensembles showed higher levels of rhythmic correlated firing, after dopamine depletion. Importantly, in dopamine-depleted striatum, a widespread population of iSPNs, which often displayed excessive firing rates and aberrant phase-locked firing to cortical beta oscillations, preferentially and excessively synchronized their firing at beta frequencies. Conversely, dSPNs were neither hyperactive nor synchronized to a large extent during cortical activation. These data collectively demonstrate a cell type-selective entrainment of SPN firing to parkinsonian beta oscillations. We conclude that a population of overactive, excessively synchronized iSPNs could orchestrate these pathological rhythms in basal ganglia circuits.SIGNIFICANCE STATEMENT Chronic depletion of dopamine from the striatum, a part of the basal ganglia, causes some symptoms of Parkinson's disease. Here, we elucidate how dopamine depletion alters striatal neuron firing in vivo, with an emphasis on defining whether and how spiny projection neurons (SPNs) engage in the synchronized beta-frequency (15-30 Hz) oscillations that become pathologically exaggerated throughout basal ganglia circuits in parkinsonism. We discovered that a select population of so-called "indirect pathway" SPNs not only fire at abnormally high rates, but are also particularly prone to being recruited to exaggerated beta oscillations. Our results provide an important link between two complementary theories that explain the presentation of disease symptoms on the basis of changes in firing rate or firing synchronization/rhythmicity.

Keywords: Parkinson's disease; basal ganglia; dopamine; electrophysiology; oscillations; striatum.


Figures

Figure 1.
Figure 1.
Unit activity in the dorsal striatum of dopamine-intact and 6-OHDA-lesioned rats during cortical slow-wave activity. A, Striatal unit activity simultaneously recorded with a silicon probe during cortical slow-wave activity in a dopamine-intact control rat. Spikes fired by a single unit recorded on each of the striatal probe contacts (Str 1–4) are highlighted in green. During cortical slow-wave activity, the ECoG is dominated by a large-amplitude slow (∼1 Hz) oscillation. B, Simultaneous recordings of striatal unit activity in a lesioned rat. Spikes fired by a single unit recorded on each of the striatal probe contacts (Str 5–8) are highlighted in blue. Note the rhythmic variations in the background-unit activity (arrows). C, Mean firing rates of all striatal single units recorded in control and lesioned rats. On average, striatal units fired at significantly higher rates in lesioned rats. Number of single units included in each group is shown in parentheses. D, Histogram of the firing rates of all single units in control and lesioned rats. E, Normalized ISI histograms (mean ± SEM) of all single units in control or lesioned rats. Vertical calibration bars: A, B, 0.5 mV (ECoG); 0.1 mV (units). *p < 0.05 (Mann–Whitney U test).
Figure 2.
Figure 2.
Temporal organization of single-unit and ensemble firing in the dorsal striatum of dopamine-intact and 6-OHDA-lesioned rats during cortical slow-wave activity. A, B, Mean linear-phase histograms of the firing of all striatal single units (top) and circular plots of the preferred firing angles of significantly phase-locked units (bottom), with respect to cortical slow oscillations (0.4–1.6 Hz) recorded in dopamine-intact control rats (A) and lesioned rats (B). In linear-phase histograms, two cycles of the cortical slow oscillation are shown for clarity. In circular plots, vectors of the preferred firing of individual units are shown as thin lines radiating from the center. Greater vector lengths indicate lower variance in the distribution of spikes around the mean phase angle of an individual unit. Each circle on the plot perimeter represents the preferred phase angle of an individual unit. Thick black lines radiating from the center indicate the mean phase angle of all striatal units in that group. Note that striatal units in control and lesioned rats tended to fire just before the peak (0°/360°) of the cortical slow oscillation. C, Examples of normalized (z-scored) cross-correlograms for a pair of striatal single units recorded during cortical slow-wave activity in a control rat (green) and for another pair of single units recorded in a lesioned rat (blue). D, Mean normalized cross-correlograms for all striatal unit pairs recorded in controls (green) and lesioned rats (blue). E, Histograms of significant, positive correlations (z-score >; 2) in spike firing for all pairs of striatal units in controls (green) and for all pairs of units in lesioned rats (blue). Note that histograms of unit pairs in lesioned rats exhibited larger central peaks with clearer side lobes, indicating more highly synchronized firing with a more pervasive slow oscillatory component. F, Mean power spectra of all measures of striatal BUA in controls (green) and lesioned rats (blue). G, Mean power spectra of all ECoGs that were simultaneously recorded with striatal signals in controls (green) and lesioned rats (blue). Inset shows mean power spectra of the respective striatal LFPs (Str. LFP). H, Mean transformed coherence between all ECoG–LFP pairs in controls (green) and lesioned rats (blue). Shaded areas in A, B, F–H show SEMs. Prob., Probability.
Figure 3.
Figure 3.
Spontaneous firing of indirect pathway SPNs and direct pathway SPNs during cortical slow-wave activity in dopamine-intact and 6-OHDA-lesioned rats. A, B, Left side, single-plane confocal fluorescence micrographs of indirect pathway SPNs, identified after labeling with neurobiotin (NB) by their densely spiny dendrites (middle panels), in a dopamine-intact control rat (A) and a lesioned rat (B). Both SPNs (arrows) expressed immunoreactivity for PPE, confirming them to be iSPNs (bottom). Also see Fig. 3-1. Right side, The action potentials spontaneously fired by the same identified iSPNs (unit) during cortical slow-wave activity, as verified in ECoG recordings. Note that, after dopamine depletion, iSPNs tend to fire spikes more frequently. C, D, Micrographs of NB-labeled direct pathway SPNs in a control rat (C) and a lesioned rat (D). Neither SPN expressed immunoreactivity for PPE, identifying them as dSPNs. E, Firing rates of identified iSPNs in control (Con.) and lesioned (Les.) rats. On average, iSPNs fired at significantly higher firing rates in lesioned rats. Number of SPNs included in each group is shown in parenthesis. F, Mean ISI histograms for iSPNs recorded in control or lesioned rats (shaded areas show SEMs). G, Firing rates of identified dSPNs in control and lesioned rats. On average, dSPNs fired at significantly higher firing rates in lesioned rats. H, Mean ISI histograms for dSPNs. Scale bars: A–D, 20 μm; images of dendrites, 5 μm. Vertical calibration bars: A–D, 0.5 mV (ECoG); 1 mV (units). *p < 0.05 (Mann–Whitney U test).
Figure 4.
Figure 4.
Firing of indirect pathway SPNs and direct pathway SPNs with respect to cortical slow oscillations in dopamine-intact rats and 6-OHDA-lesioned rats. A, B, Mean linear phase histograms of the firing of all identified iSPNs (top) and circular plots of the preferred firing angles of significantly phase-locked iSPNs (bottom) recorded in dopamine-intact control rats (A) and lesioned rats (B). For clarity, two cycles of the cortical slow oscillation (0.4–1.6 Hz) are shown in linear-phase histograms (shaded areas show SEMs). Thick black line in each circular plot indicates the mean phase angle of that group of SPNs. In both controls and lesioned rats, iSPNs tended to phase lock their firing around the peaks of the cortical slow oscillations. C, D, Mean linear-phase histograms and circular plots of the firing of identified dSPNs recorded in control rats (C) and lesioned rats (D). The dSPNs also tended to fire around the peaks of the cortical slow oscillations. Prob., Probability.
Figure 5.
Figure 5.
Unit activity in the dorsal striatum of dopamine-intact and 6-OHDA-lesioned rats during spontaneous cortical activation. A, Striatal unit activity simultaneously recorded with a silicon probe during cortical activation in a dopamine-intact control rat. Spikes fired by a single unit recorded on each of the striatal probe contacts (Str 9–12) are highlighted in green. During the activated brain state, cortical activity is dominated by relatively small-amplitude high-frequency oscillations, as verified in ECoG recordings. B, Simultaneous recordings of striatal unit activity in a lesioned rat. Spikes fired by a single unit recorded on each of the striatal probe contacts (Str 13–16) are highlighted in blue. C, Mean firing rates of all striatal single units recorded in control and lesioned rats. On average, striatal units fired at significantly higher rates in lesioned rats. Number of single units included in each group is shown in parentheses. D, Histogram of the firing rates of all single units in control and lesioned rats. E, Normalized ISI histograms (mean ± SEM) of all single units in control or lesioned rats. Vertical calibration bars: A, B, 0.5 mV (ECoG); 0.1 mV (units). *p < 0.05 (Mann–Whitney U test).
Figure 6.
Figure 6.
Temporal organization of striatal single-unit activity with respect to cortical beta oscillations in dopamine-intact rats and 6-OHDA-lesioned rats. A, Mean power spectra of all ECoGs and all striatal LFPS simultaneously recorded during spontaneous cortical activation in dopamine-intact control rats (green) and lesioned rats (blue). B, Mean transformed coherence between all ECoG–LFP pairs in controls and lesioned rats. Note the peak in coherence in the beta-frequency range (15–30 Hz) in lesioned rats. C, Mean linear-phase histograms of the firing of all striatal single units with respect to the cortical beta oscillations (15–30 Hz) recorded during the activated brain state in controls (green) and lesioned rats (blue). For clarity, two cortical beta-oscillation cycles are shown. D, Proportions of striatal single units that fired in a significantly phase-locked manner to cortical beta oscillations in controls and lesioned rats. Total numbers of striatal units tested are in parentheses. Note that, after dopamine depletion, a much larger proportion of striatal units fired in time with the cortical beta oscillations. E, F, Circular plots of the preferred firing angles of significantly phase-locked striatal units recorded in lesioned rats (E) and controls (F). Note that, in lesioned rats, striatal units tended to fire around the troughs of the cortical beta oscillations. Shaded areas in A–C show SEMs.
Figure 7.
Figure 7.
Synchronization of striatal unit activity during cortical activation in dopamine-intact and 6-OHDA-lesioned rats. A, B, Representative examples of normalized (z-scored) cross-correlograms for a pair of striatal single units recorded during cortical activation in a control rat (A, in green) and for another pair of single units recorded in a lesioned rat (B, in blue). C, D, Histograms of significant, positive correlations (z-score >; 2) in spike firing for all pairs of striatal units in controls (C, in green) and for all pairs of units in lesioned rats (D, in blue). Note that cross-correlations of unit pairs in lesioned rats often exhibited comparatively higher central peaks and more prominent side lobes with intervals of 40–50 ms, indicating a more prevalent beta oscillatory component in their synchronized firing. E, Power spectra of the normalized cross-correlograms of all striatal unit pairs recorded in control and lesioned rats. Note the prominent peak in synchronized firing in the beta-frequency range in lesioned rats. F, Mean power spectra of all measures of striatal BUA in controls and lesioned rats. Shaded areas in E and F show SEMs. AU, Arbitrary units.
Figure 8.
Figure 8.
Spontaneous firing of indirect pathway SPNs and direct pathway SPNs during cortical activation in dopamine-intact and 6-OHDA-lesioned rats. A, B, Left side, Single-plane confocal fluorescence micrographs of indirect pathway SPNs, identified after labeling with neurobiotin (NB) by their densely spiny dendrites (middle panels), in a dopamine-intact control rat (A) and a lesioned rat (B). Both SPNs (arrows) expressed immunoreactivity for PPE, confirming them to be iSPNs (bottom). Right side, The action potentials spontaneously fired by the same identified iSPNs (unit) during cortical activation, as verified in ECoG recordings. Note that, after dopamine depletion, iSPNs tend to fire spikes more frequently. C, D, Micrographs of NB-labeled direct pathway SPNs in a control rat (C) and a lesioned rat (D). Neither SPN expressed immunoreactivity for PPE, identifying them as dSPNs. E, Firing rates of identified iSPNs in control (Con.) and lesioned (Les.) rats. On average, iSPNs fired at significantly higher firing rates in lesioned rats. The number of SPNs included in each group is shown in parenthesis. F, Mean ISI histograms for iSPNs recorded in control or lesioned rats (shaded areas show SEMs). G, Firing rates of identified dSPNs in control and lesioned rats. There were no significant differences in the firing rates of dSPNs in each group. H, Mean ISI histograms for dSPNs. Scale bars, A–D, 20 μm; images of dendrites, 5 μm. Vertical calibration bars: A–D, 0.5 mV (ECoG); 1 mV (units). *p < 0.05 (Mann–Whitney U test).
Figure 9.
Figure 9.
Firing of indirect pathway SPNs and direct pathway SPNs with respect to cortical beta oscillations in dopamine-intact rats and 6-OHDA-lesioned rats. A, Proportions of iSPNs and dSPNs that fired in a significantly phase-locked manner to cortical beta oscillations at 15–30 Hz during the activated brain state in dopamine-intact control rats (Con.) and lesioned rats (Les.). B, C, Mean linear-phase histograms of the firing of all iSPNs recorded in control rats (B) and lesioned rats (C) during cortical activation. For clarity, two cortical beta-oscillation cycles are shown. Shaded areas show SEMs. Note that iSPNs in lesioned rats were more consistent in their phase locking to cortical beta oscillations. D, Circular plot of the preferred firing angles of significantly phase-locked iSPNs in lesioned rats; these neurons tended to fire around the troughs of the cortical beta oscillations. E, Comparison of the firing rates of iSPNs, divided according to whether their firing was significantly phase locked (Sig.) or not significantly locked (Non-Sig.) to cortical beta oscillations. The significance of phase locking was evaluated using both the Rayleigh test (Ray.; left) and a rate-normalized z-score (Z; right). In both cases, the iSPNs that were significantly phase locked to cortical beta oscillations had, on average, higher firing rates than the iSPNs that were not significantly locked. F, The rate-normalized z-score of iSPN-phase locking was significantly and positively correlated with firing rate (Spearman correlation). *p < 0.05 (Mann–Whitney U test).
Figure 10.
Figure 10.
Some indirect pathway SPNs and direct pathway SPNs are quiescent during the activated brain state in 6-OHDA-lesioned rats. A, Quiescent iSPN recorded during the activated brain state in a lesioned rat. The iSPN was revealed by paired electrical stimulation of the motor cortex (periods of stimulation are indicated by gray bars). Raw data show unsorted unit activity and stimulus artifacts in striatum (signals truncated for clarity). “Sorted Unit” indicates the occurrence of spike firing by the individual identified iSPN. Note that, in the absence of cortical stimulation, the iSPN does not spontaneously fire any spikes for an extended period of recording (hundreds of seconds). The iSPN was thus defined as effectively quiescent. After the recording of spontaneous unit activity, cortical stimulation was resumed and the iSPN was correspondingly driven to fire spikes. Black and white triangles indicate epochs that are shown in B at higher resolution. B, Representative traces of the short-latency responses of the same iSPN to the paired cortical stimulation (Stim. 1, Stim. 2; 100 ms interval between each stimulus) delivered before the extended period of quiescence (top traces, stimulus delivery marked by black triangles) and after the period of quiescence (bottom traces, stimulus delivery marked by white triangles). Stimulation-evoked spikes are highlighted in violet; note that the spikes are of a similar shape, magnitude, and duration in the stimulation periods before and after the registration of spontaneous firing, indicating the iSPN was proximate to the recording electrode throughout. C, D, Same as in A and B but for a quiescent dSPN recorded during the activated brain state in a lesioned rat. Stimulation-evoked spikes of the dSPN are highlighted in red. Vertical calibration bars: A–D, 1 mV.
Figure 11.
Figure 11.
Distributions of recorded and identified SPNs in dopamine-intact rats and 6-OHDA-lesioned rats. A, Locations of PPE+ iSPNs and PPE dSPNs recorded in dopamine-intact control rats (left) and lesioned rats (right), as mapped on seven parasagittal sections of dorsal striatum (from 2.1 to 3.7 mm lateral of Bregma). M, medial; L, lateral; R, rostral; C, caudal; D, dorsal; V, ventral. Each circle represents either an iSPN (magenta, recorded in controls; dark blue, in lesioned rats) or a dSPN (orange, recorded in controls; red, in lesioned rats). BD, Firing rate of each iSPN recorded in lesioned rats during the activated brain state plotted against its location in the mediolateral (B), rostrocaudal (C), and dorsoventral (D) axes of striatum. Locations are reported with respect to Bregma. The firing rates of these iSPNs were not significantly correlated with their locations along any axis. EG, Comparisons of the mediolateral (E), rostrocaudal (F), and dorsolateral (G) locations of the same iSPNs as a function of whether their firing was significantly phase locked (Sig.) or not (Non-Sig.) to cortical beta oscillations. The iSPNs with significantly phase-locked firing were located more lateral than iSPNs that were not phase locked (E). H, Enriched immunoreactivity for MOR1 reveals the striosome compartments of the dorsolateral striatum. I, Example of a neurobiotin (NB)-labeled neuron with a soma located within a striosome expressing high levels of MOR1. J, Firing rates of all iSPNs recorded during cortical activation in lesioned rats as a function of their locations in striosomes or matrix. The firing rates of the striosome iSPNs were toward the lower end of the range of firing rates of matrix iSPNs. Scale bars: A, 1.5 mm; H, I, 200 μm. *p < 0.05 (Mann–Whitney U test).
Figure 12.
Figure 12.
Dopamine depletion is associated with a selective increase in the synchronization of firing in neuronal ensembles enriched for putatively-classified indirect pathway SPNs. AC, Histograms of significant, positive correlations in spike firing for pairs of putative iSPNs (A, in violet), for pairs consisting of one putative iSPN and one putative mSPN (B, in black), and for pairs of putative mSPNs (C, in red). Single units recorded with silicon probes during the activated brain state in lesioned rats were classified as putative iSPNs when their firing properties met the criteria that enrich ensembles for iSPNs, whereas the single units not meeting these criteria were classified as putative mSPNs. Cross-correlograms between pairs of putative SPNs were calculated and converted to a z-score using ISI-shuffled surrogate spike trains with identical mean firing rates and ISI distributions to the real data. Also see Fig. 12-1. Note that only the pairs of putative iSPNs (A) had a strong beta-oscillatory component in their synchronized firing, as indicated by a relatively high central peak around zero lag as well as prominent side lobes with intervals of 40–50 ms. D, E, Normalized (z-scored) cross-correlograms (D), and their corresponding power spectra (E), for the three pair types in A–C. Ensembles enriched for putative iSPNs (purple) exhibited the most prevalent synchronization of spike firing at beta-oscillation frequencies. F, Mean percentage of significant correlations (at zero lag) in the three pair types as a function of the spatial separation between the paired units. There were approximately twice as many synchronized pairs of putative iSPNs than other pair types for most distances of up to 800 μm. Data in E are means, with shaded areas indicating 99% confidence intervals. Colors in D–F are as in A–C.

Comment in

References

    1. Abdi A, Mallet N, Mohamed FY, Sharott A, Dodson PD, Nakamura KC, Suri S, Avery SV, Larvin JT, Garas FN, Garas SN, Vinciati F, Morin S, Bezard E, Baufreton J, Magill PJ (2015) Prototypic and arkypallidal neurons in the dopamine-intact external globus pallidus. J Neurosci 35:6667–6688. 10.1523/JNEUROSCI.4662-14.2015 - DOI - PMC - PubMed
    1. Ahn S, Zauber SE, Worth RM, Rubchinsky LL (2016) Synchronized beta-band oscillations in a model of the globus pallidus-subthalamic nucleus network under external input. Front Comput Neurosci 10:134. 10.3389/fncom.2016.00134 - DOI - PMC - PubMed
    1. Arlotta P, Molyneaux BJ, Jabaudon D, Yoshida Y, Macklis JD (2008) Ctip2 controls the differentiation of medium spiny neurons and the establishment of the cellular architecture of the striatum. J Neurosci 28:622–632. 10.1523/JNEUROSCI.2986-07.2008 - DOI - PMC - PubMed
    1. Avila I, Parr-Brownlie LC, Brazhnik E, Castañeda E, Bergstrom DA, Walters JR (2010) Beta frequency synchronization in basal ganglia output during rest and walk in a hemiparkinsonian rat. Exp Neurol 221:307–319. 10.1016/j.expneurol.2009.11.016 - DOI - PMC - PubMed
    1. Ballion B, Frenois F, Zold CL, Chetrit J, Murer MG, Gonon F (2009) D2 receptor stimulation, but not D1, restores striatal equilibrium in a rat model of Parkinsonism. Neurobiol Dis 35:376–384. 10.1016/j.nbd.2009.05.019 - DOI - PubMed

Publication types

LinkOut - more resources