. 2017 Oct 2;214(10):3105-3122.
doi: 10.1084/jem.20170335. Epub 2017 Aug 28.

Dendritic cell and antigen dispersal landscapes regulate T cell immunity

Affiliations

Dendritic cell and antigen dispersal landscapes regulate T cell immunity

Michael Y Gerner et al. J Exp Med. .

Abstract

Dendritic cell (DC) subsets with biased capacity for CD4+ and CD8+ T cell activation are asymmetrically distributed in lymph nodes (LNs), but how this affects adaptive responses has not been extensively studied. Here we used quantitative imaging to examine the relationships among antigen dispersal, DC positioning, and T cell activation after protein immunization. Antigens rapidly drained into LNs and formed gradients extending from the lymphatic sinuses, with reduced abundance in the deep LN paracortex. Differential localization of DCs specialized for major histocompatibility complex I (MHC I) and MHC II presentation resulted in preferential activation of CD8+ and CD4+ T cells within distinct LN regions. Because MHC I-specialized DCs are positioned in regions with limited antigen delivery, modest reductions in antigen dose led to a substantially greater decline in CD8+ compared with CD4+ T cell activation, expansion, and clonal diversity. Thus, the collective action of antigen dispersal and DC positioning regulates the extent and quality of T cell immunity, with important implications for vaccine design.


Figures

Figure 1.
Figure 1.
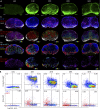
Soluble antigen dispersal and DC-mediated uptake in LNs. (A) Mice were injected with EαGFP in the footpad, and draining popliteal LNs were isolated at the indicated time points for visualization of antigen dispersal, as well as uptake by LN-resident DCs. (I) Visualization of the overall EαGFP dispersal across LNs. (II) Identification of stromal elements within LNs, with Lyve-1 (white) signal demarcating the LS, Meca79 (red) staining highlighting the HEVs, and collagen-IV (ColI.IV, blue) staining predominantly denoting the LN conduits. Accompanying gp38 staining of conduits is shown in Fig. S1. (III) Quantitative heat-map analysis of EαGFP signal within conduits, as generated by creating surface objects around LN conduits and quantifying mean EαGFP fluorescence. (IV) Localization of CD11cHIGHMHC-IIINTCD169 LN-resident SIRPa cDC1 (cyan) and SIRPa+ cDC2 (red), with respect to B cells (blue) and CD169+ macrophages (yellow). (V) Quantitative heat-map analysis of EαGFP signal within DCs (EαGFP signal gated within CD11c+Coll.IVLyve1Meca79gp38 voxels). Bars, 200 µm. (B) Conduits (top) and DCs (bottom) from A were quantified for total EαGFP content with respect to distance from the nearest LS. Data represent at least two independent experiments. Numbers in plots represent frequencies.
Figure 2.
Figure 2.
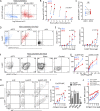
DC subset positioning influences in vivo antigen uptake and MHC II presentation. (A–C) Additional quantitative analysis of data presented in Fig. 1. (A) Relative EαGFP uptake by LN-resident cDC1 and cDC2 with respect to distance to the LS in LNs isolated 4 h after immunization. (B) Comparison of the frequency of EαGFP-positive DCs at the indicated time points. (C) EαGFP-positive cDC1 and cDC2 cells located in close proximity to the LS (LS-Prox), as defined by the top left quadrant in A, were examined for the geometric mean fluorescence intensity (gMFI) of EαGFP 1–6 h after immunization. (D and E) Flow cytometry analysis of EαGFP uptake and MHC II presentation (pMHC II) by DC subsets 4 h after immunization. (F and G) Isolated DCs were cultured in vitro with EαGFP for 1 h, washed, and further cultured for 3 h, after which they were examined for EαGFP uptake and MHC II presentation by flow cytometry. (H) Mice were injected with EαGFP or EαGFP-APC, and DC subsets were examined for antigen uptake by flow cytometry. (I) Frequency of antigen-positive cDC1 and cDC2 cells was enumerated (left). Frequencies of antigen-positive DCs, macrophages (Macs), and B cells were compared between EαGFP and EαGFP-APC after administration of 10–20 µg antigen (right). (J) EαGFP MFI was quantified for EαGFP-positive DCs after administration of the indicated quantities of EαGFP and EαGFP-APC antigen. Data represent at least two independent experiments. Dashed lines in B, C, E, and I connect cells within the same draining LNs. Paired t test was used for comparing cells within the same LNs. Unpaired t test was performed in I. Numbers in flow cytometry and histo-cytometry plots represent frequencies. Error bars are mean ± SD. **, P ≤ 0.01; *, P ≤ 0.05; and NS, P > 0.05.
Figure 3.
Figure 3.
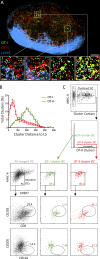
DC positioning governs the location of MHC I and MHC II presentation and CD8+ and CD4+ T cell activation. (A) Animals were injected with ∼3 × 10⁶ OT-I and OT-II T cells labeled with CMFDA (green) and CMTMR (red); 1 d later, they were immunized in the footpad with 10 µg OVA, along with Lyve-1 antibody conjugated to quantum dot 705 for labeling the LS (blue). After 6 h, draining popliteal LNs were isolated, fixed, sectioned into 150-µm slices, and examined with a two-photon 800-nm-wavelength laser for T cell cluster formation (zoom-in insets demonstrate discrete OT-I and OT-II clusters in different areas, as highlighted by cyan and white arrowheads, respectively). Bar, 200 µm. (B) Quantification of the frequency of T cell clusters with respect to the distance to the closest LS. Distance was calculated from the cluster center to the nearest detected Lyve1-stained vessel for all detected clusters. Error bars represent standard error for data from three independent animals. (C) CD45.2+ OT-I and CD45.2+CMTMR+ OT-II T cells were injected into CD45.1+ recipients, which were then immunized with OVA 1 d later. 6 h after immunization, draining LNs were isolated for histo-cytometry analysis of the phenotype of DCs in direct contact with T cell clusters. Numbers in plots represent frequencies. Image analysis pipeline described in Materials and methods. Data represent two independent experiments, three draining LNs per experiment.
Figure 4.
Figure 4.
Differential antigen dose requirements for early CD8+ and CD4+ T cell activation. (A and B) Mice were injected with ∼0.75 × 10⁶ OT-I and OT-II T cells and 1 d later immunized with the indicated doses of OVA. 12 h later, draining LNs were examined for the expression of CD69 and CD62L on transferred T cells by flow cytometry (A), with the percentage activated T cells (CD69+CD62L) quantified across individual animals (n = 4; B). (C) The same experimental procedure as in Fig. 3 A, examining the relative OT-I and OT-II T cell cluster formation after low-dose (2 µg) OVA immunization. Data were normalized to T cell cluster formation after high-dose (10 µg) OVA immunization. (D) Extended dataset of experiment presented in Fig. 3, examining the relative distribution of OT-I and OT-II T cell clusters with respect to distance to the nearest LS after low-dose (2 µg) or high-dose (10 µg) antigen administration. Error bars are mean ± SEM. (E and F) Mice were injected with ∼0.5 × 10⁶ P14 and Smarta T cells and immunized with the indicated doses of GP. 12 h after immunization, draining LNs were examined for expression of CD69 and CD62L on transferred T cells by flow cytometry (E), with the percentage activated T cells quantified across different animals (F). Data represent at least two independent experiments. Numbers in flow plots represent frequencies. Error bars are mean ± SD, unless otherwise indicated. ***, P ≤ 0.001; *, P ≤ 0.05.
Figure 5.
Figure 5.
Antigen dose–dependent regulation of polyclonal CD4+ and CD8+ T cell responses. (A) Mice were immunized in the footpad with indicated doses of recombinant GP along with CpG; 8 d later, spleens were examined for presence of H2-Db GP.Tetramer+ (GP.TET) CD8+ T cells and I-Ab GP.TET+ CD4+ T cells by flow cytometry. Tetramer+ cells were also examined for Vb2-14 staining (Vb8.1/2 demonstrates representative staining). (B) Enumeration of the total number of I-Ab GP.TET+ CD4+ and H2-Db GP.TET+ CD8+ T cells after immunization with the indicated doses of GP and CpG. Error bars are mean ± range. (C) Analysis of the Vb repertoire of the tetramer+ T cells. Bars indicate individual animals. (D) Enumeration of the total number of Vb families contributing to the CD4+ (I-Ab TET+) and CD8+ (H2-Db TET+) T cell responses to GP. Error bars are mean ± range. Paired t test was performed comparing the familial representation within the CD4+ versus CD8+ T cell response within the same mice. GP immunization data represent two independent experiments. (E) Mice were immunized with low (0.25 µg) or high (25 µg) doses of OVA protein along with CpG, and 7 d later spleens were examined for presence of H2-Kb OVA.TET+ CD8+ T cells. (F) Enumeration of the mean number of Vb families contributing to the total OVA-specific CD8+ T cell response. Mice lacking detectable responses (0.25 µg dose group) were excluded from analysis. Error bars are mean ± SD; n = 5. OVA immunization data represent at least three independent experiments. (G) Correlation analysis comparing the total number of Vb families participating in a given response and the total number of antigen-specific CD8+ T cells within that response. Responses against GP and OVA antigens were combined for analysis. For analyses of relative familial composition (D, F, and G), control nonimmunized samples were first used to determine the maximum potential contribution of nonspecific events in the Tetramer+ gates, and this value was used as a cutoff to enumerate the number of true responder families. Numbers in flow plots represent frequencies. **, P ≤ 0.01.

References

    1. Allenspach E.J., Lemos M.P., Porrett P.M., Turka L.A., and Laufer T.M.. 2008. Migratory and lymphoid-resident dendritic cells cooperate to efficiently prime naive CD4 T cells. Immunity. 29:795–806. 10.1016/j.immuni.2008.08.013 - DOI - PMC - PubMed
    1. Alloatti A., Kotsias F., Magalhaes J.G., and Amigorena S.. 2016. Dendritic cell maturation and cross-presentation: Timing matters! Immunol. Rev. 272:97–108. 10.1111/imr.12432 - DOI - PMC - PubMed
    1. Anandasabapathy N., Feder R., Mollah S., Tse S.W., Longhi M.P., Mehandru S., Matos I., Cheong C., Ruane D., Brane L., et al. . 2014. Classical Flt3L-dependent dendritic cells control immunity to protein vaccine. J. Exp. Med. 211:1875–1891. 10.1084/jem.20131397 - DOI - PMC - PubMed
    1. Baekkevold E.S., Yamanaka T., Palframan R.T., Carlsen H.S., Reinholt F.P., von Andrian U.H., Brandtzaeg P., and Haraldsen G.. 2001. The CCR7 ligand elc (CCL19) is transcytosed in high endothelial venules and mediates T cell recruitment. J. Exp. Med. 193:1105–1112. 10.1084/jem.193.9.1105 - DOI - PMC - PubMed
    1. Bajénoff M., Egen J.G., Koo L.Y., Laugier J.P., Brau F., Glaichenhaus N., and Germain R.N.. 2006. Stromal cell networks regulate lymphocyte entry, migration, and territoriality in lymph nodes. Immunity. 25:989–1001. 10.1016/j.immuni.2006.10.011 - DOI - PMC - PubMed

Publication types

MeSH terms