. 2017 Sep 12;114(37):E7812-E7821.
doi: 10.1073/pnas.1708044114. Epub 2017 Aug 28.

5-hydroxymethylcytosine accumulation in postmitotic neurons results in functional demethylation of expressed genes

Affiliations

5-hydroxymethylcytosine accumulation in postmitotic neurons results in functional demethylation of expressed genes

Marian Mellén et al. Proc Natl Acad Sci U S A. .

Abstract

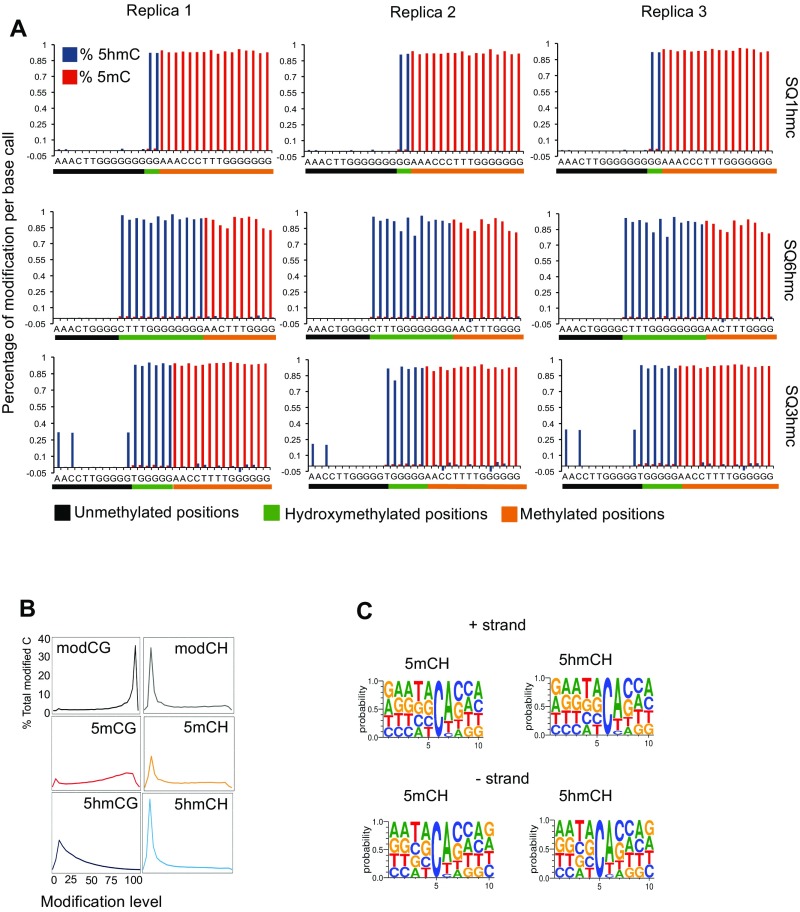
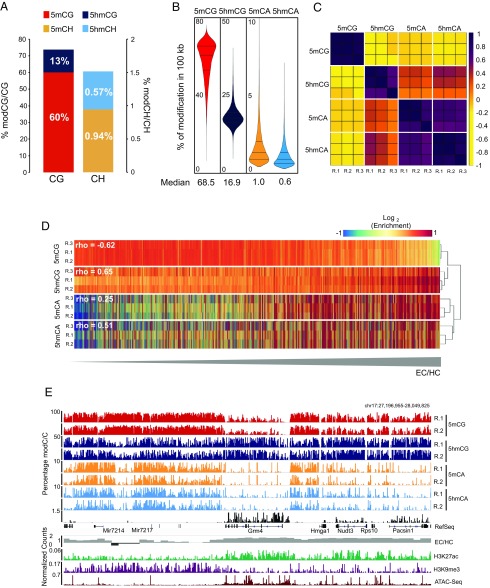
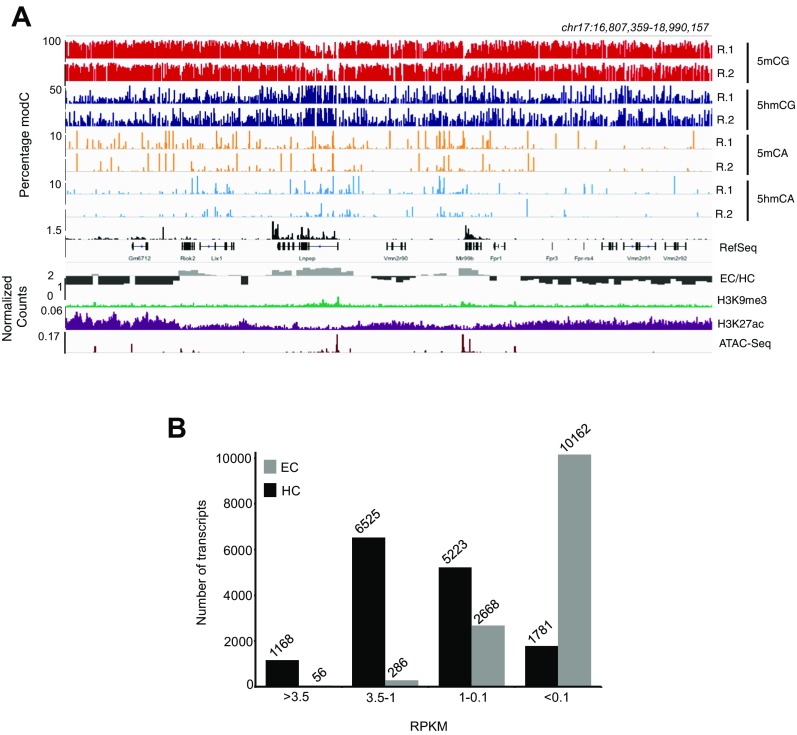
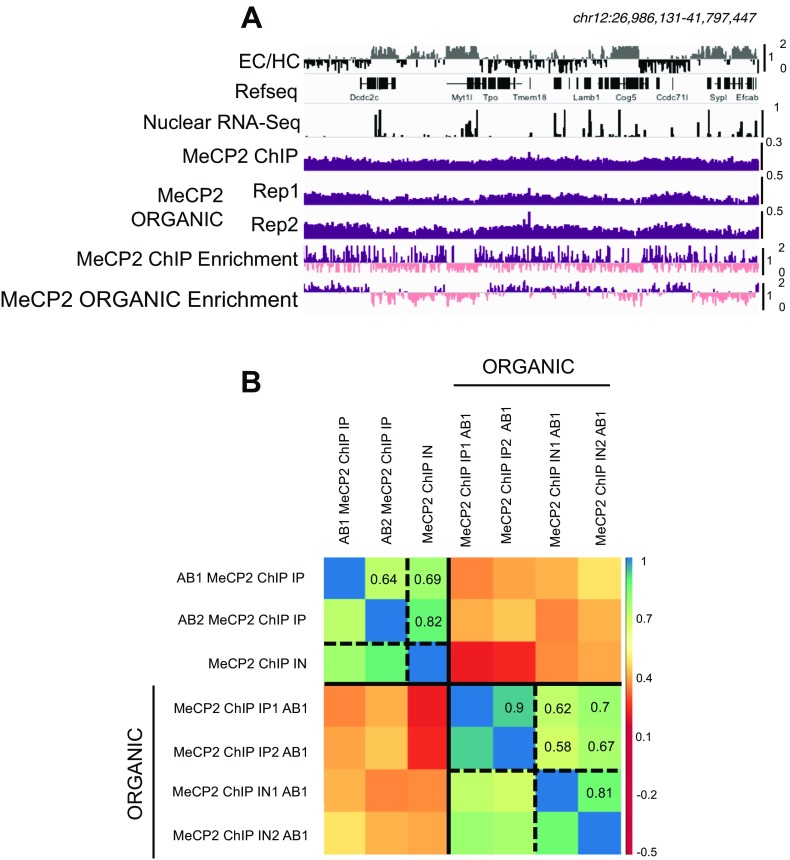
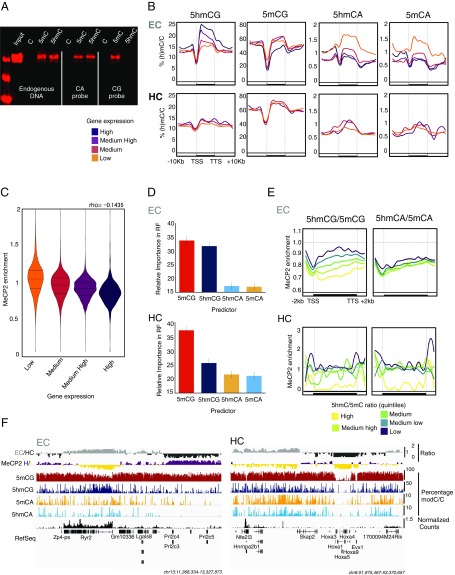
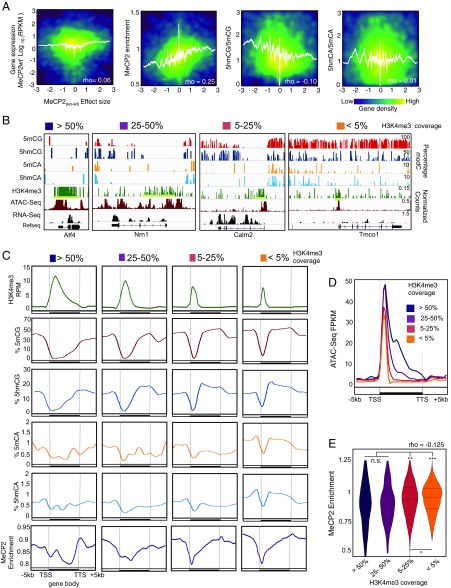
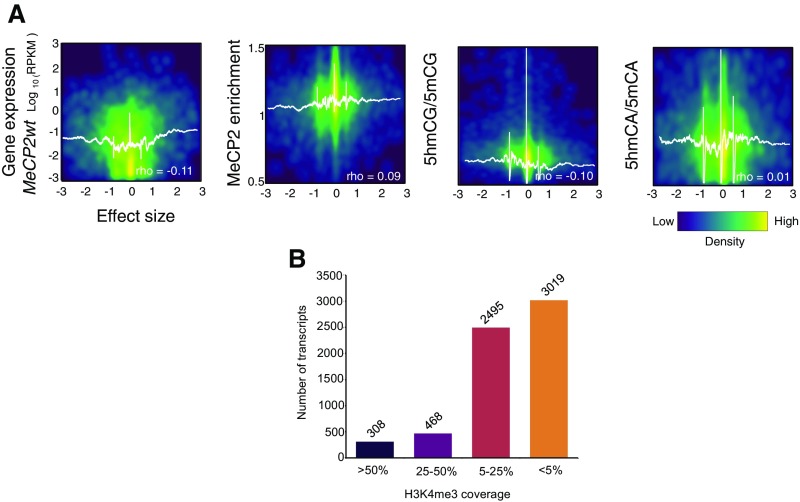
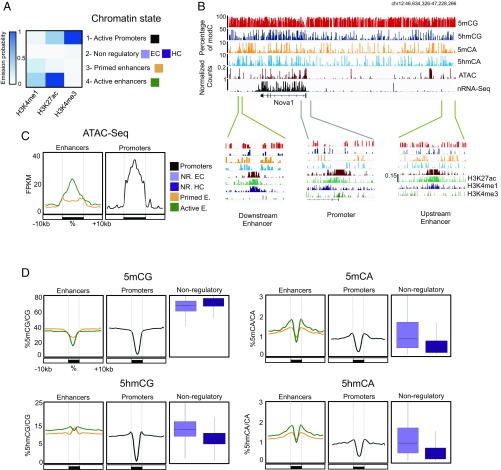
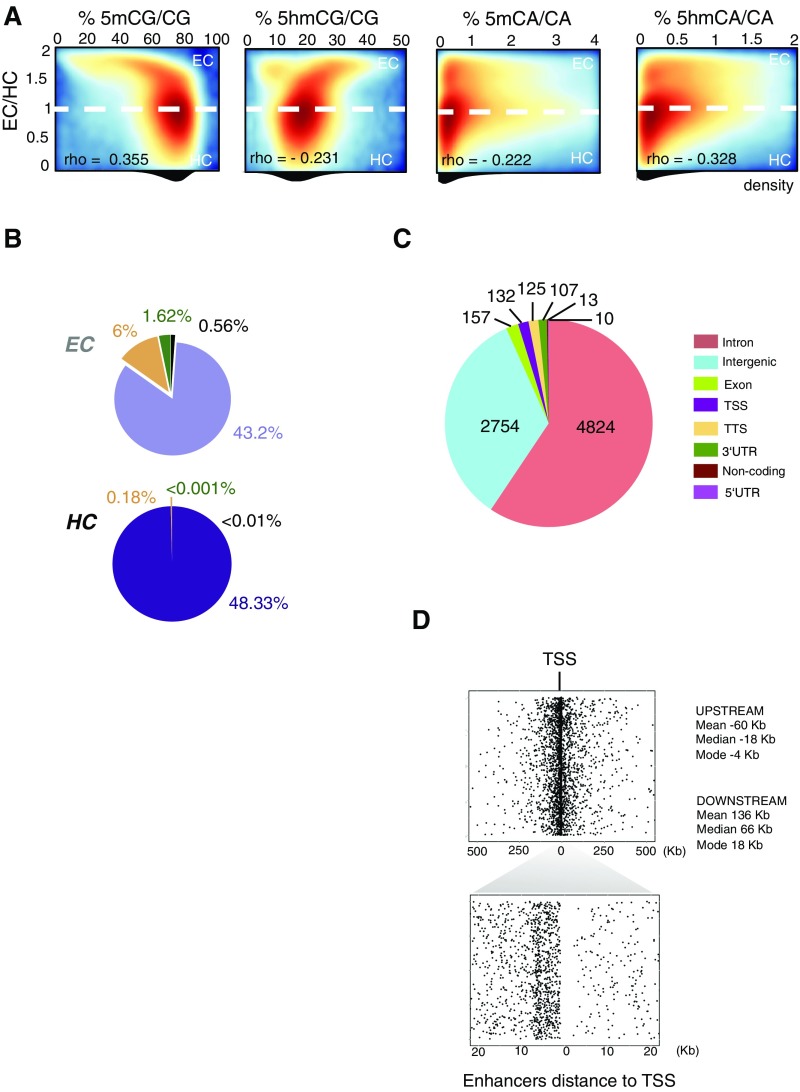
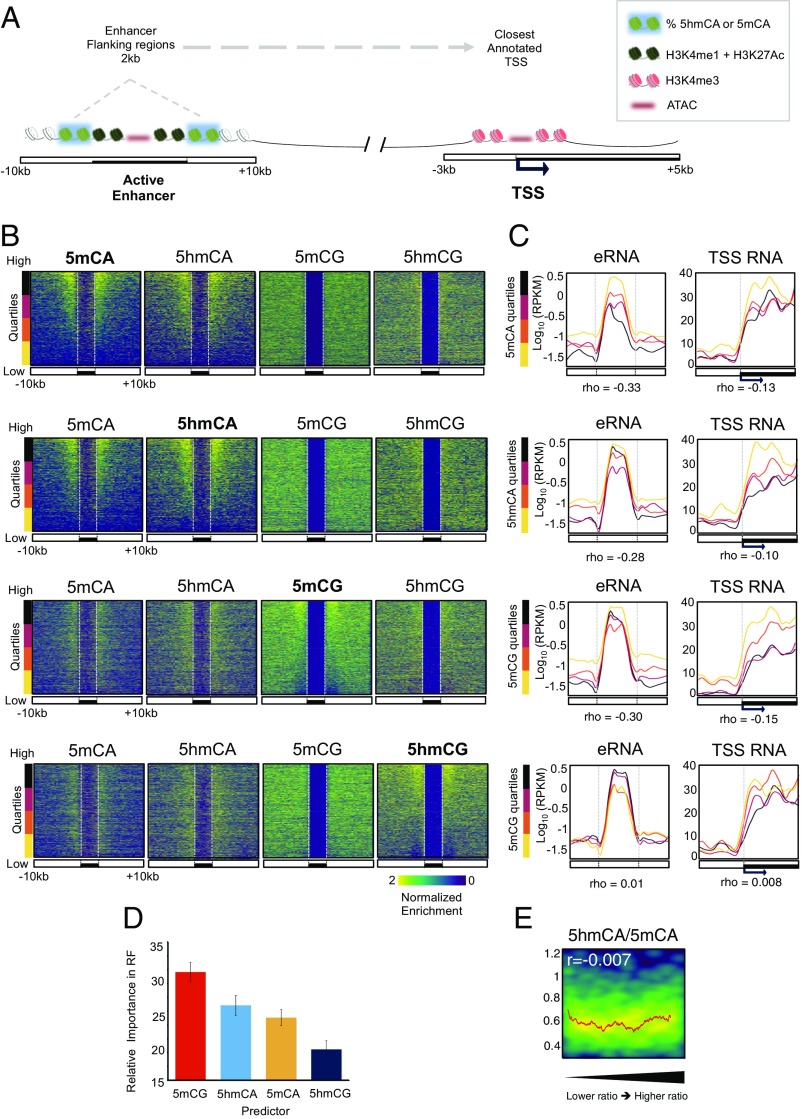
5-hydroxymethylcytosine (5hmC) occurs at maximal levels in postmitotic neurons, where its accumulation is cell-specific and correlated with gene expression. Here we demonstrate that the distribution of 5hmC in CG and non-CG dinucleotides is distinct and that it reflects the binding specificity and genome occupancy of methylcytosine binding protein 2 (MeCP2). In expressed gene bodies, accumulation of 5hmCG acts in opposition to 5mCG, resulting in "functional" demethylation and diminished MeCP2 binding, thus facilitating transcription. Non-CG hydroxymethylation occurs predominantly in CA dinucleotides (5hmCA) and it accumulates in regions flanking active enhancers. In these domains, oxidation of 5mCA to 5hmCA does not alter MeCP2 binding or expression of adjacent genes. We conclude that the role of 5-hydroxymethylcytosine in postmitotic neurons is to functionally demethylate expressed gene bodies while retaining the role of MeCP2 in chromatin organization.

Keywords: 5-hydroxymethylcytosine; MeCP2; epigenetics; neuron.


Conflict of interest statement

The authors declare no conflict of interest.

Figures

Fig. S1.
Fig. S1.
MethylC-Seq and oxBS-Seq quality control. (A) Quantitative assessment of 5mC and 5hmC percentages per base call in spike-in oligonucleotide controls (SQ1hmC, SQ3hmC, and SQ6hmC) sequences containing different amounts of modifications at known positions. Cytosines are organized based on their modification levels: Unmethylated base calls are labeled in black, 5hmC base calls are labeled in green, and methylated base calls are labeled in orange. The percentage of 5hmC and 5mC calculated is shown in blue and red, respectively, per position. (B) Distribution of the modification level in each sequence context. The y axis indicates the fraction of all cytosines that display each modification level (x axis, >0 modification level), where modification level is the modC/C ratio at each cytosine (at least 20 reads required). (C) Frequency plot showing residue frequencies from −5 to +5 positions of reference 5mC or 5hmC nucleotide per strand (cutoff 20 total reads, minimum modification level, third quartile).
Fig. 1.
Fig. 1.
5hmCG and 5hmCH occur predominantly in EC. (A) Percentage of base calls with each modification in the CG and CH contexts in granule cell genome. (B) Genome-wide distributions of 5mC and 5hmC in CG and CA contexts in 10-kb windows. Median values of each distribution are indicated below. (C) Correlation matrix of Pearson’s r of biological replicas (R.1, R.2, and R.3) of normalized cytosine modifications values in 100.kb windows. Samples are ordered by hierarchical clustering of modifications. (D) Heat-map representation of enrichment values of each cytosine modification genome-wide. Rows are ordered following EC/HC ratio. Higher values are more accessible (EC) and lower, less accessible (HC). Spearman correlation values between each modification and EC/HC are indicated. (E) Browser representation of a euchromatic region showing percentage of modification of individual sites for 5mCG, 5hmCG, 5mCA, and 5hmCA, in two independent biological replicas and nuclear RNA-Seq. EC/HC ratio in 10kb bins and the normalized counts for H3K9me3 and H3K27Ac ChIP-Seq and ATAC-Seq are also shown. Maximum enrichment levels or normalized counts are indicated on the top left corner. Genomic coordinates are shown on the top right corner of the plot. See also Fig. S2A.
Fig. S2.
Fig. S2.
5mCG is the only modification that occurs predominantly in HC. (A) Browser representation of HC (see Fig. 1E for EC) showing individual sites of 5mCG, 5hmCG, 5mCA, and 5hmCA in two independent biological replicas and in nuclear RNA-Seq. The three tracks at the bottom represent EC/HC ratio, H3K9me3, and H3K27ac ChIP-Seq and ATAC-Seq. (B) Number of transcripts on each expression category in EC (gray) and HC (black). High, >3.5; medium high, 3.5–1; medium, 1–0.1; and low, <0.1 RPKM.
Fig. S3.
Fig. S3.
ORGANIC MeCP2 ChIP quality control. (A) Browser representation of EC (gray), HC (black), nuclear RNA-Seq, MeCP2 ChIP, and MeCP2 ORGANIC ChIP-Seq counts in two biological replicas and MeCP2 enrichment relative to the input in both MeCP2 ChIP-Seq and ORGANIC MeCP2 ChIP-Seq. Purple and pink distinguish between >1 and ≤1 normalized enrichment. (B) Correlation matrix showing Pearson’s r correlations between two MeCP2 ChIP-Seq using two different antibodies (AB1 and AB2) and input (IN) and two ORGANIC MeCP2 ChIP-Seq (AB1) biological replicas and their inputs. RPKM in 1-Mb windows genome-wide are compared. Samples are ordered by hierarchical clustering.
Fig. 2.
Fig. 2.
5hmCG accumulation in expressed gene bodies results in functional demethylation. (A) Western blot of MeCP2 from DNA pulldowns of mouse cerebellar nuclear protein extracts. Endogenous DNA probe contains Cs in both CG and CA contexts; CA and CG synthetic DNA probes were designed to carry Cs only in CA or CG, respectively. 5hmC, 5hmC in DNA probe; 5mC, 5mC in DNA probe; C, DNA probe is unmodified. (B) Average percentage of modifications in EC and HC transcripts grouped according to their expression levels by nuclear RNA-Seq. High > 3.5; Medium High = 3.5–1; Medium = 1–0.1; Low < 0.1 reads per kilobase per million (RPKM). TTS, transcription termination site. (C) Violin plots of MeCP2 enrichment distribution in transcripts grouped according to their expression levels as described previously. Each pairwise comparison was significant (P < 10−16) by Wilcoxon–Mann–Whitney U test. (D) Relative importance of cytosine modifications in predicting MeCP2 binding in EC and HC transcripts using the random forest regressor algorithm. (E) Quantification of MeCP2 enrichment over EC and HC transcripts, grouped in quintiles according to their 5hmC/5mC ratio in CG context (Left) and CA context (Right). (F) Browser representation of EC (gray) and HC (black) regions, MeCP2 enrichment (purple ≥ 1, yellow < 1) in 10-kb bins, average percentage of 5mCG, 5hmCG, 5mCA, and 5hmCA in 100-bp bins, and nuclear RNA-Seq normalized counts. Maximum levels are represented on the top right corner of each track. Genomic coordinates are shown below.
Fig. 3.
Fig. 3.
5hmCG accumulation in gene bodies influences MeCP2 binding and impacts MeCP2-dependent gene expression regulation. (A) Density plots of EC transcripts showing correlations between the effect size [(MeCP2null − MeCP2wt)/SD pooled] and expression in the WT, MeCP2 enrichment, 5hmCG/5mCG ratio, and 5hmCA/5mCA ratio, respectively. White lines represent moving mean values of y axis grouped according to effect size (200 transcripts bins, one transcript step). RPKM, reads per kilobase per million. (B) Browser representation of examples in each H3K4me3 coverage category (>50%, 25–50%, 5–25%, and <5%) showing 5mCG, 5hmCG, 5mCA, and 5hmCA normalized enrichment in 100-bp bins, and H3K4me3, ATAC-Seq, and nuclear RNA-Seq normalized counts. Maximum enrichment levels or normalized counts are indicated on the top of the panel. (C) Average H3K4me normalized values (Upper) percentage of modifications (Middle) and MeCP2 enrichment (Lower) grouped according to their H3K4me3 coverage as described in B. TTS, transcription termination site. (D) Average ATAC-Seq normalized values per each H3K4me3 coverage category. (E) Violin plots of MeCP2 enrichment distribution in transcripts grouped according to H3k4me3 coverage levels as described previously. Each pairwise comparison is shown (n.s., not significant, *P < 10−8, **P < 10−12, ***P < 10−16 by Wilcoxon–Mann–Whitney U test).
Fig. S4.
Fig. S4.
MeCP2-dependent gene expression dysregulation affects preferentially euchromatic genes with H3K4me3 low coverage, but not heterochromatic genes. (A) Density plots of HC transcripts showing correlations between the effect size [(MeCP2null − MeCP2wt)/SD pooled] and expression in the WT, MeCP2 enrichment, 5hmCG/5mCG ratio, and 5hmCA/5mCA ratio, respectively. White lines represent moving mean values of y axes grouped according to effect size (200 transcripts bins, one transcript step). Spearman’s rho values are indicated. (B) Number of transcripts on each H3K4me3 category.
Fig. 4.
Fig. 4.
5hmCA is preferentially accumulated in active enhancer shores. (A) Four chromatin states were generated to define combinatorial patterns of H3K4me3, H3K27Ac, and H3K4me1. Color key reflects the frequencies of each chromatin mark in each state, as the emission probabilities of ChromHMM. (B) Browser representation of Nova1 genomic region showing average percentage of 5mCG, 5hmCG, 5mCA, and 5hmCA in 100-bp bins, and H3K4me3, H3K27Ac, and H3K4me1 ChIP-Seq, ATAC-Seq, and nuclear RNA-Seq normalized counts. Two examples of enhancers (46,655,945-46,678,317 and 47,144,638–47,177,401, respectively) and a promoter (46,798,150-46,836,857) are shown in closer detail in lower panels. Maximum values are represented on the top left corner of each track. (C and D) Average ATAC-Seq read coverage (C) and percentage of cytosine modifications (D) within and surrounding promoters and enhancers. In D, distributions of C modifications per each 1 kb from nonregulatory regions are plotted in boxplots.
Fig. S5.
Fig. S5.
Active enhancers are present in EC. (A) Density plots of 1-kb bins showing the relationship between chromatin state and percentage of cytosine modifications. Dotted line divides EC and HC area. Spearman’s rho values are indicated. (B) Distributions in EC and HC of the four states generated in Fig. 4. (C) Genome annotation of active enhancers. In this study, only intergenic enhancers will be considered. (D) Representation of all of the distances from intergenic enhancers to their closest annotated TSS. (Lower) Distances (x axis) are delimited to 20 kb upstream to 20 kb downstream of the TSS.
Fig. 5.
Fig. 5.
Oxidation of 5mCA to 5hmCA does not influence MeCP2 binding in active enhancer flanking regions. (A) Schematic representation of an active enhancer region and the closest TSS; 2-kb enhancer surrounding regions are highlighted. These regions are considered for detection and functional study of methylation and hydroxymethylation in CA and compared with local and TSS transcription. (B) Intergenic enhancers and 10-kb surrounding regions were ranked based on the enrichment values of 5mCA (first row), 5hmCA (second row), 5mCG (third row), and 5hmCG (fourth row) in 2-kb shores. Enrichment of the other cytosine modifications were plotted following this rank (Upper). (C) Enhancer (Left) and associated TSS (Right) nuclear RNA-Seq mean coverage. Regions were grouped based on the 5mCA, 5hmCA, 5mCG, and 5hmCG enrichment ranking in 2 Kb surrounding enhancers (from higher, black to lower, yellow), as shown in previous figure. RPKM, reads per kilobase per million. (D) Relative importance of cytosine modifications in predicting MeCP2 binding in enhancer flanking regions using random decision forest regressor algorithm. (E) Density plot of MeCP2 enrichment in enhancer flanking region ordered from lower to higher 5hmCA/5mCA ratio. Red line represents moving mean values of MeCP2 enrichment grouped according to the ratio (20 region bins, one region step). Pearson’s r value is indicated.

References

    1. Suzuki MM, Bird A. DNA methylation landscapes: Provocative insights from epigenomics. Nat Rev Genet. 2008;9:465–476. - PubMed
    1. Kriaucionis S, Heintz N. The nuclear DNA base 5-hydroxymethylcytosine is present in Purkinje neurons and the brain. Science. 2009;324:929–930. - PMC - PubMed
    1. Tahiliani M, et al. Conversion of 5-methylcytosine to 5-hydroxymethylcytosine in mammalian DNA by MLL partner TET1. Science. 2009;324:930–935. - PMC - PubMed
    1. Wu H, Zhang Y. Reversing DNA methylation: Mechanisms, genomics, and biological functions. Cell. 2014;156:45–68. - PMC - PubMed
    1. Ito S, et al. Tet proteins can convert 5-methylcytosine to 5-formylcytosine and 5-carboxylcytosine. Science. 2011;333:1300–1303. - PMC - PubMed

Publication types