. 2017 Dec;16(12):2913-2926.
doi: 10.1158/1535-7163.MCT-17-0353. Epub 2017 Aug 28.

TRP53 Mutants Drive Neuroendocrine Lung Cancer Through Loss-of-Function Mechanisms with Gain-of-Function Effects on Chemotherapy Response

Affiliations

TRP53 Mutants Drive Neuroendocrine Lung Cancer Through Loss-of-Function Mechanisms with Gain-of-Function Effects on Chemotherapy Response

Nagako Akeno et al. Mol Cancer Ther. 2017 Dec.

Abstract

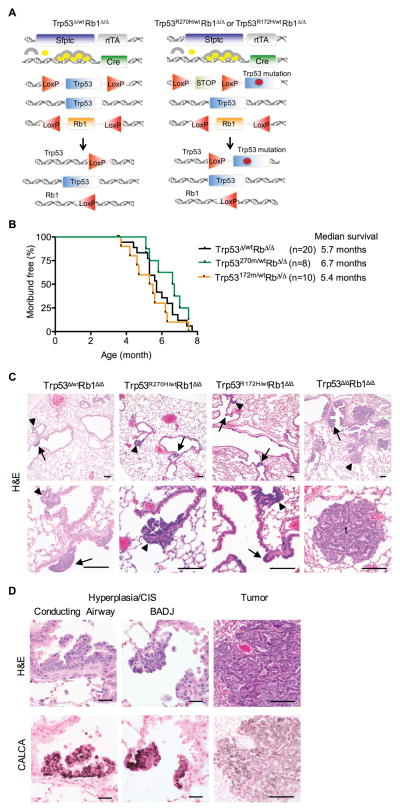
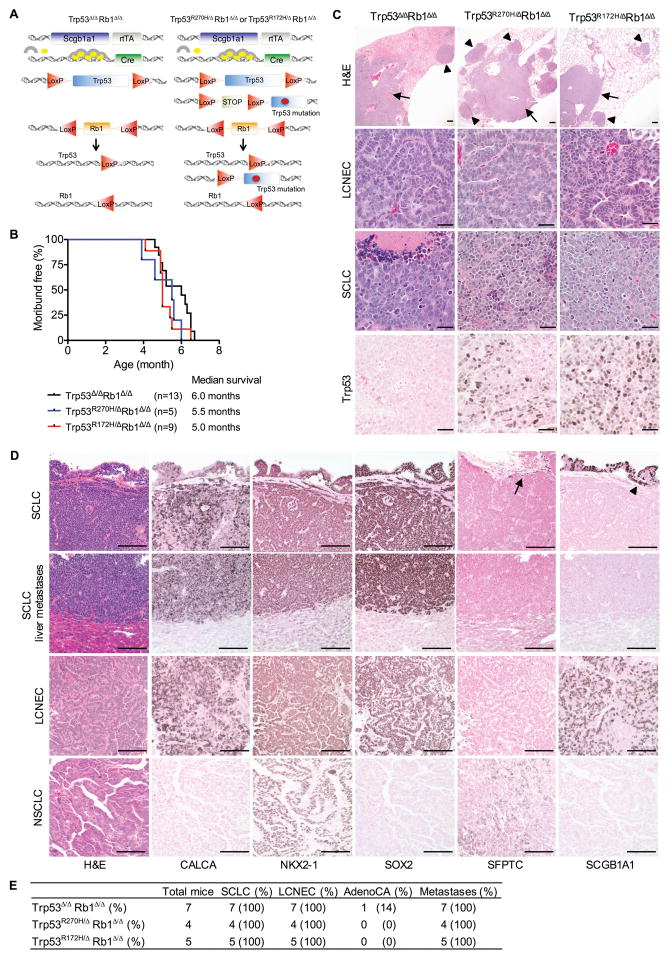
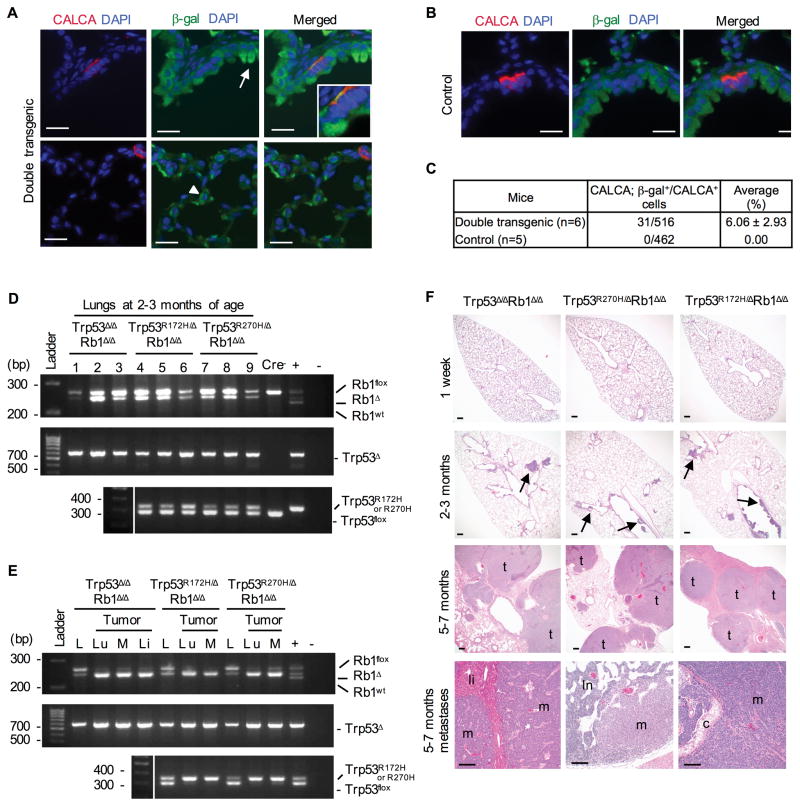
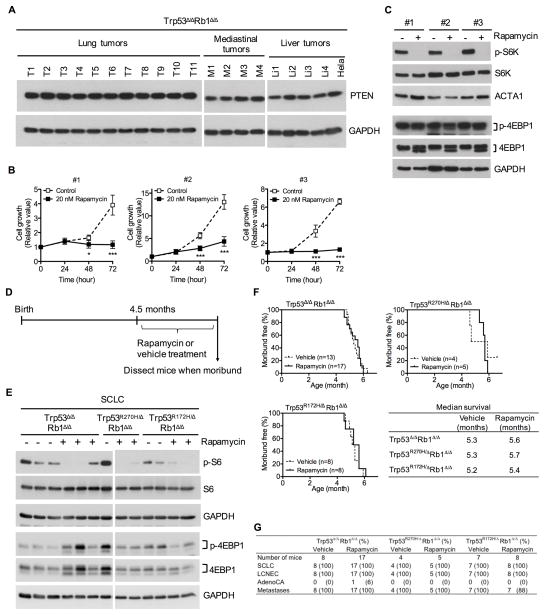
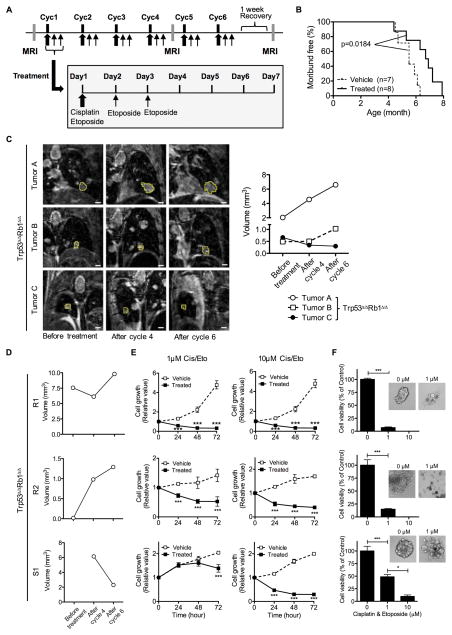
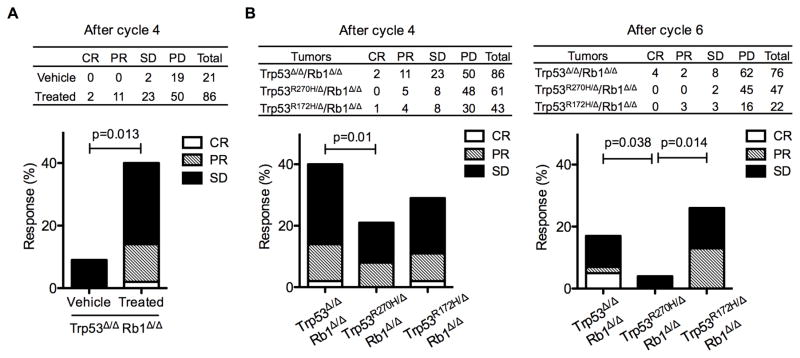
Lung cancer is the leading cause of cancer-related deaths with small-cell lung cancer (SCLC) as the most aggressive subtype. Preferential occurrence of TP53 missense mutations rather than loss implicates a selective advantage for TP53-mutant expression in SCLC pathogenesis. We show that lung epithelial expression of R270H and R172H (R273H and R175H in humans), common TRP53 mutants in lung cancer, combined with RB1 loss selectively results in two subtypes of neuroendocrine carcinoma, SCLC and large cell neuroendocrine carcinoma (LCNEC). Tumor initiation and progression occur in a remarkably consistent time frame with short latency and uniform progression to lethal metastatic disease by 7 months. R270H or R172H expression and TRP53 loss result in similar phenotypes demonstrating that TRP53 mutants promote lung carcinogenesis through loss-of-function and not gain-of-function mechanisms. Tumor responses to targeted and cytotoxic therapeutics were discordant in mice and corresponding tumor cell cultures demonstrating need to assess therapeutic response at the organismal level. Rapamycin did not have therapeutic efficacy in the mouse model despite inhibiting mTOR signaling and markedly suppressing tumor cell growth in culture. In contrast, cisplatin/etoposide treatment using a patient regimen prolonged survival with development of chemoresistance recapitulating human responses. R270H, but not R172H, expression conferred gain-of-function activity in attenuating chemotherapeutic efficacy. These data demonstrate a causative role for TRP53 mutants in development of chemoresistant lung cancer, and provide tractable preclinical models to test novel therapeutics for refractory disease. Mol Cancer Ther; 16(12); 2913-26. ©2017 AACR.


Figures

Figure 1
Figure 1. R270H and R172H do not have dominant-negative effects in Rb1 deficient lung epithelium
(A) Trp53Δ/wt Rb1Δ/Δ, Trp53R270H/wtRb1Δ/Δ and Trp53R172H/wtRb1Δ/Δ mice contain two transgenes: 1) the reverse tetracycline transactivator (rtTA) under control of the human Surfactant protein C (Sfptc) promoter, and 2) Cre recombinase under control of the tet operator. Treatment with doxycycline (circles) which combines with rtTA (arches) induces Cre recombinase expression resulting in recombination of floxed (LoxP) Trp53 and Rb1 alleles. Trp53Δ/wt Rb1Δ/Δ mice (left) contain one wild type and one floxed Trp53 allele leading to heterozygous Trp53 loss after recombination. Trp53R172H/wtRb1Δ/Δ and Trp53R270H/wtRb1Δ/Δ mice (right) contain one wild type and one mutant Trp53 allele containing a missense mutation in exon 5 (R172H) or exon 8 (R270H), that results in wild type Trp53 expression along with R172H or R270H expression after recombination of the floxed STOP cassette preceding the point mutation. All mice contain two floxed Rb1 alleles resulting in homozygous Rb1 loss after recombination. (B) Mice with Trp53Δ/wtRb1Δ/Δ, Trp53R270H/wtRb1Δ/Δ and Trp53R172H/wtRb1Δ/Δ lungs had similar survivals. Kaplan-Meier curves represent mice that died or were sacrificed when moribund or after losing > 10% body weight. (C) Trp53Δ/wtRb1Δ/Δ, Trp53R270H/wtRb1Δ/Δ and Trp53R172H/wtRb1Δ/Δ lungs had similar phenotypes consisting of multifocal neuroendocrine hyperplasia and carcinomas in situ (CIS) in conducting airways (arrows) and at bronchioalveolar duct junctions (BADJ, arrowheads) shown in H&E images. Trp53 Δ/ΔRb1Δ/Δ lungs with homozygous Trp53 and Rb1 loss had a more advanced neoplastic phenotype with extensive hyperplasia and CIS as well as tumors (t). Scale bars: 100 μm. (D) Cells comprising hyperplasia, CIS and tumors in all genotypes shown in H&E images (top row) were positive for calcitonin related polypeptide alpha (CALCA) staining by immunohistochemistry (bottom row). Scale bars: 20 μm (left and middle columns) and 100 μm (right column).
Figure 2
Figure 2. R270H and R172H promote lethal SCLC in Rb1 deficient lung epithelia through loss-of-function and not gain-of-function mechanisms
(A) Mice with Trp53Δ/ΔRb1Δ/Δ, Trp53R270H/ΔRb1Δ/Δ or Trp53R172H/ΔRb1Δ/Δ lungs were generated with a similar strategy as in Fig. 1A using the rat secretoglobin family 1A member 1 (Scgb1a1) promoter rather than the Sfptc promoter to drive rtTA. The same floxed (LoxP) Trp53, Trp53 mutant and Rb1 alleles described in Fig. 1A were used to generate mice with homozygous Rb1 loss combined with homozyous Trp53 loss, or R270H or R172H expression targeted to the lung epithelium. (B) Mice with Trp53Δ/ΔRb1Δ/Δ, Trp53R270H/ΔRb1Δ/Δ and Trp53R172H/ΔRb1Δ/Δ lungs had similar median survivals of 5.0–6.0 months of age. Kaplan-Meier curves represent mice that died or were sacrificed when moribund or after losing > 10% body weight. (C) Trp53Δ/ΔRb1Δ/Δ, Trp53R270H/ΔRb1Δ/Δ and Trp53R172H/ΔRb1Δ/Δ lungs had similar phenotypes consisting of SCLC predominantly localized to hilar and proximal conducting airways (arrows), and LCNEC predominantly localized to distal conducting airways, BADJs and alveolar regions (arrowheads). Representative H&E images of Trp53Δ/ΔRb1Δ/Δ, Trp53R270H/ΔRb1Δ/Δ and Trp53R172H/ΔRb1Δ/Δ lungs from 5–7 month old mice are shown with higher magnification images showing differing morphologic features of LCNEC and SCLC. R270H and R172H protein was detected in Trp53R270H/ΔRb1Δ/Δ and Trp53R172H/ΔRb1Δ/Δ lungs, respectively by immunohistochemistry with no Trp53 detected in Trp53Δ/ΔRb1Δ/Δ lungs. Data is representative of tumors in 8 Trp53R270H/ΔRb1Δ/Δ, 6 Trp53R172H/ΔRb1Δ/Δ and 13 Trp53Δ/ΔRb1Δ/Δ mice. Scale bars: 200 μm (top row) and 20 μm (middle and bottom rows). (D) Mice with Trp53Δ/ΔRb1Δ/Δ, Trp53R270H/ΔRb1Δ/Δ and Trp53R172H/ΔRb1Δ/Δ lungs consistently developed metastatic SCLC and LCNEC with phenotypic characteristics of the corresponding human tumors. Primary SCLC and LCNEC lung tumors as well as SCLC metastases had a neuroendocrine phenotype, staining positively for the neuroendocrine marker, CALCA by immunohistochemistry. The tumors were also positive for the lung epithelial marker, NK2 homeobox 1 (NKX2-1) and the conducting airway marker, SRY-box 2 (SOX2), whereas they were negative for the parenchymal type II cell marker, SFTPC. Unlike SCLC, a subset of LCNEC had positive staining for the Club cell marker, SCGB1A1. Non-neoplastic type II cells were positive for SFTPC (arrow) and Club cells were positive for SCGB1a1 (arrowhead) serving as internal positive controls. One Trp53Δ/ΔRb1Δ/Δ mice developed a NSCLC papillary adenocarcinoma with a type II cell phenotype as indicated by positive staining for NKX2-1 and SFTPC, and absence of staining for CALCA, SOX2 and SCGB1A1. A second single adenocarcinoma developed in a Trp53Δ/ΔRb1Δ/Δ rapamycin treated mouse (see Fig. 4G). Scale bars: 100 μm. (E) Table summarizing pathologic findings in 5–7 month old mice with Trp53Δ/ΔRb1Δ/Δ, Trp53R270H/ΔRb1Δ/Δ and Trp53R172H/ΔRb1Δ/Δ lungs. Lethal metastatic SCLC consistently developed in mice of all genotypes with a single NSCLC adenocarcinoma (AdenoCA) being detected in a Trp53Δ/ΔRb1Δ/Δ mouse.
Figure 3
Figure 3. Targeting R270H, R172H or Trp53 loss to Rb1 deficient non-neuroendocrine and neuroendocrine cell lineages uniformly results in metastatic SCLC in a temporally consistent time course
(A) Mice containing the Scgb1a1-rtTA+/−;tetO-Cre+/ transgenes described in Fig. 2A were crossed into the ROSA26 reporter strain, treated with doxycycline and adult lungs assessed for β-galactosidase (β-gal, green) expression by immunofluorescence to determine targeted cells. Club cells (arrow) and alveolar type II cells (arrowhead) as well as neuroendocrine cells were targeted as demonstrated by co-expression (yellow) of β-gal (green) and CALCA (red) in conducting airways in merged Zeiss Apotome acquired images. Scale bars: 20 μm. (B) No β-gal positive cells were detected in control lungs lacking one or both transgenes required for gene recombination. Scale bars: 20 μm. (C) Quantification of targeted neuroendocrine cells demonstrating an average 6% of CALCA positive neuroendocrine cells targeted with no CALCA/β-gal double positive cells detected in control lungs. (D) PCR analyses confirmed recombination of Trp53 (Trp53Δ, Trp53R172H or Trp53R270H) and Rb1 (Rb1Δ) floxed alleles in lungs from 2–3 month old mice. Wild type Rb1 (Rb1wt), floxed Rb1 (Rb1flox) and floxed Trp53 (Trp53flox) alleles are indicated. (+) = positive control, (−) = no DNA. (E) Tumors arose from Cre targeted cells as demonstrated by enrichment for recombined alleles in DNA isolated from lung (Lu) and metastatic mediastinal (M) and liver (Li) tumors as compared to nontumor lung (L) in all genotypes. (F) Tumor initiation and progression uniformly occurred within a consistent time course in Trp53Δ/ΔRb1Δ/Δ, Trp53R270H/ΔRb1Δ/Δ and Trp53R172H/ΔRb1Δ/Δ lungs. Lungs were normal at 1 week, neuroendocrine hyperplasia and CIS (arrows) developed by 2–3 months, and multifocal lung tumors (t) with SCLC metastases (m) to liver (li, bottom left), lymph nodes (ln, bottom middle) and mediastinum (c, tracheal cartilage, bottom right) were present at 5–7 months. Scale bars: 200 μm top and middle rows and 100 μm bottom row.
Figure 4
Figure 4. Primary lung and metastatic tumors retain PTEN expression and have activate mTOR signaling with rapamycin treatment being insufficient to alter survival despite marked suppression of mTOR signaling and inhibition of tumor cell growth in culture
(A) PTEN expression was detected in all 11 primary lung (T1–T11), 4 metastatic mediastinal (M1–M4) and 4 metastatic liver (Li1–Li4) tumors derived from Trp53Δ/ΔRb1Δ/Δ mice by western blot analysis. Hela cell lysate was used as a positive control, and blots were reprobed with GAPDH as a loading control. (B) Growth of primary tumor cells established in culture from three independent Trp53Δ/ΔRb1Δ/Δ lung tumors arising in three different mice (#1–#3) was markedly inhibited by rapamycin (20 nM). Results are representative of three independent experiments with data represented as mean ± SD (n=4 wells/group). * p<0.05 and *** p<0.001. (C) Rapamycin (20 nM) inhibited mTOR pathway signaling in primary tumor cell cultures by 24 hours as demonstrated by reduced expression of phosphorylated ribosomal protein S6 kinase (p-S6K) by western blot analysis. Rapamycin did not alter expression of phosphoryated eukaryotic translation initiation factor 4E-binding protein 1 (p-4EBP1). Blots were reprobed for total S6K and 4EBP1 as well as alpha 1 actin (ACTA1) or glyceraldehyde-3-phosphate dehydrogenase (GAPDH) as loading controls. (D) Mice with Trp53Δ/ΔRb1Δ/Δ, Trp53R270H/ΔRb1Δ/Δ or Trp53R172H/ΔRb1Δ/Δ lungs were treated with rapamycin or vehicle control at 4.5 months of age and dissected when moribund. (E) mTOR pathway signaling was downregulated by rapamycin treatment in 67% of lung tumors obtained from moribund mice as demonstrated by decreased phosphorylated S6 ribosomal protein (p-S6). Expression of p-4EBP1 was not consistently changed in tumors from rapamycin treated mice. Representative images are shown with decreased expression of p-S6 and no change in p-4EBP1 expression seen in 7/11 Trp53Δ/ΔRb1Δ/Δ, 3/3 Trp53R270H/ΔRb1Δ/Δ and 4/7 Trp53R172H/ΔRb1Δ/Δ tumors. Expression of p-S6 was detected in 14/15 tumors from vehicle control mice at variable levels. Blots were reprobed with total S6 and 4EBP1 as well as GAPDH as a loading control. (F) Rapmaycin did not alter survival of Trp53Δ/ΔRb1Δ/Δ, Trp53R270H/ΔRb1Δ/Δ or Trp53R172H/ΔRb1Δ/Δ mice as compared to vehicle controls. (G) Lung cancer phenotypes were the same in rapamycin and vehicle treated mice of all genotypes. All mice developed multifocal SCLC and LCNEC with only a single NSCLC adenocarcinoma (AdenoCA).
Figure 5
Figure 5. Chemotherapy treatment extends survival of tumor bearing mice with tumor response in vivo not retained in cell culture
(A) Mice with Trp53Δ/ΔRb1Δ/Δ lungs were treated with a chemotherapy regime mimicking standard-of-care treatment for human SCLC patients with six weekly cycles (Cyc1–6) of chemotherapy consisting of cisplatin (6 mg/kg/day) and etoposide (12 mg/kg/day) intraperitoneally administered on the first day followed by additional administration of etoposide (12 mg/kg/day) on days 2 and 3. Three MRIs were performed during the course of treatment: before treatment to confirm tumor presence and serve as baseline, after cycle 4, and after cycle 6. (B) Chemotherapy treatment significantly prolonged survival (p=0.0184) of Trp53Δ/ΔRb1Δ/Δ mice with median survivals of 6.7 and 5.5 months for chemotherapy treated and vehicle control mice, respectively. Kaplan-Meier curves represent mice that died or were sacrificed when moribund or after losing > 10% body weight. (C) Trp53Δ/ΔRb1Δ/Δ tumors in an individual mouse have differing responses to chemotherapy. Tumors were imaged by MRI and volumes quantified before treatment, after cycle 4 and after cycle 6. Representative images of tumors (outlined in yellow) within a single mouse and graph showing corresponding tumor volumes over time are shown. Examples of a tumor refractory to chemotherapy (A), stable disease followed by tumor progression (chemoresistant tumor) (B) and a chemosensitive tumor (C) are depicted. (D) Trp53Δ/ΔRb1Δ/Δ primary cell cultures were established from chemoresistant (R1 and R2) and chemosensitive (S1) lung tumors. (E) Chemotherapeutic response of tumors in vivo is not retained in cell culture. Cells derived from R1, R2 and S1 tumors were all growth inhibited by cisplatin/etoposide (Cis/Eto) treatment at 1 μM and 10 μM doses as compared to vehicle treated controls in a 2D culture system as assessed by WST-1 assay. (F) Similar cisplatin/etoposide induced decreased cell viability was seen for cells from both chemoresistant and chemosensitive tumors grown in the 3D NanoCulture system. Cells were grown for 7 days and then treated with Cis/Eto (1 μM and 10 μM) for 5–7 days. Cell viability was significantly decreased at both concentrations of Cis/Eto irrespective of tumor response in vivo as assessed by CellTiter-Glo assay. Results in E–F are representative of three independent experiments with data represented as mean ± SD (n=4 (E) and 3 (F) wells/group). * p<0.05 and *** p<0.001.
Figure 6
Figure 6. R270H has mutant specific gain-of-function effects that decrease efficacy of cisplatin/etoposide treatment
(A) An overall significant tumor response to cisplatin/etoposide treatment was present in mice with Trp53Δ/ΔRb1Δ/Δ tumors as compared to vehicle treated mice after 4 cycles of treatment. Table indicates number of tumors with complete response (CR), partial response (PR), stable disease (SD) and progressive disease (PD) in vehicle and chemotherapy treated mice with Trp53Δ/ΔRb1Δ/Δ lungs. Graph depicts overall response with 40% of tumors responding to chemotherapy treatment as CR, PR or SD vs 10% of tumors with SD in vehicle treated control mice. (B) Cisplatin/etoposide treatment was significantly less effective in Trp53R270H/ΔRb1Δ/Δ lung tumors as compared to Trp53Δ/ΔRb1Δ/Δ and Trp53R172H/ΔRb1Δ/Δ lung tumors. Tables and graphs indicate the number and percentage of tumors with CR, PR, SD and PD after cycle 4 (left) and after cycle 6 (right). Overall response of Trp53R270H/ΔRb1Δ/Δ lung tumors to chemotherapy treatment was statistically significantly reduced as compared to Trp53Δ/ΔRb1Δ/Δ lung tumors after cycle 4, and Trp53Δ/ΔRb1Δ/Δ and Trp53R172H/ΔRb1Δ/Δ lung tumors after cycle 6. Logistic regression was used to analyze tumor response with p values indicated in the graphs.

References

    1. Siegel RL, Miller KD, Jemal A. Cancer Statistics, 2017. CA Cancer J Clin. 2017;67(1):7–30. - PubMed
    1. Pillai RN, Owonikoko TK. Small cell lung cancer: therapies and targets. Semin Oncol. 2014;41(1):133–42. - PMC - PubMed
    1. van Meerbeeck JP, Fennell DA, De Ruysscher DK. Small-cell lung cancer. Lancet. 2011;378(9804):1741–55. - PubMed
    1. Gazdar AF, Hirsch FR, Minna JD. From Mice to Men and Back: An Assessment of Preclinical Model Systems for the Study of Lung Cancers. J Thorac Oncol. 2016;11(3):287–99. - PMC - PubMed
    1. Semenova EA, Nagel R, Berns A. Origins, genetic landscape, and emerging therapies of small cell lung cancer. Genes Dev. 2015;29(14):1447–62. - PMC - PubMed

MeSH terms