

Rab35 GTPase recruits NDP52 to autophagy targets
- PMID: 28848034
- PMCID: PMC5599792
- DOI: 10.15252/embj.201796463
Rab35 GTPase recruits NDP52 to autophagy targets
Erratum in
-
Rab35 GTPase recruits NDP52 to autophagy targets.EMBO J. 2017 Nov 15;36(22):3405. doi: 10.15252/embj.201798293. EMBO J. 2017. PMID: 29142053 Free PMC article.
Abstract
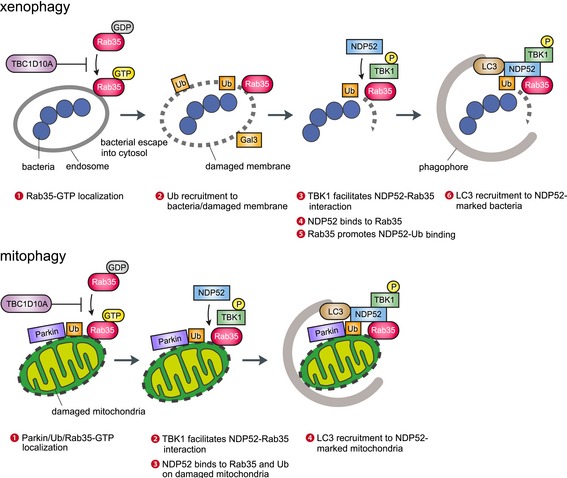
Autophagy targets intracellular molecules, damaged organelles, and invading pathogens for degradation in lysosomes. Recent studies have identified autophagy receptors that facilitate this process by binding to ubiquitinated targets, including NDP52. Here, we demonstrate that the small guanosine triphosphatase Rab35 directs NDP52 to the corresponding targets of multiple forms of autophagy. The active GTP-bound form of Rab35 accumulates on bacteria-containing endosomes, and Rab35 directly binds and recruits NDP52 to internalized bacteria. Additionally, Rab35 promotes interaction of NDP52 with ubiquitin. This process is inhibited by TBC1D10A, a GAP that inactivates Rab35, but stimulated by autophagic activation via TBK1 kinase, which associates with NDP52. Rab35, TBC1D10A, and TBK1 regulate NDP52 recruitment to damaged mitochondria and to autophagosomes to promote mitophagy and maturation of autophagosomes, respectively. We propose that Rab35-GTP is a critical regulator of autophagy through recruiting autophagy receptor NDP52.
Keywords: NDP52; Rab35; TBK1; autophagy.
© 2017 The Authors.
Figures

- A
Screening for TBC/RabGAPs that affect autophagosome formation during GAS infection. HeLa cells overexpressing EmGFP‐tagged TBC/RabGAP and mCherry‐tagged LC3 were infected with GAS for 4 h, and the percentage of cells that formed autophagosomes was determined by confocal microscopy.
- B
Autophagosome formation in HeLa cells overexpressing EmGFP‐TBC1D10A catalytic mutants R160K or D157A, and infected with GAS.
- C, D
HeLa cells expressing indicated FLAG‐TBC1D10 constructs were infected with GAS and analyzed by immunoblotting with indicated antibodies. Data in (D) are mean ± SEM from three independent experiments of LC3‐II 4 h post‐infection and normalized to actin.
- E, F
Bacterial invasion (E) and viability (F) of GAS in HeLa cells overexpressing TBC1D10A and TBC1D10A R160K.
- G
Recruitment of indicated proteins to invading bacterial cells, as quantified by confocal microscopy.
- H
Confocal micrographs of NDP52 recruitment to GAS 4 h post‐infection in HeLa cells expressing indicated EmGFP‐TBC1D10A constructs. Scale bars, 10 μm.
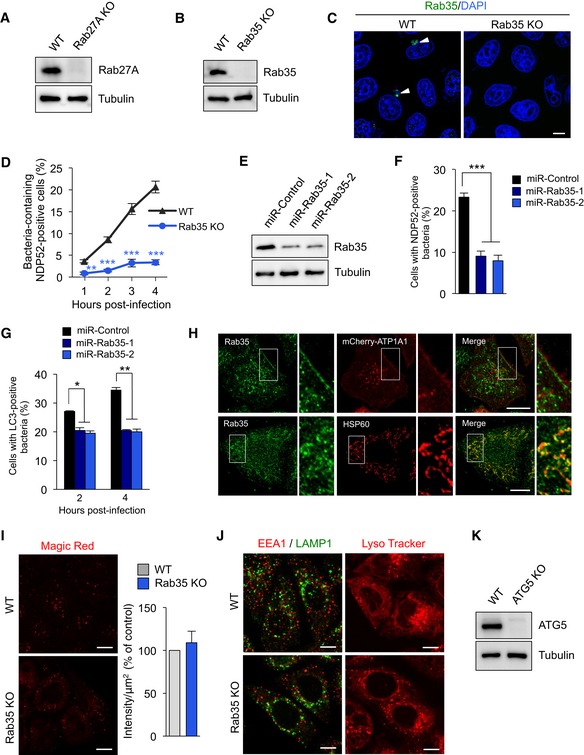
- A, B
Knockout of Rab27 (A) and Rab35 (B) in HeLa cells.
- C
HeLa wild‐type and Rab35 knockout cells were infected with GAS for 4 h, fixed, immunostained with anti‐Rab35 antibody, and stained with DAPI. Arrowheads indicate Rab35‐positive GAS.
- D
Time course of Rab35‐dependent NDP52 recruitment to GAS. HeLa wild‐type and Rab35 knockout cells expressing mCherry‐NDP52 were infected with GAS. The percentages of cells with NDP52‐positive GAS were quantified.
- E
miR‐RNAi knockdown of Rab35.
- F, G
Control (miR‐Control) and Rab35‐knocked down (miR‐Rab35) HeLa cells expressing mCherry‐NDP52 (F) or mCherry‐LC3 (G) were infected with GAS. Cells were analyzed with confocal microscopy and quantified the percentages of cells with NDP52‐positive or LC3‐positive GAS.
- H
Subcellular localization of endogenous Rab35.
- I
HeLa wild‐type and Rab35 knockout cells were treated with Magic Red Cathepsin B (Magic Red CatB, in red) for 2 h. Quantification of the intensity of the Magic Red Cathepsin B signal, presented as a percentage of control (wild‐type cells).
- J
Wild‐type and Rab35 knockout HeLa cells were immunostained with against EEA1 and LAMP1 (left images) or treated with Lysotracker (100 nM) for 90 min (right images).
- K
Knockout of ATG5 in HeLa cells.
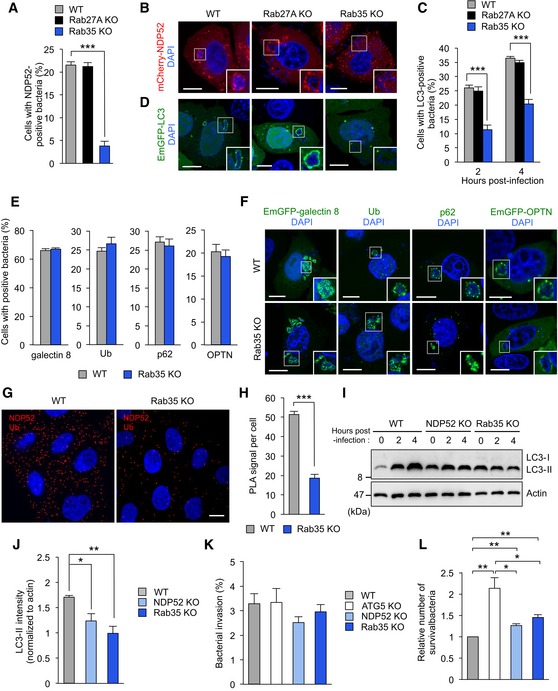
- A, B
Quantification (A) and confocal micrographs (B) of mCherry‐NDP52 recruited to GAS at 4 h post‐infection in wild‐type, Rab27, and Rab35 knockout HeLa cells. Scale bars, 10 μm.
- C, D
Autophagosome formation (C) and confocal micrographs (D) in wild‐type, Rab27, and Rab35 knockout HeLa cells expressing EmGFP‐LC3 and infected with GAS for 4 h. Scale bars, 10 μm.
- E, F
Quantification (E) and confocal micrographs (F) of galectin 8, ubiquitin (Ub), p62, and OPTN recruited to GAS at 4 h post‐infection in wild‐type and Rab35 knockout HeLa cells. Scale bars, 10 μm.
- G, H
HeLa wild‐type and Rab35 knockout cells were stained with NDP52 and ubiquitin primary antibodies to assess NDP52‐Ub binding by Duolink proximity ligation assay. Dots (red) indicate NDP52‐Ub complexes. Scale bars, 10 μm.
- I, J
Immunoblotting of LC3 in wild‐type, NDP52, and Rab35 knockout cells infected with GAS (I). Data in (J) are mean ± SEM from three independent experiments of LC3‐II 4 h post‐infection and normalized to actin.
- K, L
Invasion (K) and viability (L) of GAS in wild‐type, ATG5, NDP52, and Rab35 knockout cells.
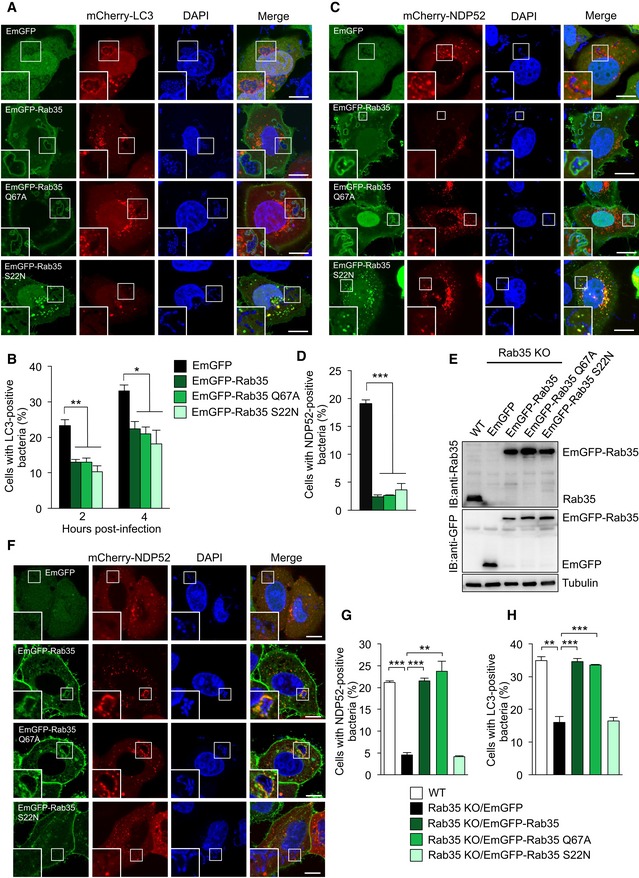
- A, B
Representative confocal micrographs (A) and autophagosome formation (B) in HeLa cells expressing mCherry‐LC3 along with EmGFP, EmGFP‐Rab35, EmGFP‐Rab35 Q67A, or EmGFP‐Rab35 S22N, infected for 4 h with GAS, and stained with DAPI.
- C, D
Representative confocal micrographs (C), and NDP52‐tagged bacteria (D) in HeLa cells expressing mCherry‐NDP52 along with EmGFP, EmGFP‐Rab35, EmGFP‐Rab35 Q67A, or EmGFP‐Rab35 S22N, infected for 4 h with GAS, and stained with DAPI.
- E
Western blotting in HeLa wild‐type and Rab35 knockout cells stably expressing EmGFP, EmGFP‐Rab35, EmGFP‐Rab35 Q67A, or EmGFP‐Rab35 S22N.
- F, G
HeLa wild‐type and Rab35 knockout cells stably expressing EmGFP, EmGFP‐Rab35, EmGFP‐Rab35 Q67A, or EmGFP‐Rab35 S22N were transfected with mCherry‐NDP52 and infected with GAS for 4 h. Confocal images (F) and quantification of NDP52 recruitment to GAS (G).
- H
HeLa wild‐type and Rab35 knockout cells stably expressing EmGFP, EmGFP‐Rab35, EmGFP‐Rab35 Q67A, or EmGFP‐Rab35 S22N were transfected with mCherry‐LC3 and infected with GAS for 4 h.
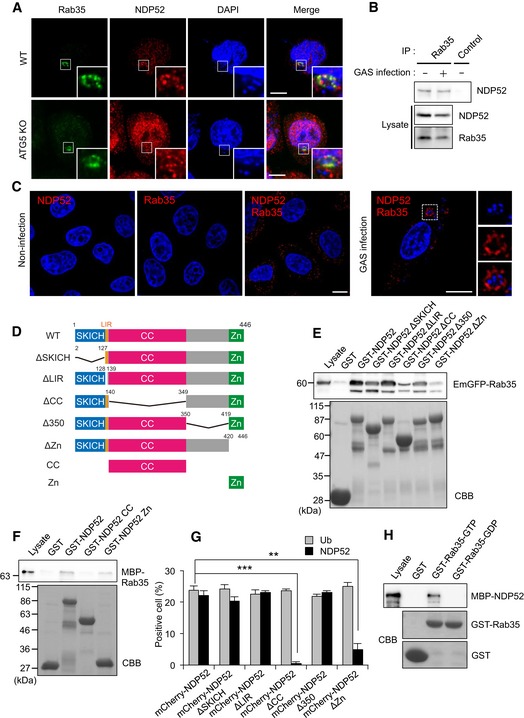
Wild‐type and ATG5 knockout cells were infected with GAS for 4 h and immunostained with anti‐NDP52 and anti‐Rab35. Scale bars, 10 μm.
Coimmunoprecipitation of endogenous Rab35 and NDP52 in uninfected HeLa cells and HeLa cells infected with GAS for 4 h.
HeLa cells infected with or without GAS were stained with Rab35 and NDP52 primary antibodies to assess Rab35‐NDP52 binding by Duolink proximity ligation assay. Dots (red) indicate Rab35‐NDP52 complexes. Scale bars, 10 μm.
Domain organization and deletion mutants of NDP52.
HEK293T cells were transfected with EmGFP‐Rab35 and analyzed by pull‐down assay using immobilized GST or indicated GST‐NDP52 constructs. Rab35 was detected with anti‐GFP.
Beads coated with GST or indicated GST‐NDP52 constructs were incubated with MBP‐Rab35 and immunoblotted with an antibody against MBP.
Quantification of ubiquitin‐ and NDP52‐tagged bacteria, as measured by confocal microscopy. Data are mean ± SEM of three independent experiments. Data were tested by two‐tailed Student's t‐test: **P < 0.01, ***P < 0.001.
Beads coated with GST or GST‐Rab35 loaded with GDP or GTP were incubated with MBP‐NDP52 and immunoblotted with an anti‐MBP antibody.
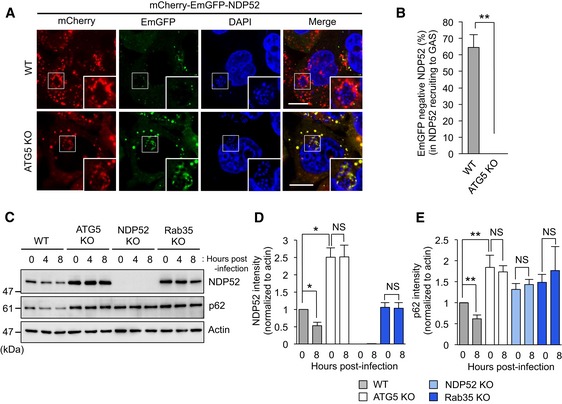
- A
Confocal micrographs of wild‐type HeLa and ATG5 knockout cells expressing mCherry‐EmGFP‐NDP52 and infected with GAS for 4 h. The reporter appears yellow in autophagosomes due to fluorescence from mCherry and EmGFP, but appears red in autolysosomes due to acid quenching of GFP fluorescence. Scale bars, 10 μm.
- B
Autolysosomal NDP52 (red fluorescence in panel A) as a percentage of total NDP52 (red and yellow fluorescence in panel A). Data are mean ± SEM of more than 30 cells.
- C–E
Time course of NDP52 and p62 expression in wild‐type, ATG5, NDP52, and Rab35 knockout HeLa cells infected with GAS. Expression was normalized to actin and plotted in (D and E).
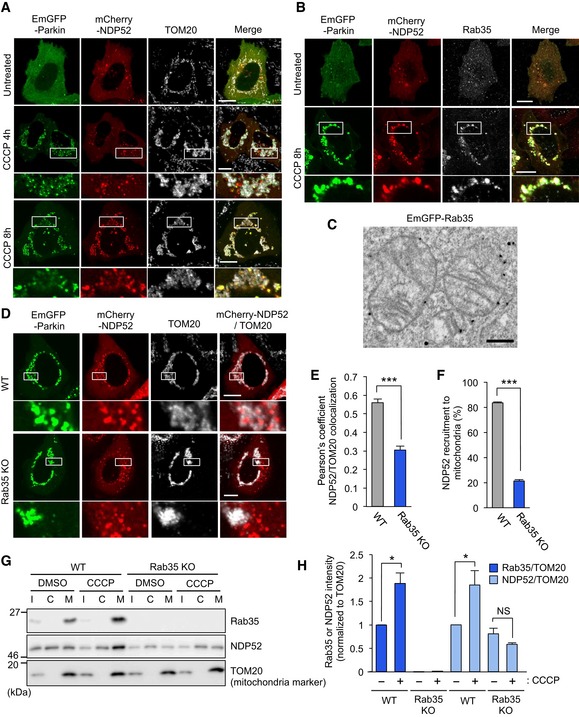
- A, B
Confocal micrographs of NDP52 in HeLa cells transfected with EmGFP‐Parkin and mCherry‐NDP52, exposed to 10 μM CCCP for 4 or 8 h, and immunostained with antibodies against mitochondrial TOM20 (A) or Rab35 (B). Scale bars, 10 μm.
- C
Immunoelectron micrograph of HeLa cells transfected with EmGFP‐Rab35 and mCherry‐Parkin, exposed to 10 μM CCCP for 3 h, and labeled with anti‐GFP antibodies followed by gold particles. Scale bars, 500 nm.
- D–F
Representative confocal micrographs (D), Pearson's coefficient between NDP52 and TOM20 (E), and NDP52 recruitment to damaged mitochondria (F) in wild‐type and Rab35 knockout cells transfected with EmGFP‐Parkin and mCherry‐NDP52, treated with 10 μM CCCP for 8 h, and immunostained with anti‐TOM20. Scale bars, 10 μm. Data in (E) are mean ± SEM from > 10 cells, and data in (F) are mean ± SEM from > 100 cells in three independent experiments.
- G, H
Subcellular fractionation of endogenous Rab35 and NDP52. HeLa cells expressing EmGFP‐Parkin were treated with 10 μM CCCP or DMSO and fractionated. I, C, and M in Western blot images indicate input, cytosol‐rich supernatant, and mitochondria‐rich membrane pellet, respectively (G). Rab35 and NDP52 intensities were normalized to TOM20 in the mitochondria‐rich membrane pellet and quantified (H). Data in (H) are mean ± SEM from three independent experiments.

- A
Confocal micrographs of mCherry‐Rab35 recruited to depolarized mitochondria in HeLa wild‐type (WT) and NDP52 knockout cells expressing EmGFP‐Parkin, exposed to CCCP for 8 h, and immunostained with antibodies against mitochondrial TOM20.
- B, C
HeLa cells expressing EmGFP‐Parkin along with mCherry‐NDP52 treated with antimycin A (4 μM) and oligomycin (10 μM) for 8 h and immunostained with anti‐TOM20. Representative confocal micrographs (B) and quantification (C) of NDP52 recruitment to mitochondria.
- D
HeLa cells were treated with CCCP for the indicated times and analyzed by Western blot against NDP52, Rab35, and actin.
- E, F
HeLa cells expressing EmGFP‐Parkin, mCherry‐NDP52, and FLAG, FLAG‐TBC1D10A, or FLAG‐TBC1D10A R160K were treated with antimycin A and oligomycin for 8 h, and immunostained with anti‐TOM20 and anti‐FLAG. Representative confocal micrographs (E) and quantification (F) of NDP52 recruitment to mitochondria.
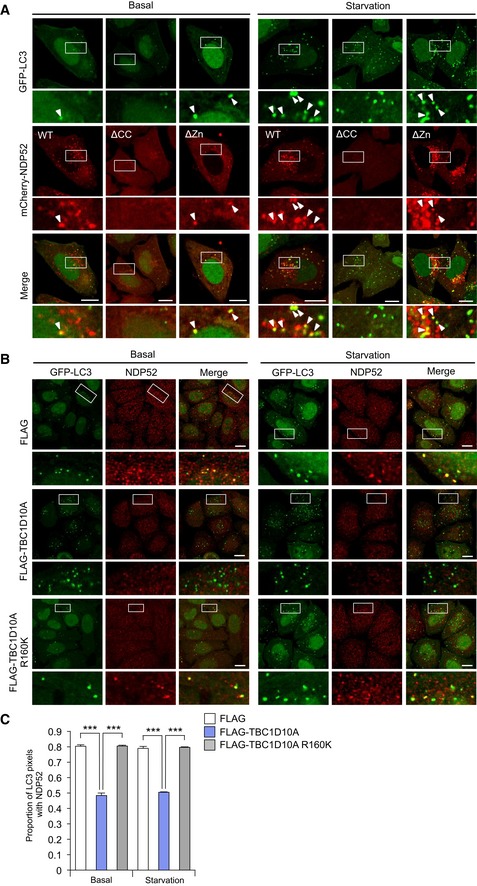
- A
Confocal micrographs of autophagosomes in HeLa cells stably expressing GFP‐LC3 along with mCherry‐NDP52, mCherry‐NDP52ΔCC, or mCherry‐NDP52ΔZn, and cultured in regular (basal) or starvation medium for 2 h. Scale bars, 10 μm. Arrowheads indicate the NDP52‐positive LC3 puncta.
- B, C
HeLa cells stably expressing GFP‐LC3 along with FLAG, FLAG‐TBC1D10A, or FLAG‐TBC1D10A R1660K were cultured in regular (basal) or starvation medium for 2 h and immunostained for NDP52. Confocal images (B) and proportion of LC3 puncta colocalized with NDP52 from at least 30 randomly selected cells were quantified by Mander's coefficient M1 (C). Scale bars, 10 μm. Data were tested by two‐tailed Student's t‐test: ***P < 0.001. Error bars indicate mean ± SEM.
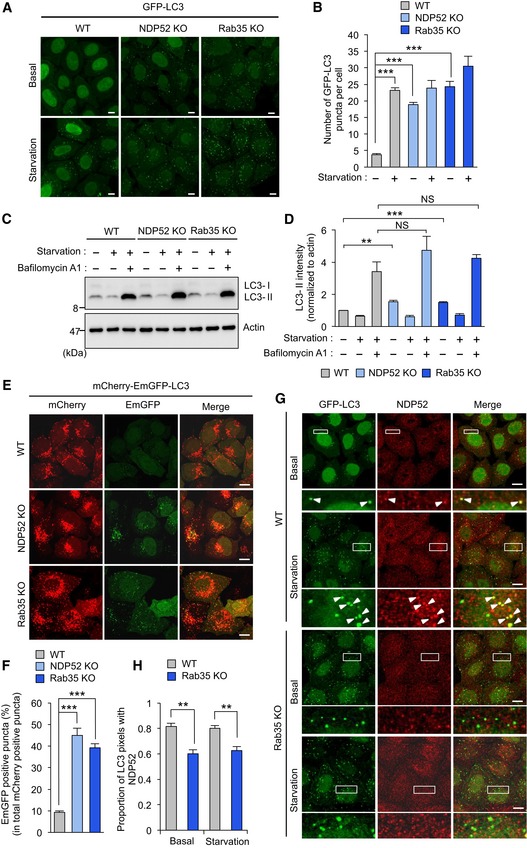
- A, B
Confocal micrographs of wild‐type, NDP52, and Rab35 knockout cells stably expressing GFP‐LC3 and cultured for 2 h in regular (basal condition) or starvation medium (A). LC3‐labeled autophagosomes from at least 45 randomly selected cells were then quantified (B).
- C, D
Wild‐type, NDP52, and Rab35 knockout cells were cultured in regular or starvation medium for 2 h and analyzed by immunoblotting (C). LC3‐II was quantified and normalized to actin (D).
- E, F
Representative confocal micrographs (E) and percentage of EmGFP‐fluorescent puncta from at least 10 randomly selected fields were quantified (F) in wild‐type HeLa, NDP52, and Rab35 knockout cells stably expressing mCherry‐EmGFP‐LC3.
- G, H
Representative confocal micrographs (G), and proportion of LC3 puncta colocalized with NDP52 from at least 30 randomly selected fields were quantified by Mander's coefficient M1 (H) in wild‐type and Rab35 knockout cells stably expressing GFP‐LC3 and cultured in regular or starvation medium for 2 h, and immunostained with anti‐NDP52. Arrowheads indicate the NDP52‐positive LC3 puncta.

- A
HeLa cells were infected with GAS for 4 h and stained with anti‐galectin 3 and anti‐Rab35. Scale bars, 10 μm.
- B
Immunoelectron microscopy analysis revealed colloidal gold particles, indicating the presence of GFP‐Rab35 around invading GAS. Scale bars, 0.5 μm.
- C
Live cell images of HeLa cells expressing EmGFP‐Rab35 and mCherry‐galectin 3, or mCherry‐Rab35, and EmGFP‐galectin 3 during GAS infection. Arrowheads indicate Rab35‐positive GAS. Scale bars, 2 μm.
- D, E
HeLa cells expressed mCherry‐NDP52 or‐Rab35 were treated with DMSO or 4 μM BX795 for 24 h and infected with GAS for indicated times. The percentages of cells with NDP52 (D)‐ or Rab35 (E)‐positive bacteria were quantified.
- F, G
HEK293T cells transfected with mKGN‐NDP52 and mKGC‐Rab35 or mKGN‐NDP52ΔZn and mKGC‐Rab35 were treated or untreated with BX795, and the green fluorescence was analyzed by microscopy. Representative micrographs (F) and quantification of fluorescence intensity (G). Scale bars, 10 μm. White lines indicate the outline of the cells.
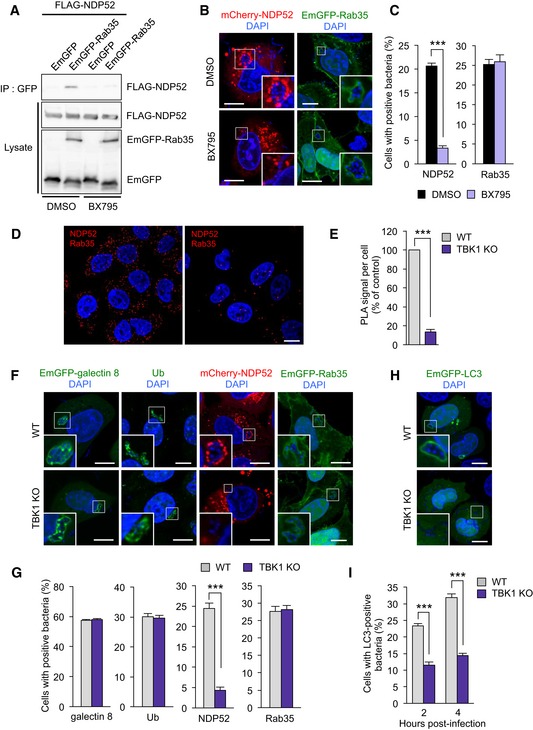
- A
Coimmunoprecipitation of EmGFP‐Rab35 and FLAG‐NDP52 in HEK293T cells treated with DMSO or BX795.
- B, C
HeLa cells expressing mCherry‐NDP52 or EmGFP‐Rab35 were treated with DMSO or 4 μM BX795 for 24 h and infected with GAS for 4 h. Representative confocal micrographs (B) and percentages of cells with NDP52‐ or Rab35‐tagged bacteria (C). The error bars indicate the mean ± SEM from three independent experiments.
- D, E
Wild‐type or TBK1 knockout HeLa cells were stained with Rab35 and NDP52 primary antibodies to assess Rab35‐NDP52 binding using Duolink‐PLA. Representative confocal micrographs (D) and quantification of PLA dots per cell (E). Data in (E) are mean ± SEM from > 50 cells in three independent experiments.
- F, G
Confocal micrographs (F) and quantification (G) of galectin 8, ubiquitin (Ub), NDP52, and Rab35 recruited to GAS 4 h post‐infection in wild‐type and TBK1 knockout HeLa cells. The error bars indicate the mean ± SEM from three independent experiments.
- H, I
Confocal micrographs (H) and quantification (I) of LC3 recruited to GAS in wild‐type and TBK1 knockout HeLa cells. The error bars indicate the mean ± SEM from three independent experiments.
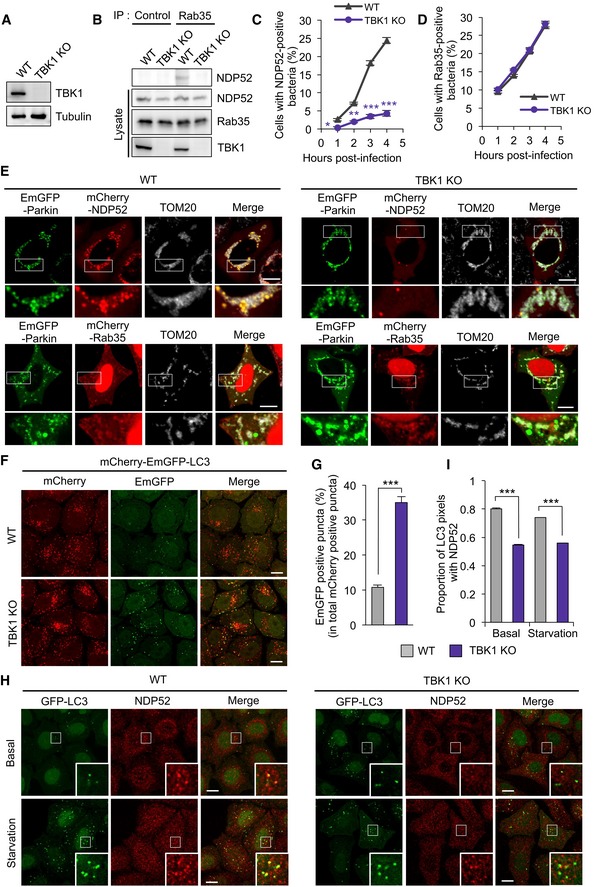
- A
Knockout of TBK1 in HeLa cells.
- B
Coimmunoprecipitation of endogenous Rab35 and NDP52 in wild‐type or TBK1 knockout HeLa cells.
- C, D
HeLa cells expressed mCherry‐NDP52 or‐Rab35 were treated with DMSO or 4 μM BX795 for 24 h and infected with GAS for indicated times. The percentages of cells with NDP52 (C)‐ or Rab35 (D)‐positive bacteria were quantified.
- E
Wild‐type and TBK1 knockout HeLa cells expressed EmGFP‐Parkin and either mCherry‐NDP52 or ‐Rab35 were treated with 10 μM CCCP for 8 h. Cells were fixed and immunostained with antibody against TOM20.
- F, G
Wild‐type and TBK1 knockout HeLa cells stably expressing mCherry‐EmGFP‐LC3 were cultured under starvation for 2 h. Representative confocal images (F) and quantification (G) of EmGFP‐positive puncta.
- H, I
Wild‐type and TBK1 knockout HeLa cells stably expressing GFP‐LC3 were cultured under nutrient (basal) or starvation condition for 2 h. Cells were fixed and immunostained with an antibody against NDP52. Representative confocal micrographs (H) and proportion of LC3 puncta colocalized with NDP52 from at least 30 randomly selected fields were quantified by Mander's coefficient M1 (I).
References
-
- Cauvin C, Rosendale M, Gupta‐Rossi N, Rocancourt M, Larraufie P, Salomon R, Perrais D, Echard A (2016) Rab35 GTPase triggers switch‐like recruitment of the lowe syndrome lipid phosphatase OCRL on newborn endosomes. Curr Biol 26: 120–128 - PubMed
-
- Chaineau M, Ioannou MS, McPherson PS (2013) Rab35: GEFs, GAPs and effectors. Traffic 14: 1109–1117 - PubMed
-
- Ellinghaus D, Zhang H, Zeissig S, Lipinski S, Till A, Jiang T, Stade B, Bromberg Y, Ellinghaus E, Keller A, Rivas MA, Skieceviciene J, Doncheva NT, Liu X, Liu Q, Jiang F, Forster M, Mayr G, Albrecht M, Hasler R et al (2013) Association between variants of PRDM1 and NDP52 and Crohn's disease, based on exome sequencing and functional studies. Gastroenterology 145: 339–347 - PMC - PubMed
MeSH terms
Substances
LinkOut - more resources
Full Text Sources
Other Literature Sources
Research Materials
Miscellaneous
