. 2018 Sep;23(9):1900-1910.
doi: 10.1038/mp.2017.168. Epub 2017 Aug 29.

Methylomic profiling and replication implicates deregulation of PCSK9 in alcohol use disorder

Affiliations

Methylomic profiling and replication implicates deregulation of PCSK9 in alcohol use disorder

F W Lohoff et al. Mol Psychiatry. 2018 Sep.

Abstract

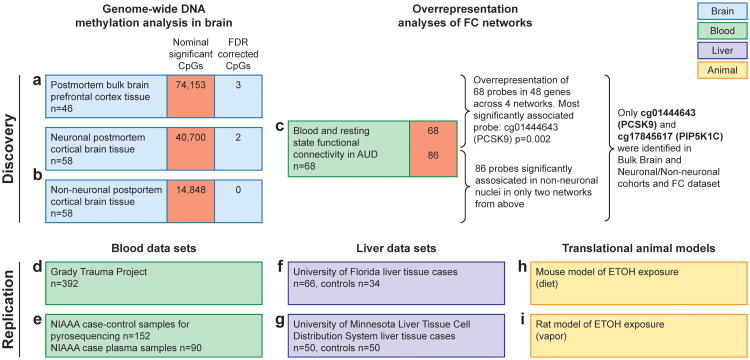
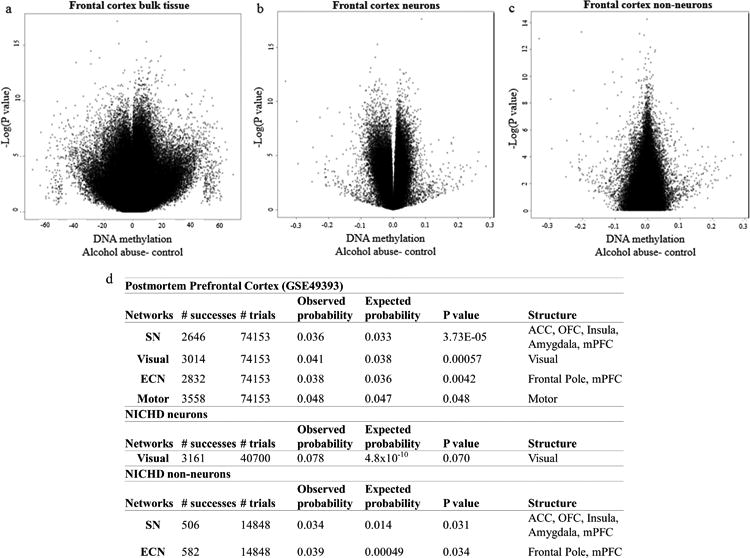
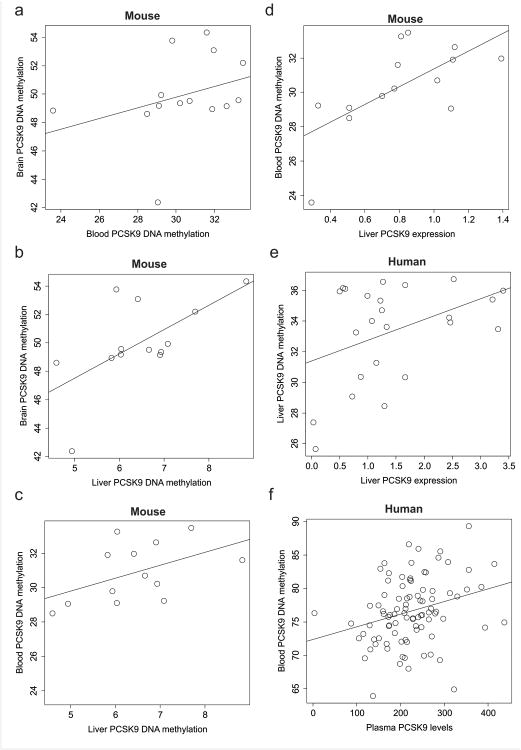
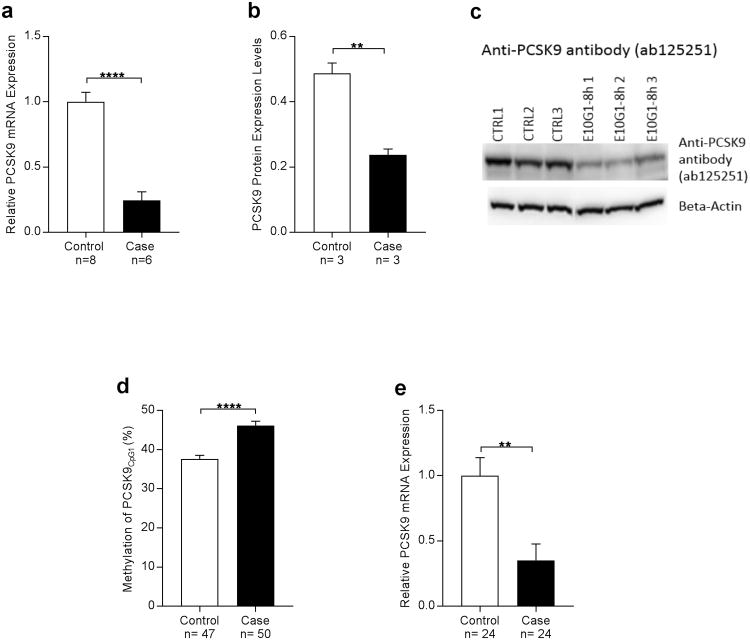
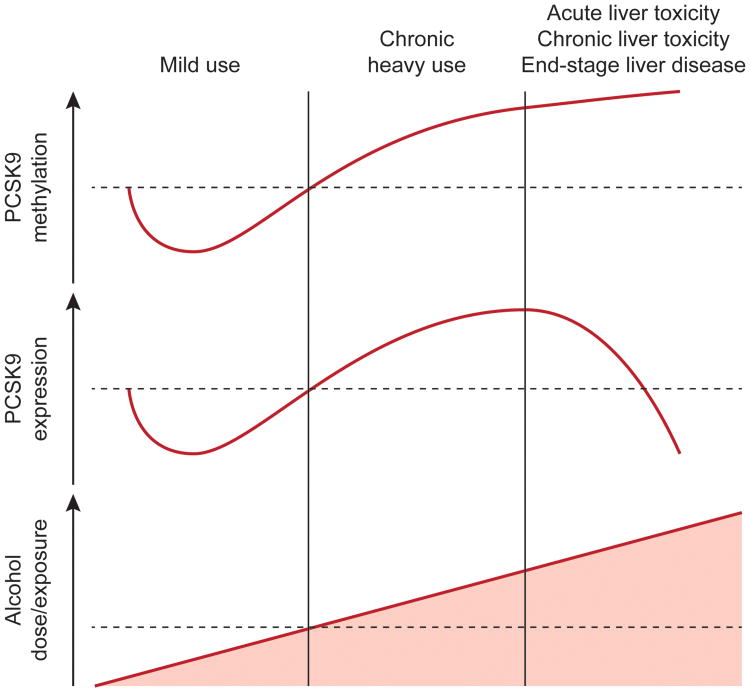
Alcohol use disorder (AUD) is a common and chronic disorder with substantial effects on personal and public health. The underlying pathophysiology is poorly understood but strong evidence suggests significant roles of both genetic and epigenetic components. Given that alcohol affects many organ systems, we performed a cross-tissue and cross-phenotypic analysis of genome-wide methylomic variation in AUD using samples from 3 discovery, 4 replication, and 2 translational cohorts. We identified a differentially methylated region in the promoter of the proprotein convertase subtilisin/kexin 9 (PCSK9) gene that was associated with disease phenotypes. Biological validation showed that PCSK9 promoter methylation is conserved across tissues and positively correlated with expression. Replication in AUD datasets confirmed PCSK9 hypomethylation and a translational mouse model of AUD showed that alcohol exposure leads to PCSK9 downregulation. PCSK9 is primarily expressed in the liver and regulates low-density lipoprotein cholesterol (LDL-C). Our finding of alcohol-induced epigenetic regulation of PCSK9 represents one of the underlying mechanisms between the well-known effects of alcohol on lipid metabolism and cardiovascular risk, with light alcohol use generally being protective while chronic heavy use has detrimental health outcomes.


Conflict of interest statement

Conflict of Interest: The authors declare no conflict of interest.

Figures

Figure 1
Figure 1. Methylomic profiling approach in AUD using three discovery and six replication data sets identified PCSK9 as main epigenetic target
A schematic representation of cohorts investigated in this study broken into the discovery phase experiments (a,b,c) that identified PCSK9 association with alcohol use and the replication stage experiments (d-i) including biological target validation in animal models (h,i). Replication experiments were performed in multiple cohorts between blood and liver and data derived from publicly available datasets and direct investigation. For human blood, DNA from individuals who participated in the Grady Trauma Project (GTP) (n= 392) (d) was analyzed for CpG cg01444643 (hg38, chr1: 55039175) (PCSK9CpG1) PCSK9CpG1 was significantly associated with both the binary SCID lifetime alcohol abuse (β= -0.007 ± 0.004, F= 3.891, df= 2/325, P= 0.049) and the continuous KMSK Lifetime Alcohol scale (β= -0.001 ± 0, F= 4.944, df= 2/306, P= 0.027). In a second human blood cohort (e), we assessed PCSK9 DNA methylation levels with pyrosequencing at the PCSK9CpG1 and an adjacent CpG located at chr1: 55039185 (PCSK9CpG2) in human subjects (n= 90) aged 21-65 with a diagnosis of alcohol dependence and healthy volunteers (n= 62). We observed significantly lower DNA methylation at both CpGs (Student's t-test, PCSK9CpG1: Alcohol Abuse= 76.68 ± 0.05, No Alcohol Abuse= 78.6± 0.064, P= 0.0075; PCSK9CpG2 : Alcohol Abuse= 88.49 ± 0.025, No Alcohol Abuse= 89.28 ± 0.032, P= 0.028). In a liver cohort, we assessed PCSK9 DNA methylation levels at PCSK9CpG1 in DNA derived from individuals with normal livers (n= 34) or primary liver disease tissue arising in the setting of chronic hepatitis B (HBV) or C (HCV) viral infection, alcoholism (ETOH), and other causes (n= 66) (GSE60753) (f). PCSK9 DNA methylation was significantly elevated with alcohol-induced cirrhosis (Alcohol Cirrhosis= 0.54 ± 0.0023, Healthy= 0.49 ± 0.0015, P= 0.0021). Importantly, significant elevations were also observed with cirrhosis induced by hepatitis B (Hep B Cirrhosis= 0.55 ± 0.0079, Healthy= 0.49 ± 0.0015, P= 0.023) and C (Hep C Cirrhosis= 0.57 ± 0.0011, Healthy= 0.49 ± 0.0015, P= 1.2×10⁻⁹). Finally, PCSK9CpG1 DNA methylation levels assessed with pyrosequencing in liver tissue samples from liver transplant candidates with alcoholic cirrhosis (n= 50) and healthy controls (n= 47) (g). A significantly higher PCSK9 DNA methylation level was observed in alcoholic cirrhosis cases relative to controls (Student's t-test; Alcohol Abuse= 46.19 ± 1.07, No Alcohol abuse= 37.63 ± 0.89, P= 6.5×10⁻⁹). In translational models, mouse liver PCSK9 expression was significantly lower in the alcohol exposure group (h) (Student's t-test; Alcohol Exposure= 0.1 ± 0.011, No Alcohol Exposure= 1.02 ± 0.057, P= 0.0029). A translational rat model (i) was used to assess long-term effects of alcohol on PCSK9 expression in liver.
Figure 2
Figure 2. Probe-wise association of alcohol use in the prefrontal cortex
(a) Volcano plot depicting the negative natural log of the p-value of association of alcohol abuse (y-axis) as a function of the beta value (x-axis) from a linear model adjusting for age, sex, and neuronal proportion as estimated by the Cell EpigenoType Specific (CETS) algorithm. Data derived from frontal cortex bulk tissue from GEO dataset GSE49393. Three loci were significant after false discovery rate (FDR) based correction for multiple testing including cg00393248 (MYLK4; β= 9.32 ± 1.516, F= 10.061, df= 5/43, P= 2.23×10⁻⁷, FDRP= 0.038), cg19608003 (SLC44A4; β= -13.468 ± 2.011, F= 11.879, df= 5/43, P= 3.54×10⁻⁸, FDRP= 0.015), and cg19955284 (β= -19.036 ± 3.122, F= 9.902, df= 5/43, P= 2.64×10⁻⁷, FDRP= 0.038). (b) Volcano plot depicting the negative natural log of the p-value of association of alcohol abuse in FACs isolated NeuN positive neuronal nuclei from the NICHD cohort (y-axis) as a function of the beta value (x-axis) from a linear model adjusting for age, sex, race, and Body Mass Index (BMI). In neurons, only cg03982998 (LOC100130331; β= 0.087 ± 0.013, F= 10.487, df= 7/51, P= 2.3×10⁻⁸, FDR P= 0.0078) and cg06395265 (ZSWIM1; β= -0.049 ± 0.008, F= 8.967, df= 7/51, P= 2.36×10⁻⁷FDR P= 0.041) were significant after correction for multiple testing.(c) Volcano plot depicting the negative natural log of the p-value of association of alcohol abuse in FACs isolated NeuN negative non-neuronal nuclei from the NICHD cohort (y-axis) as a function of the beta value (x-axis) from a linear model adjusting for age, sex, race, and PMI. (d) A table depicting functional connectivity networks significantly over-represented among AUD associated probes from GEO dataset GSE49393 and isolated neuronal and glial nuclei from the NICHD cohort.Structures analyzed included the anterior cingulate cortex (ACC), orbitofrontal cortex (OFC), insula, amygdala, visual cortex, motor cortex, frontal pole and medial prefrontal cortex (mPFC).
Figure 3
Figure 3. Cross-tissue-specific PCSK9 methylation and association with gene expression and plasma levels
a-c cross-tissue correlations: (a) Mouse syntenic PCSK9 DNA methylation in brain (y-axis) as a function of blood (x-axis) (Rho= 0.51, P= 0.064). (b) A scatterplot of mouse syntenic PCSK9 DNA methylation in brain (y-axis) as a function of liver (x-axis) (Rho= 0.62, P= 0.021). (c) A scatterplot of mouse syntenic PCSK9 DNA methylation in blood (y-axis) as a function of liver (x-axis) (Rho= 0.49, P= 0.087). d-f methylation to expression correlations: (d) Mouse syntenic PCSK9 DNA methylation in blood (y-axis) as a function of liver-specific PCSK9 gene expression (x-axis) (Rho= 0.67, P= 0.0086). (e) Human PCSK9 DNA methylation in blood (y-axis) as a function of liver-specific PCSK9 gene expression from healthy controls (n= 47) (x-axis) (Rho= 0.41, P= 0.046). (f) PCSK9CpG1 DNA methylation (x-axis) as a function of plasma levels of PCSK9 (y-axis) in individuals with AUD (n= 90) (Rho = 0.31, P= 0.0027).
Figure 4
Figure 4. Alcohol exposure leads to lower PCSK9 expression in mice (a,b,c) and humans (d,e)
(a) PCSK9 mRNA expression in liver as a function of alcohol exposure status from mice that underwent the “NIAAA model of chronic and binge ethanol feeding” for 10-day chronic-plus-binge ethanol exposure. PCSK9 expression was significantly lower in the alcohol-exposed group (Student's t-test; Alcohol Exposure= 0.2443± 0.06553, No Alcohol Exposure= 1±0.07283, ****P<0.0001). (b) PCSK9 protein expression in mouse liver was significantly higher in the control group compared to the case group that underwent the “NIAAA model of chronic and binge ethanol feeding” (Student's t-test; Alcohol Exposure= 0.2372± 0.01829, No Alcohol Exposure=0.4867 ± 0.0321, **P<0.01). (c) Western blot of mouse liver PCSK9 levels as assessed by anti-PCSK9 antibody ab125251. (d) Methylation analysis of PCSK9CpG1 in human alcohol-induced end-stage liver disease bulk tissue shows marked increase of methylation which might be due to general toxic effects of alcohol and end-stage organ disease. (Student's t-test; Alcohol Exposure= 46.19 ± 1.07, No Alcohol Exposure= 37.63 ± 0.8867, ****P< 0.0001). (e) mRNA expression analysis of PCSK9 inhuman alcohol-induced end-stage liver disease bulk tissue reveals significantly decreased PCSK9 expression. (Student's t-test; Alcohol Exposure= 0.3517 ± 0.125, No Alcohol Exposure= 0.9992 ± 0.1388, **P< 0.01).
Figure 5
Figure 5. Model for PCSK9 interaction with alcohol
The model shown describes different stages of alcohol exposure and subsequent PCSK9 methylation and expression findings. Consistent with mild use are our finding of alcohol exposure leading to hypomethylation (discovery data sets, Fig. 1a-e, plasma data set, Fig. 2f) with lower expression initially. Chronic alcohol use eventually leads to higher methylation and higher expression (rat data set, Supplementary Fig. 4) whereas alcohol liver toxicity (acute – NIAAA mouse model or chronic – liver transplant cases) leads to high methylation with ultimately low protein expression, consistent with end-stage liver disease (Fig. 4 and Supplementary Fig. 2, 5). Low expression and high methylation might also be affected by changes in cell type composition of tissue, as shown in end-stage liver disease tissue that varies greatly from healthy liver tissue on a global scale (Supplementary Fig. 3, 5). The early mild stage might be due to direct effects on transcription factor binding in the promoter regions (Supplementary Fig. 7), while later might be caused by liver toxicity effects and tissue composition changes (Supplementary Fig. 2, 3, 5).

References

    1. Grant BF, Goldstein RB, Saha TD, Chou SP, Jung J, Zhang H, et al. Epidemiology of DSM-5 alcohol use disorder: results from the National Epidemiologic Survey on Alcohol and Related Conditions III. JAMA psychiatry. 2015;72(8):757–766. - PMC - PubMed
    1. Tawa EA, Hall SD, Lohoff FW. Overview of the Genetics of Alcohol Use Disorder. Alcohol Alcohol. 2016 - PMC - PubMed
    1. Ron D, Barak S. Molecular mechanisms underlying alcohol-drinking behaviours. Nature reviews Neuroscience. 2016;17(9):576–591. - PMC - PubMed
    1. Robison AJ, Nestler EJ. Transcriptional and epigenetic mechanisms of addiction. Nature reviews Neuroscience. 2011;12(11):623–637. - PMC - PubMed
    1. Zhang H, Herman AI, Kranzler HR, Anton RF, Zhao H, Zheng W, et al. Array-based profiling of DNA methylation changes associated with alcohol dependence. Alcohol Clin Exp Res. 2013;37 Suppl 1:E108–115. - PMC - PubMed

Publication types

MeSH terms