. 2017 Aug 8:9:268.
doi: 10.3389/fnagi.2017.00268. eCollection 2017.

Differences in Adipose Tissue and Lean Mass Distribution in Patients with Collagen VI Related Myopathies Are Associated with Disease Severity and Physical Ability

Affiliations

Differences in Adipose Tissue and Lean Mass Distribution in Patients with Collagen VI Related Myopathies Are Associated with Disease Severity and Physical Ability

M A Rodríguez et al. Front Aging Neurosci. .

Abstract

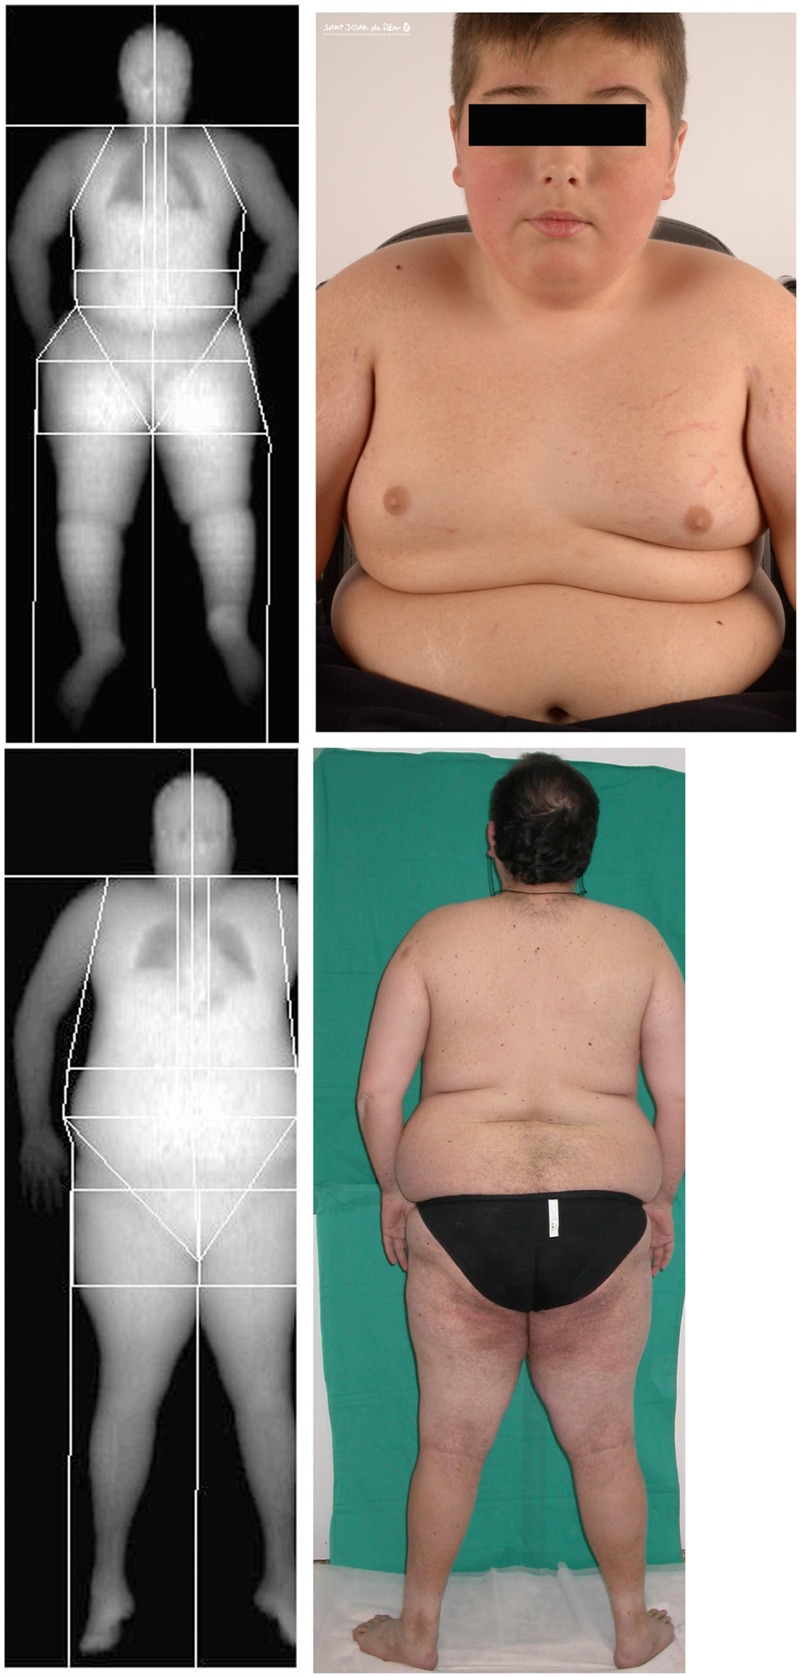
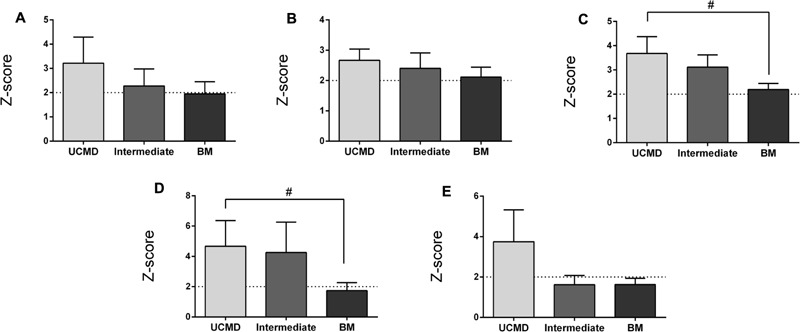
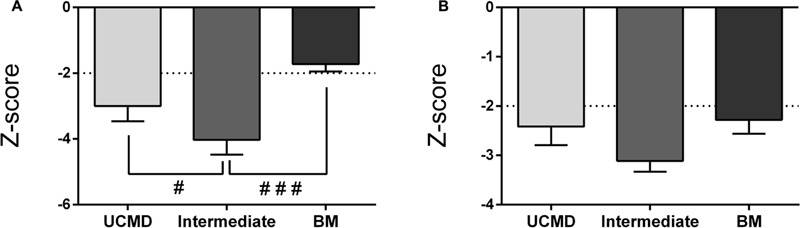
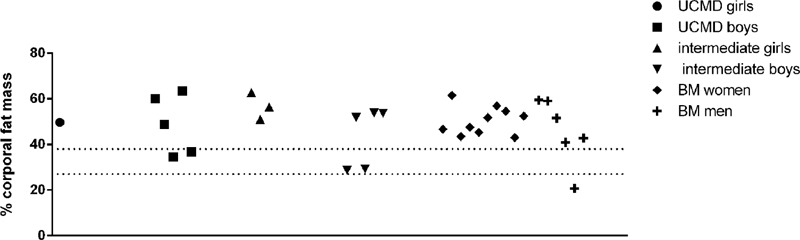
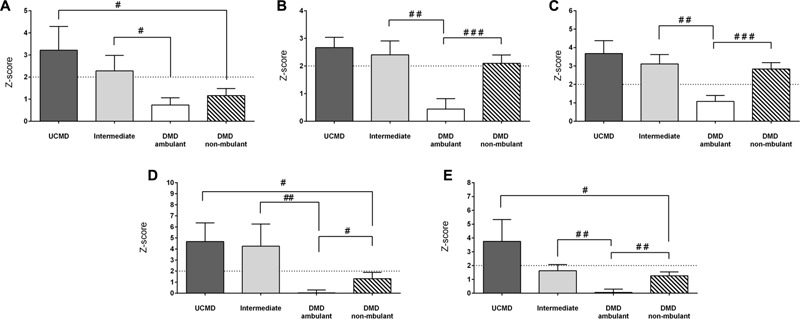
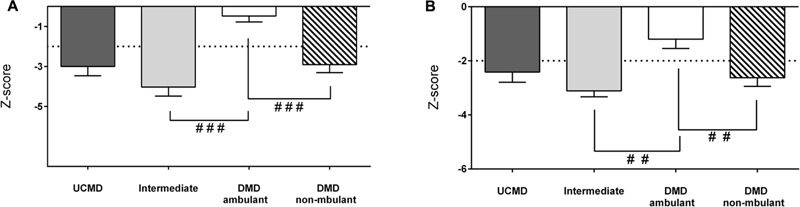
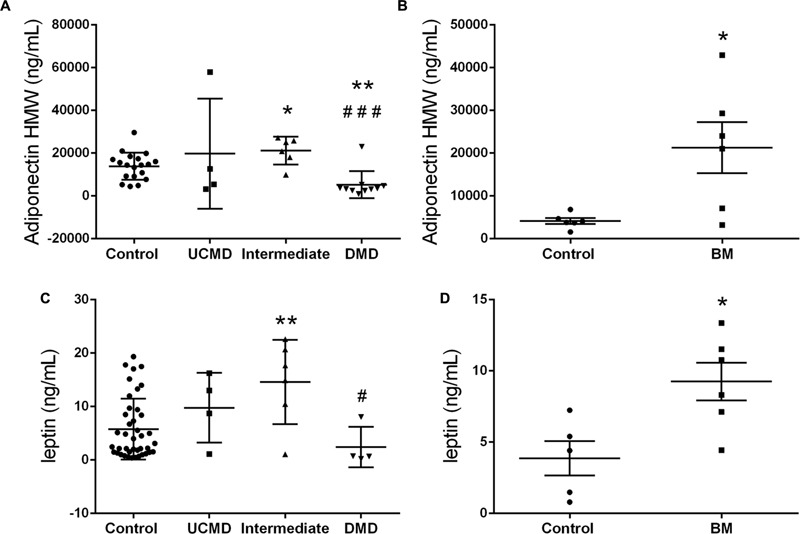
Mutations in human collagen VI genes cause a spectrum of musculoskeletal conditions in children and adults collectively termed collagen VI-related myopathies (COL6-RM) characterized by a varying degree of muscle weakness and joint contractures and which include Ullrich Congenital Muscular Dystrophy (UCMD) and Bethlem Myopathy (BM). Given that collagen VI is one of the most abundant extracellular matrix proteins in adipose tissue and its emerging role in energy metabolism we hypothesized that collagen VI deficiency might be associated with alterations in adipose tissue distribution and adipokines serum profile. We analyzed body composition by means of dual-energy X-ray absorptiometry in 30 pediatric and adult COL6-RM myopathy patients representing a range of severities (UCMD, intermediate-COL6-RM, and BM). We found a distinctive pattern of regional adipose tissue accumulation which was more evident in children at the most severe end of the spectrum. In particular, the accumulation of fat in the android region was a distinguishing feature of UCMD patients. In parallel, there was a decrease in lean mass compatible with a state of sarcopenia, particularly in ambulant children with an intermediate phenotype. All children and adult patients that were sarcopenic were also obese. These changes were significantly more pronounced in children with collagen VI deficiency than in children with Duchenne Muscular Dystrophy of the same ambulatory status. High molecular weight adiponectin and leptin were significantly increased in sera from children in the intermediate and BM group. Correlation analysis showed that the parameters of fat mass were negatively associated with motor function according to several validated outcome measures. In contrast, lean mass parameters correlated positively with physical performance and quality of life. Leptin and adiponectin circulating levels correlated positively with fat mass parameters and negatively with lean mass and thus may be relevant to the disease pathogenesis and as circulating markers. Taken together our results indicate that COL6-RM are characterized by specific changes in total fat mass and distribution which associate with disease severity, motor function, and quality of life and which are clinically meaningful and thus should be taken into consideration in the management of these patients.

Keywords: adiponectin; body composition; collagen VI; leptin; myopathy; obesity; physical ability; sarcopenia.


Figures

FIGURE 1
FIGURE 1
Representative dual-energy X-ray absorptiometry (DXA) scan showing the soft tissues in the different regions analyzed for one of the children with Ullrich Congenital Muscular Dystrophy (UCMD), Top, and an adult patient with Bethlem Myopathy (BM), Bottom, and their corresponding clinical images. Written informed consent was obtained for the publication of this image.
FIGURE 2
FIGURE 2
Changes in amount of fat mass by DXA in UCMD, intermediate phenotype and BM patients in whole body normalized to height squared (fat mass index, FMI) (A), gynecoid region (B), legs (C), trunk (D), and android region (E). Results are expressed as mean on Z-score for each group. Threshold of significance was considered when Z-score ≥ 2 or Z-score ≤ –2 and was indicated with dotted line. #P ≤ 0.05.
FIGURE 3
FIGURE 3
Changes in amount of lean mass by DXA in UCMD, intermediate phenotype and BM patients in whole body normalized to height squared (lean mass index, LMI) (A) and appendicular free fat mass normalized to height squared (AFFMI) (B). Results are expressed as mean on Z-score for each group. Threshold of significance was considered when Z-score ≥ 2 or Z-score ≤ –2 and was indicated with dotted line. #P ≤ 0.05 and ###P ≤ 0.001.
FIGURE 4
FIGURE 4
Representation of the percentage of body fat mass in UCMD, intermediate phenotype and BM patients divided by sex. The percentage of body fat mass of each patient was calculated as the ratio between the value of the total amount of body fat mass and the weight of the patient. The value obtained was multiplied by 100. Dotted lines indicate obesity threshold based on Baumgartner (2000) (>27% for men and >40% in women).
FIGURE 5
FIGURE 5
Changes in amount of fat mass by DXA in UCMD, intermediate phenotype and DMD ambulant and non-ambulant patients in whole body normalized to height squared (FMI) (A), gynecoid region (B), legs (C), trunk (D), and android region (E). Results are expressed as mean on Z-score for each group. Threshold of significance was considered when Z-score ≥ 2 or Z-score ≤ –2 and was indicated with dotted line. #P ≤ 0.05, ##P ≤ 0.01, and ###P ≤ 0.001.
FIGURE 6
FIGURE 6
Changes in amount of lean mass by DXA in UCMD, intermediate phenotype and DMD ambulant and non-ambulant patients in whole body normalized to height squared LMI (A) and appendicular free fat mass normalized to height squared (AFFMI) (B). Results are expressed as mean on Z-score for each group. Threshold of significance was considered when Z-score ≥ 2 or Z-score ≤ –2 and was indicated with dotted line. #P ≤ 0.05, ##P ≤ 0.01, and ###P ≤ 0.001.
FIGURE 7
FIGURE 7
High molecular weight Adiponectin serum levels in UCMD and intermediated phenotype patients relative to controls and DMD patients (A) and in BM patients relative to adult controls (B). Leptin serum levels in UCMD and intermediated phenotype patients relative to controls and DMD patients (C) and in BM patients relative to adult controls (D). Serum samples were analyzed by ELISA technique. Adipokine levels are expressed as mean ± SEM for each group of patients. P ≤ 0.05 and ∗∗P ≤ 0.01 relative to controls and #P ≤ 0.05 and ###P ≤ 0.001 relative to intermediated phenotype.

References

    1. Abou-Samra M., Lecompte S., Schakman O., Noel L., Many M. C., Gailly P., et al. (2015). Involvement of adiponectin in the pathogenesis of dystrophinopathy. Skelet. Muscle 5:25 10.1186/s13395-015-0051-9 - DOI - PMC - PubMed
    1. Antuna-Puente B., Feve B., Fellahi S., Bastard J.-P. (2008). Adipokines: the missing link between insulin resistance and obesity. Diabetes Metab. 34 2–11. 10.1016/j.diabet.2007.09.004 - DOI - PubMed
    1. Asayama K., Hayashibe H., Dobashi K., Uchida N., Nakane T., Kodera K., et al. (2003). Decrease in serum adiponectin level due to obesity and visceral fat accumulation in children. Obes. Res. 11 1072–1079. 10.1038/oby.2003.147 - DOI - PubMed
    1. Baumgartner R. N., Koehler K. M., Gallagher D., Romero L., Heymsfield S. B., Ross R. R., et al. (1998). Epidemiology of sarcopenia among the elderly in New Mexico. Am. J. Epidemiol. 147 755–763. 10.1186/1471-2318-7-5 - DOI - PubMed
    1. Baumgartner R. N., Wayne S. J., Waters D. L., Janssen I., Gallagher D., Morley J. E. (2004). Sarcopenic obesity predicts instrumental activities of daily living disability in the elderly. Obes. Res. 12 1995–2004. 10.1038/oby.2004.250 - DOI - PubMed