. 2017 Aug 11:7:352.
doi: 10.3389/fcimb.2017.00352. eCollection 2017.

A Vibrio vulnificus VvpM Induces IL-1β Production Coupled with Necrotic Macrophage Death via Distinct Spatial Targeting by ANXA2

Affiliations

A Vibrio vulnificus VvpM Induces IL-1β Production Coupled with Necrotic Macrophage Death via Distinct Spatial Targeting by ANXA2

Sei-Jung Lee et al. Front Cell Infect Microbiol. .

Abstract

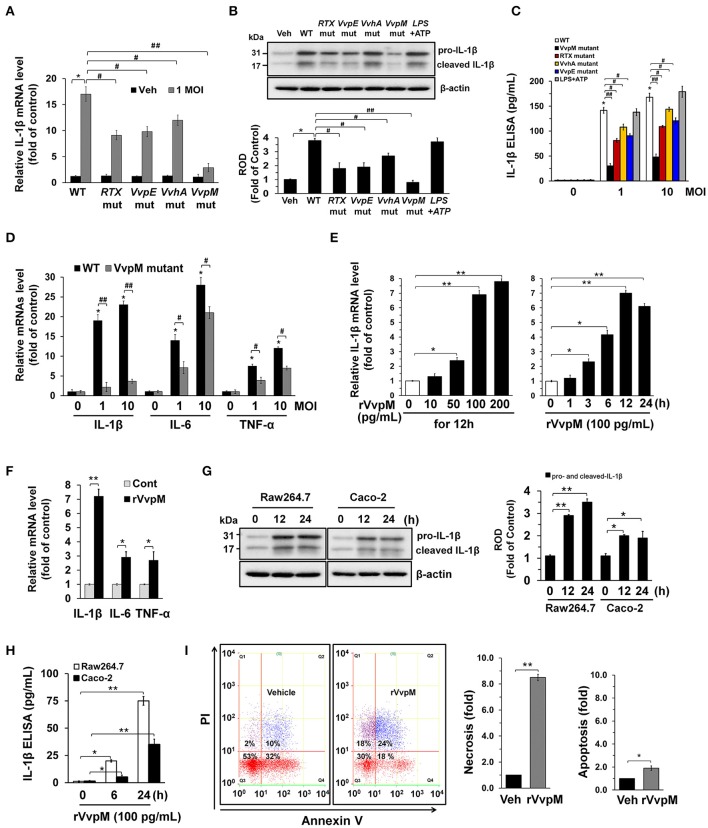
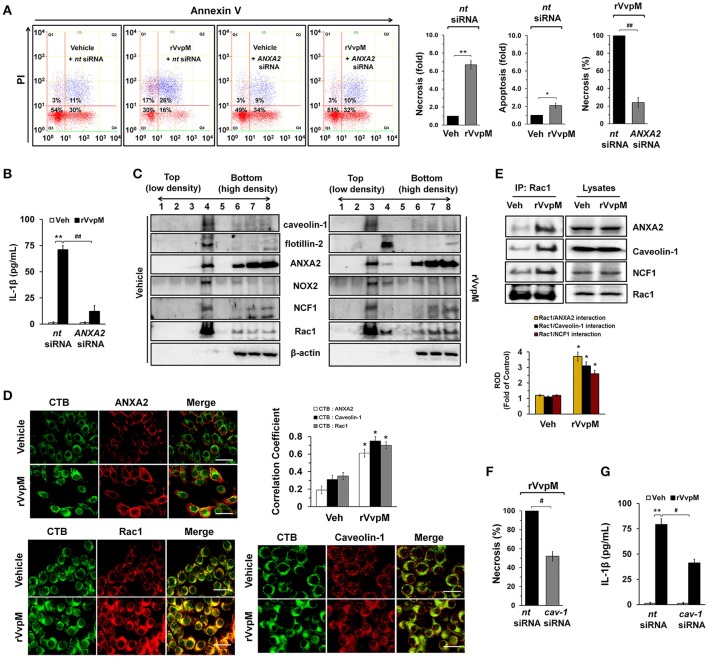
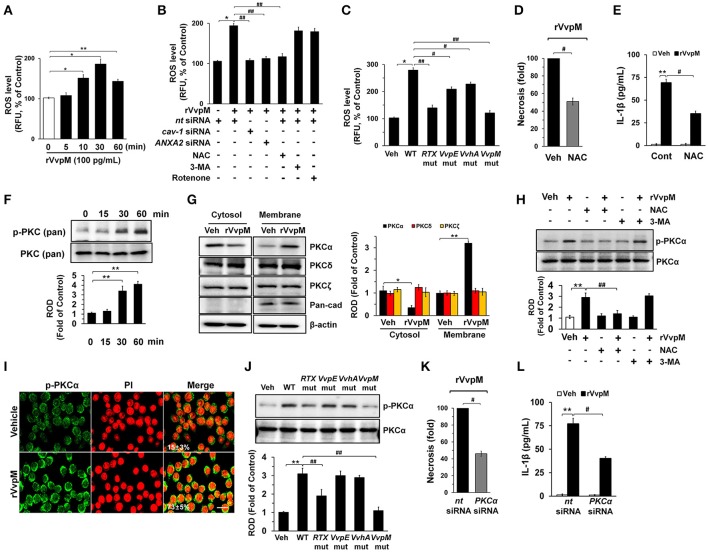
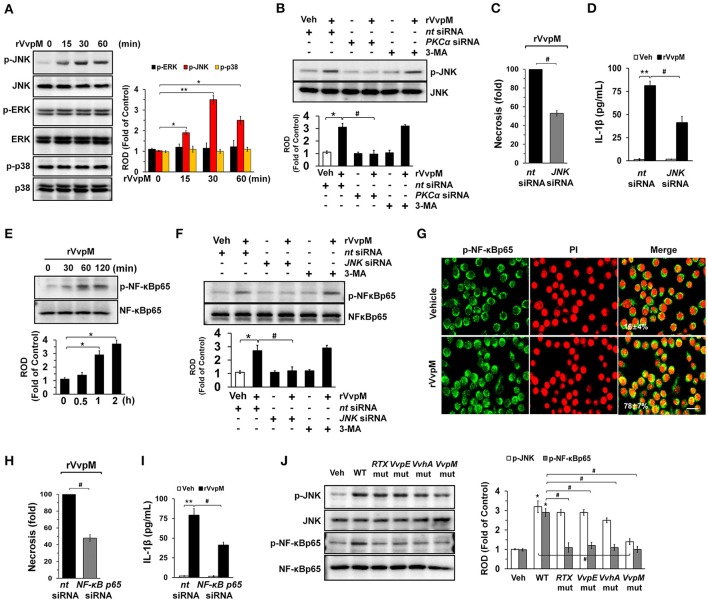
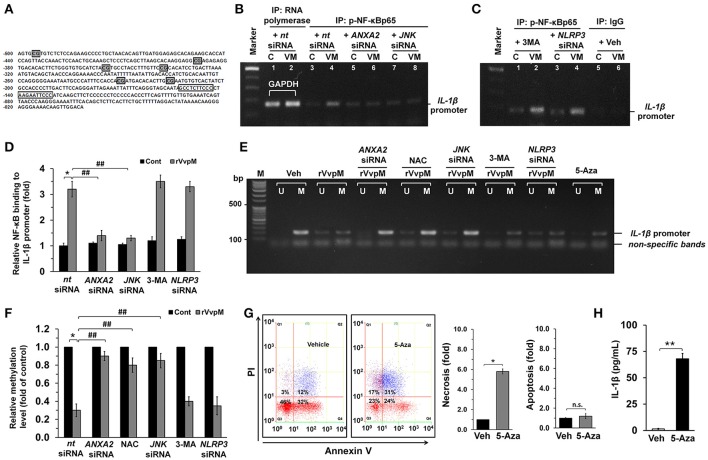
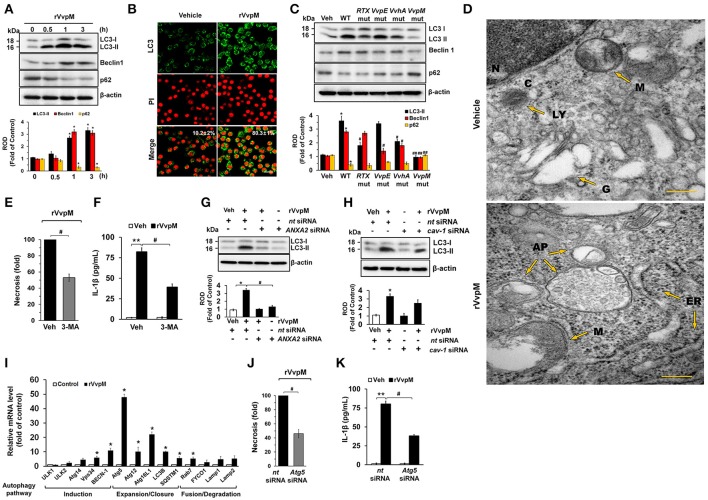
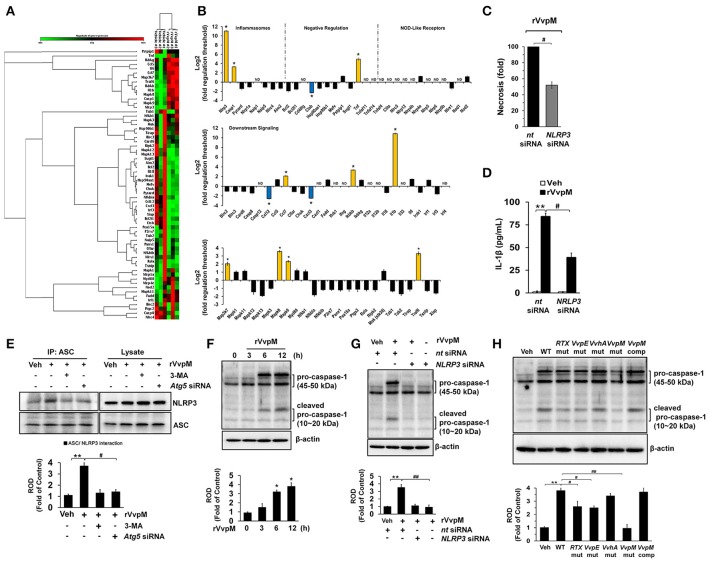
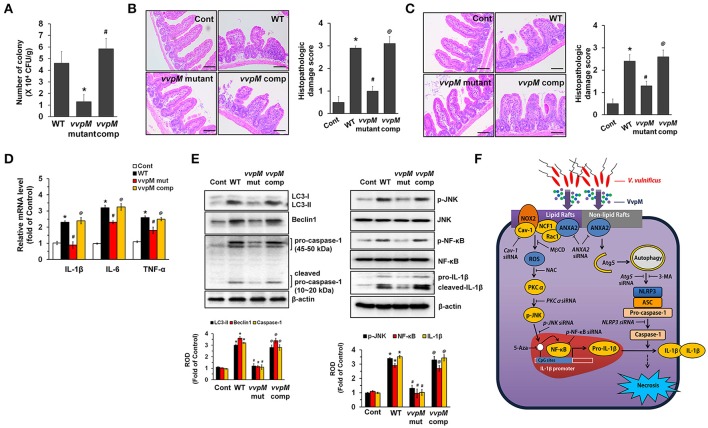
An inflammatory form of phagocyte death evoked by the Gram-negative bacterium Vibrio (V.) vulnificus (WT) is one of hallmarks to promote their colonization, but the virulence factor and infectious mechanism involved in this process remain largely unknown. Here, we identified extracellular metalloprotease VvpM as a new virulence factor and investigated the molecular mechanism of VvpM which acts during the regulation of the inflammatory form of macrophage death and bacterial colonization. Mutation of the vvpM gene appeared to play major role in the prevention of IL-1β production due to V. vulnificus infection in macrophage. However, the recombinant protein (r) VvpM caused IL-1β production coupled with necrotic cell death, which is highly susceptible to the knockdown of annexin A2 (ANXA2) located in both membrane lipid and non-lipid rafts. In lipid rafts, rVvpM recruited NOX enzymes coupled with ANXA2 to facilitate the production of ROS responsible for the epigenetic and transcriptional regulation of NF-κB in the IL-1β promoter. rVvpM acting on non-lipid rafts increased LC3 puncta formation and autophagic flux, which are required for the mRNA expression of Atg5 involved in the autophagosome formation process. The autophagy activation caused by rVvpM induced NLRP3 inflammasome-dependent caspase-1 activation in the promoting of IL-1β production. In mouse models of V. vulnificus infection, the VvpM mutant failed to elevate the level of pro-inflammatory responses closely related to IL-1β production and prevented bacterial colonization. These findings delineate VvpM efficiently regulates two pathogenic pathways that stimulate NF-κB-dependent IL-1β production and autophagy-mediated NLRP3 inflammasome via distinct spatial targeting by ANXA2.

Keywords: ANXA2; Atg5; NLRP3; V. vulnificus; VvpM; cell death; colonization; macrophage.


Figures

Figure 1
Figure 1
V. vulnificus metalloprotease VvpM induces IL-1β production coupled with necrotic cell death. The expression (A), mature form (B), and production (C) of IL-1β in RAW 264.7 murine macrophage cells infected with V. vulnificus (WT), various mutant deficients in RTX, VvpE, VvhA, and VvpM genes, and LPS (10 μg/mL) + ATP (1 mM) for 3 h are shown. Data represent the means ± S.E. (n = 5). (D) The expression of IL-1β, IL-6, and TNF-α in a cells infected with WT or VvpM mutant for 3 h is shown. n = 4. (E) Dose and time responses of rVvpM for 24 h in IL-1β mRNA expression are shown. n = 4. (F) The expression of IL-1β, IL-6, and TNF-α in a cells treated with rVvpM (100 pg/mL) for 12 h is shown. n = 3. (G) The levels of IL-1β mature form in RAW 264.7 and Caco-2 human intestinal epithelial cells treated with rVvpM (100 pg/mL) for 12 h was determined by Western blot. n = 3. (H) The level of IL-1β production in cell treated with rVvpM for 24 h was quantified by ELISA. n = 4. (I) Cells were incubated with rVvpM for 24 h. Percentages of necrosis, survival, and apoptosis were measured by using PI/Annexin V staining and flow cytometry (left panel). PI/Annexin V cells (Q1) were considered necrotic, PI/Annexin V double-positive cells (Q2) were considered late apoptotic, PI/Annexin V cells (Q3) were considered alive, and were PI/Annexin V cells (Q4) were considered early apoptotic. Quantitative analysis of the fold changes of necrotic (Q1) and apoptotic (Q2+Q4) cells by FACS analysis is shown (right panel). n = 3. *P < 0.01 vs. Veh (boiled rVvpM). (A–D) *P < 0.001 vs. Veh (boiled WT). #P < 0.01 and ##P < 0.001 vs. WT, respectively. (E–H) *P < 0.01 and **P < 0.001 vs. cells with no treatment, respectively. ROD, relative optical density.
Figure 2
Figure 2
VvpM facilitates the lipid raft-mediated clustering of ANXA2. (A) Cells transfected with siRNAs for non-targeting (nt) control and ANXA2 were incubated with rVvpM for 24 h. FACS analysis and quantitative analysis of the percentage of necrotic (Q1) cells are shown. Data represent the means ± S.E. (n = 4). (B) The level of IL-1β protein was quantified by ELISA. n = 5. (C) Caveolin-enriched membrane fractions were prepared by discontinuous sucrose density gradient fractionation from the cell treated with rVvpM for 30 min, and the location of caveolin-1, flotillin-2, ANXA2, NOX2, NCF1, and Rac1 was determined by Western blot. n = 3. (D) The increased co-localization of CTB (green) with ANXA2 (red), caveolin-1 (red), and Rac1 (red) was determined by confocal microscopy using immunofluorescence staining. Scale bars, 100 μm (magnification, ×400). n = 3. Graphs represent Pearson's coefficient of colocalization of CTB and ANXA2, CTB and Caveolin-1, and CTB and Rac1 from 10 independent fields. *P < 0.05. (E) Rac1 co-immunoprecipitated with ANXA2, caveolin-1, and NCF1 is shown in the left side. Expression of ANXA2, caveolin-1, NCF1 and Rac1 in total cell lysates is shown in the right side. n = 4. *P < 0.01 vs. Veh (boiled rVvpM). ROD, relative optical density. (F) Cells transfected with nt siRNA and cav-1 siRNA were incubated with rVvpM for 24 h. FACS analysis and quantitative analysis of the percentage of necrotic (Q1) cells are shown; n = 4. (G) The level of IL-1β protein was quantified by ELISA. n = 5. (A,B,F,G) *P < 0.01 and **P < 0.001 vs. nt siRNA + Veh (boiled rVvpM), respectively. #P < 0.05 and ##P < 0.01 vs. nt siRNA + rVvpM, respectively.
Figure 3
Figure 3
VvpM induces ROS production and PKCα phosphorylation. (A) Time responses of rVvpM in ROS production is shown. n = 4. (B) Cells were transfected with siRNAs for cav-1 and ANXA2 for 24 h or pre-treated with NAC (10 μM), 3-MA (10 mM), and rotenone (0.1 μM) for 30 min prior to rVvpM exposure for 30 min. n = 5. (C) Cells infected with WT or various mutant deficients for 30 min is shown. n = 4. (D) Cell were pre-treated with NAC (10 μM) for 30 min prior to rVvpM exposure for 24 h. FACS analysis and quantitative analysis of the percentage of necrotic (Q1) cells are shown. n = 4. (E) The level of IL-1β protein was quantified by ELISA. n = 5. (F) Phosphorylation of pan-PKC is shown. n = 3. (G) Membrane translocation of PKC isoforms in cells treated with rVvpM for 30 min is shown. Pan-cadherin was used as a membrane control. n = 3. (H) Phosphorylation of PKCα in cells pre-treated with NAC and 3-MA for 30 min prior to rVvpM exposure for 30 min is shown. n = 3. (I) Expression of PKCα (green) was determined by confocal microscopy. The cell numbers showing membrane translocalization of PKCα per microscopic filed were directly counted and converted to a percentage by multiplying by 100. Ten random fields per coverslip were counted. Data represent the mean ± S.E. n = 3. (J) Phosphorylation of PKCα in a cells infected with WT or various mutant deficients for 30 min is shown. n = 4. (K) Cells transfected with PKCα siRNA were incubated with rVvpM for 24 h. FACS analysis and quantitative analysis of the percentage of necrotic (Q1) cells are shown. n = 4. (G) The level of IL-1β protein was quantified by ELISA. n = 5. (A,F) *P < 0.01 and **P < 0.001 vs. cells with no treatment, respectively. (B,K,L) *P < 0.05 and **P < 0.01 vs. Veh (boiled WT), respectively. #P < 0.05 and ##P < 0.01 vs. nt siRNA + rVvpM, respectively. (C,J) *P < 0.05 and **P < 0.01 vs. Veh (boiled WT), respectively. #P < 0.05 and ##P < 0.01 vs. WT, respectively. (D,E) **P < 0.01 vs. Veh (boiled rVvpM). #P < 0.05 and ##P < 0.01 vs. Veh + rVvpM, respectively. (G,H) *P < 0.01 and **P < 0.001 vs. Veh (boiled rVvpM), respectively. ##P < 0.05 vs. rVvpM alone. ROD, relative optical density; RFU, relative fluorescence units.
Figure 4
Figure 4
VvpM induces the activation of JNK and NF-κBp65 to promote IL-1β expression. (A) The effect of rVvpM on the expression of MAPK was determined by western blot. n = 3. (B) Cells were transfected with PKCα siRNA for 24 h prior to rVvpM exposure for 30 min. n = 3. (C) Cells were transfected with JNK siRNA for 24 h prior to rVvpM exposure for 24 h. FACS analysis and quantitative analysis of the percentage of necrotic (Q1) cells are shown. n = 4. (D) The level of IL-1β protein was quantified by ELISA. n = 5. (E) Time responses of rVvpM in the phosphorylation of NF-κBp65 are shown. n = 3. (F) Cells were transfected with JNK siRNA for 24 h or pre-treated with 3-MA (10 mM) for 30 min prior to rVvpM exposure for 60 min. n = 3. (G) p-NF-κBp65 (green) was detected by confocal microscopy. The cell numbers showing nuclear translocalization of p-NF-κBp65 per microscopic filed were directly counted and converted to a percentage by multiplying by 100. Ten random fields per coverslip were counted. Data represent the mean ± S.E. Scale bars, 100 μm. n = 3. (H) Cells transfected with NFBp65siRNA were incubated with rVvpM for 24 h. FACS analysis and quantitative analysis of the percentage of necrotic (Q1) cells are shown. n = 4. (I) The level of IL-1β protein was quantified by ELISA. n = 5. (J) Phosphorylation of JNK and NF-κBp65 in a cells infected with WT or various mutant deficients for 30 min are shown. n = 4. (A,E) *P < 0.05 and **P < 0.01 vs. cells with no treatment, respectively. (B–D,F,H,I) *P < 0.01 and **P < 0.001 vs. nt siRNA + Veh (boiled rVvpM), respectively. #P < 0.01 vs. nt siRNA + rVvpM. (J) *P < 0.01 vs. Veh (boiled WT). #P < 0.01 vs. WT, ROD; relative optical density.
Figure 5
Figure 5
Regulatory effect of VvpM on the interaction of NF-κB with the IL-1β promoter. (A) The NF-κB binding sites and methylation site in the IL-1β promoter are shown. The open boxes and shaded box represent the consensus sequences of NF-κB and the methylation site, respectively. (B,C) Cells were transfected with siRNAs for ANXA2, JNK, and NLRP3 for 24 h or pre-treated with 3-MA (10 mM) for 30 min prior to rVvpM exposure for 60 min. Cells were then fixed with formaldehyde, and cell extracts were immunoprecipitated (IP) with anti-p-NF-κBp65 to detect bound IL-1β promoter DNA fragments. A representative agarose gel following RT-PCR is shown. n = 3. Normal mouse IgG or anti-RNA polymerase II antibody was used as negative or positive control for the ChIP, respectively. C, control. VM, rVvpM. (D) The level of p-NF-κBp65 binding to IL-1β promoter was quantified by qRT-PCR. Anti-RNA polymerase II antibody was used internal control. n = 3. (E) Genomic DNA of the cells transfected with siRNAs for ANXA2, JNK, and NLRP3 for 24 h or pre-treated with NAC (10 μM), 3-MA (10 mM), and 5-aza (1 μM) for 30 min prior to rVvpM exposure for 60 min was prepared. Changes in the IL-1β promoter methylation status were determined by MSP analysis. U, unmethylated form. M, methylated form. (F) The level of IL-1β methylation was quantified by qRT-PCR. Relative level of IL-1β methylation is shown, compared to the unmethylated form. n = 4. (G) Cell were treated with 5-aza (1 μM) for 24 h. FACS analysis (left panel) and quantitative analysis of the fold changes of necrotic (Q1) and apoptotic (Q2+Q4) cells by FACS analysis is shown (right panel). n = 4. (H) The level of IL-1β protein was quantified by ELISA. n = 5. (D,F) *P < 0.01 vs. nt siRNA + Veh (boiled rVvpM). ##P < 0.01 vs. nt siRNA + rVvpM. (G,H) *P < 0.01 and **P < 0.001 vs. cells with no treatment, respectively.
Figure 6
Figure 6
VvpM induces autophagy by regulating non-lipid raft ANXA2. (A) The effect of rVvpM on expressions of autophagy-related proteins, LC3, Beclin-1, and p62 were determined by Western blot. Data represent the mean ± S.E. n = 4. (B) LC3 expression (green) in cells treated with rVvpM for 3 h was visualized by confocal microscopy and quantified by using Image J program, which measures the stained area per microscopic filed with consistent threshold. Scale bars, 100 μm. n = 4. (C) The expressions of autophagy-related proteins in a cells infected with WT or various mutant deficients for 1 h are shown. n = 4. *P < 0.05 vs. Veh (boiled WT). #P < 0.05 and ##P < 0.01 vs. WT, respectively. (D) Formation of autophagic vesicles in cells treated with rVvpM for 3 h was visualized by transmission electron microscopy. Scale bars, 100 nm. n = 3. AP, autophagosome; C, cytosol; ER, endoplasmic reticulum; N, nucleus; G, golgi body; M, mitochondria. (E) Cells were pre-treated with 3-MA (10 mM) for 30 min prior to rVvpM exposure for 24 h. FACS analysis and quantitative analysis of the percentage of necrotic (Q1) cells are shown. n = 4. (F) The level of IL-1β protein was quantified by ELISA. n = 5. LC3 expression in cells transfected with siRNAs for ANXA2 (G) and cav-1 (H) for 24 h prior to rVvpM exposure for 3 h. (I) The effect of rVvpM on the expression of autophagy-related proteins was evaluated by qRT-PCR. The expression level of Atg5 and Atg16L1 was markedly increased by rVvpM treatment. n = 4. (J) Cells transfected with Atg5 siRNA were incubated with rVvpM for 24 h. FACS analysis and quantitative analysis of the percentage of necrotic (Q1) cells are shown. n = 4. (K) The level of IL-1β protein was quantified by ELISA. n = 5. (A,I) *P < 0.01 vs. cells with no treatment. (E,F) **P < 0.01 vs. Veh (boiled rVvpM). #P < 0.05 vs. Veh + rVvpM. (G,H,J,K) *P < 0.05 and **P < 0.01 vs. nt siRNA + Veh (boiled rVvpM), respectively. #P < 0.05 and ##P < 0.01 vs. nt siRNA + rVvpM, respectively. ROD, relative optical density.
Figure 7
Figure 7
NLRP3 inflammasome is a downstream mediator of autophagy. (A,B) The mRNA expression levels of genes within the inflammasome pathway in cells treated with rVvpM for 24 h are shown. Expression of 84 genes involved in the inflammasome pathway assessed by RT2 Profiler PCR array, according to the manufacturer's instructions. Heat maps were generated and genes hierarchically clustered by Euclidean distance and single linkage by using the GeneGlobe Data Analysis Center on QIAGEN's website at http://www.qiagen.com/kr/shop/genes-and-pathways/data-analysis-center-overview-page/. n = 3. *P < 0.01 vs. Veh (boiled rVvpM). (C) Cells transfected with NLRP3 siRNA were incubated with rVvpM for 24 h. FACS analysis and quantitative analysis of the percentage of necrotic (Q1) cells are shown. n = 4. (D) The level of IL-1β protein was quantified by ELISA. n = 5. (E) ASC co-immunoprecipitated with NLRP3 is shown (left side). Expression of ASC and NLRP3 in total cell lysates is shown (right side). n = 4. **P < 0.01 vs. Veh (boiled rVvpM). #P < 0.05 vs. rVvpM alone. (F) The effect of rVvpM on the expression of caspase-1 was determined by western blot. n = 3. **P < 0.01 vs. cells with no treatment. (G) Cells transfected with NLRP3 siRNA were incubated with rVvpM for 6 h. n = 3. **P < 0.01 vs. nt siRNA + Veh (boiled rVvpM). ##P < 0.01 vs. nt siRNA + rVvpM. (H) The expression of caspase-1 in a cells infected with WT, various mutant deficient, or complemented VvpM mutant for 2 h are shown. n = 4. **P < 0.01 vs. Veh (boiled WT). #P < 0.05 vs. WT. (E–H) ROD, relative optical density.
Figure 8
Figure 8
VvpM contributes to the intestinal colonization of V. vulnificus. (A) Mice inoculated with WT, boiled WT (Cont), VvpM mutant, and VvpM complement (comp) at 1.3 × 10⁹ CFU/mL, and sacrificed 16 h later. Colonization activities were determined. n = 10. (B) Representative ileum tissues stained with H&E are shown (left panel). n = 10. Scale bars represent 100 μm. Average scores of histopathologic damage index from mouse ileum is shown (right panel). n = 10. *P < 0.01 vs. Cont. #P < 0.05 vs. WT. @P < 0.05 vs. VvpM mutant. (C) Closed ileal loop in mice was instilled with 100 μl of PBS containing WT, boiled WT (Cont), VvpM mutant, or VvpM complement (comp) at 1.3 × 10⁹ CFU/mL, and sacrificed 2 h later. Representative ileum tissues stained with H&E are shown (left panel). n = 10. Scale bars represent 100 μm. Average scores of histopathologic damage index from mouse ileum is shown (right panel). n = 10. *P < 0.05 vs. Cont. #P < 0.05 vs. WT. @P < 0.05 vs. VvpM mutant. (D) The expression levels of pro-inflammatory cytokines (IL-1β, IL-6, and TNF-α) in ileal-ligated mouse model are shown. n = 5. *P < 0.01 vs. Cont. #P < 0.05 vs. WT. @P < 0.05 vs. VvpM mutant. (E) The expression of LC3-II, Beclin 1, Caspase-1 and IL-1β, and the phosphorylation of JNK and NF-κB were determined by western blot. n = 4. *P < 0.01 vs. Cont. #P < 0.01 vs. WT. @P < 0.01 vs. VvpM mutant. (F) A hypothetical model for VvpM-induced signaling pathway, where VvpM regulates two pathogenic pathways that stimulate NF-κB-dependent IL-1β production and autophagy-mediated NLRP3 inflammasome via spatial targeting distinct ANXA2.

References

    1. Antic I., Biancucci M., Zhu Y., Gius D. R., Satchell K. J. (2015). Site-specific processing of Ras and Rap1 Switch I by a MARTX toxin effector domain. Nat. Commun. 6:7396. 10.1038/ncomms8396 - DOI - PMC - PubMed
    1. Birmingham C. L., Canadien V., Gouin E., Troy E. B., Yoshimori T., Cossart P., et al. . (2007). Listeria monocytogenes evades killing by autophagy during colonization of host cells. Autophagy 3, 442–451. 10.4161/auto.4450 - DOI - PubMed
    1. Birmingham C. L., Smith A. C., Bakowski M. A., Yoshimori T., Brumell J. H. (2006). Autophagy controls Salmonella infection in response to damage to the Salmonella-containing vacuole. J. Biol. Chem. 281, 11374–11383. 10.1074/jbc.M509157200 - DOI - PubMed
    1. Biswas D., Qureshi O. S., Lee W.-Y., Croudace J. E., Mura M., Lammas D. A. (2008). ATP-induced autophagy is associated with rapid killing of intracellular mycobacteria within human monocytes/macrophages. BMC Immunol. 9:35. 10.1186/1471-2172-9-35 - DOI - PMC - PubMed
    1. Cemma M., Brumell J. H. (2012). Interactions of pathogenic bacteria with autophagy systems. Curr. Biol. 22, R540–R545. 10.1016/j.cub.2012.06.001 - DOI - PubMed

Publication types

MeSH terms

Supplementary concepts

LinkOut - more resources