. 2017:1613:371-402.
doi: 10.1007/978-1-4939-7027-8_15.

Comprehensive Analyses of Tissue-Specific Networks with Implications to Psychiatric Diseases

Affiliations

Comprehensive Analyses of Tissue-Specific Networks with Implications to Psychiatric Diseases

Guan Ning Lin et al. Methods Mol Biol. 2017.

Abstract

Recent advances in genome sequencing and "omics" technologies are opening new opportunities for improving diagnosis and treatment of human diseases. The precision medicine initiative in particular aims at developing individualized treatment options that take into account individual variability in genes and environment of each person. Systems biology approaches that group genes, transcripts and proteins into functionally meaningful networks will play crucial role in the future of personalized medicine. They will allow comparison of healthy and disease-affected tissues and organs from the same individual, as well as between healthy and disease-afflicted individuals. However, the field faces a multitude of challenges ranging from data integration to statistical and combinatorial issues in data analyses. This chapter describes computational approaches developed by us and the others to tackle challenges in tissue-specific network analyses, with the main focus on psychiatric diseases.

Keywords: Alternatively spliced isoforms; Autism; Copy number variants; De novo mutations; Gene expression; Genetics; Network analyses; Protein–protein interactions; Psychiatric diseases; Systems biology.


Figures

Figure 1
Figure 1. Schematic representation of the multilayer analyses of disease networks leading to the identification of the disease-relevant pathways
Three layers of network complexity are considered (left panels): top, the CNV-level network, where proteins encoded by genes from the same copy number variant (CNV) are grouped into one network node and the interactions of these proteins are merged; middle, the gene-level network, where each network node represents one gene/protein; bottom, the isoform-level network, where a new layer of complexity is added by splitting gene nodes into multiple splicing isoform nodes. (Right panels) Various types of analyses carried out on the networks. Examples of disease-relevant pathways are shown at the bottom and represent potential new disease biomarkers or drug targets.
Figure 2
Figure 2. Schematic representation of the binding enrichment analysis of disease network
The top grids represent disease-related network (left) and the human interactome (HI) as a control network (right). The Y2H screens share the same prey search space (~15,000 ORFs). The lower figure shows how the binding enrichment is calculated for two preys (A and B) present in both, disease and control networks. Prey A, but not prey B, interacts with a greater number of disease baits than expected from the control HI network. The counts should be normalized by the bait search space. For each prey, FDisease is the fraction of all disease network baits binding to the common preys, and FHI is the fraction of all control HI baits binding to the common preys.
Figure 3
Figure 3. Disease network connectivity analyses
Interacting partners of the disease genes are tightly connected at the protein level. (Left panel) A significantly higher number of interactors of the disease proteins are connected when mapped to the control background network compared to random control. (Right panel) Shorter paths among the interacting partners of the disease network can be detected by mapping them to the control network and comparing the path length to the empirical null distribution of connectivity of 10,000 sets of preys randomly selected from the control network.
Figure 4
Figure 4. Co-expression network analysis using WGCNA
Network analysis dendrogram shows the modules based on the co-expression topological overlap of genes within the network. Color bars below the dendrogram give information on module membership; the enriched GO terms for largest module (M1) are shown below the dendrogram with the turquoise horizontal bar indicating the significance of the enrichments.
Figure 5
Figure 5. Protein-protein interactions create a more comprehensive connectivity map among disease candidate genes
The disease network is clustered into three distinct subnetworks (colored spheres) consisting of functionally related groups of genes (grey ovals) based on the shared co-GO annotations (dotted edges). The newly identified PPIs (red edges) link these subnetworks into a single connected component.
Figure 6
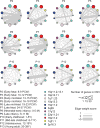
Figure 6. The CNV-CNV co-expression networks
Each CNV is shown as a circle with different color and size. The size of the circle reflects the number of genes in each CNV. The edge represents the normalized fraction of co-expressed gene pairs between different CNVs. PCW: post conception weeks; M: months; Y: years.
Figure 7
Figure 7. Simulation of the expression level changes of CNV genes
(a) Simulated expression level changes of highly- and lowly-expressed CNV genes as a result of duplications and deletions. (b) Percentile ranking of the expression levels of all human genes. The CNV genes were defined as highly- or lowly-expressed based on the 80th and 20th percentiles cut-off relative to all human genes. (c) MAPK3 and KCTD13 are highly expressed CNV genes (>80th percentile rank), whereas CHD1L and GJA5 are lowly expressed CNV genes (<20th percentile rank). (d) Examples of simulated expression changes of KCTD13 and CHD1L across developmental periods as a result of the deletion and duplication.
Figure 8
Figure 8. Overview of the method for identifying co-expressed and interacting pairs with altered expression in the 16p11.2 deletion and duplication carriers
(a) Left panel: The procedure for identification of the ‘partner-alike genes’ to build the expected distributions of correlation coefficients for control, 16p11.2 deletion and duplication carriers. Upper right panel: Pairwise Spearman Correlation Coefficients (SCCs) were calculated between CNV genes (G1, G2, G3) and their partners (P1, P2, P3), as well as CNV genes with partner-alike genes (A, C, E). Lower right panel: The distributions of SCCs between CNV genes and ‘partner-alike genes’ in the control (gray line), deletion (red line) and duplication (blue line) carriers as well as SCCs between G1 and P1 in the same datasets. (b) The distribution of SCCs for KCTD13-CUL3 pair in ten randomly selected sets (six samples each) of control subjects (multicolored lines), six deletion carriers (red line) and six duplication carriers (blue line). Reprinted from [9].
Figure 9
Figure 9. The CNV-CNV network links CNV nodes into a single connected component
Genes (small black circles) within the same CNV node are grouped into nodes (larger grey circles), edges (blue lines) correspond to PPIs. The disease CNV-CNV network connects all 27 CNVs into a single connected component.
Figure 10
Figure 10. Isoform-level protein-protein interactions network
Bidirectional isoform-level network can only be constructed when isoform-level information for both, baits and preys, is available. Each isoform is shown as a small dark circle with the number inside, and isoforms from the same gene are grouped into grey ellipses. The red edges represent isoform-level protein-protein interactions. Different isoforms may have different interaction patterns.
Figure 11
Figure 11. The Jaccard distance measures interaction profile dissimilarity of protein isoforms encoded by the same gene
The network genes with two or more isoforms with PPIs can be arranged in order of increasing fraction of differences in interacting partners (Jaccard distance). The PPI matrices are shown for three proteins, A, B and C. The blue squares within a matrix represent positive interactions, the grey squares represent negative interactions. In network representations, nodes corresponding to multiple isoforms of the same gene are shown as grey circles, and their interacting partners are shown as grey triangles. The dark grey edges are interactions of one isoform, and the red edges are interactions of the other isoform of the same gene.
Figure 12
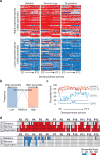
Figure 12. The example of different isoforms of the CTBP1 gene interacting with different isoform partners during human brain development
(a) Expression values of two different isoforms of CTBP1 gene across different brain developmental periods (P2–P13, fetal to adult). (b) Exon-intron structure of CTBP1 isoforms. (c) Static PPIs between CTBP1 isoforms and the isoforms of their interacting partners. (d) The heatmap shows co-expression between interacting isoform pairs across brain developmental periods (P2–P13). Green color represents negative correlation and red color represents positive correlation. The dynamic networks below the heatmap are constructed by integrating co-expression with PPIs; note network changes in different brain developmental periods.

References

    1. Gratten J, Wray NR, Keller MC, Visscher PM. Large-scale genomics unveils the genetic architecture of psychiatric disorders. Nat Neurosci. 2014;17(6):782–790. doi: 10.1038/nn.3708. - DOI - PMC - PubMed
    1. Parikshak NN, Gandal MJ, Geschwind DH. Systems biology and gene networks in neurodevelopmental and neurodegenerative disorders. Nat Rev Genet. 2015;16(8):441–458. doi: 10.1038/nrg3934. http://www.nature.com/nrg/journal/v16/n8/abs/nrg3934.html#supplementary-.... - DOI - PMC - PubMed
    1. Goh KI, Cusick ME, Valle D, Childs B, Vidal M, Barabasi AL. The human disease network. Proc Natl Acad Sci U S A. 2007;104(21):8685–8690. - PMC - PubMed
    1. Vidal M, Cusick ME, Barabasi AL. Interactome networks and human disease. Cell. 2011;144(6):986–998. doi: 10.1016/j.cell.2011.02.016. S0092-8674(11)00130-9 [pii] - DOI - PMC - PubMed
    1. Kang HJ, Kawasawa YI, Cheng F, Zhu Y, Xu X, Li M, Sousa AM, Pletikos M, Meyer KA, Sedmak G, Guennel T, Shin Y, Johnson MB, Krsnik Z, Mayer S, Fertuzinhos S, Umlauf S, Lisgo SN, Vortmeyer A, Weinberger DR, Mane S, Hyde TM, Huttner A, Reimers M, Kleinman JE, Sestan N. Spatio-temporal transcriptome of the human brain. Nature. 2011;478(7370):483–489. doi: 10.1038/nature10523. nature10523 [pii] - DOI - PMC - PubMed

LinkOut - more resources