. 2017 Sep 27;139(38):13518-13524.
doi: 10.1021/jacs.7b07311. Epub 2017 Sep 15.

Mechanism of Nitrogenase H2 Formation by Metal-Hydride Protonation Probed by Mediated Electrocatalysis and H/D Isotope Effects

Affiliations

Mechanism of Nitrogenase H2 Formation by Metal-Hydride Protonation Probed by Mediated Electrocatalysis and H/D Isotope Effects

Nimesh Khadka et al. J Am Chem Soc. .

Abstract

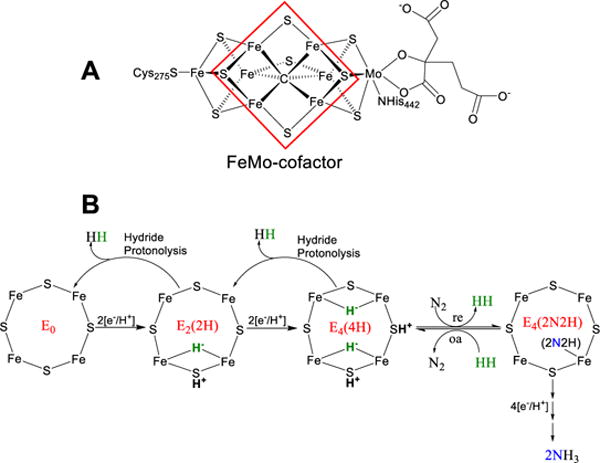
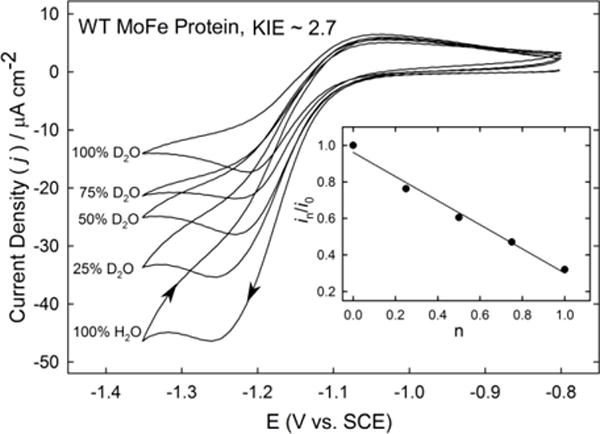
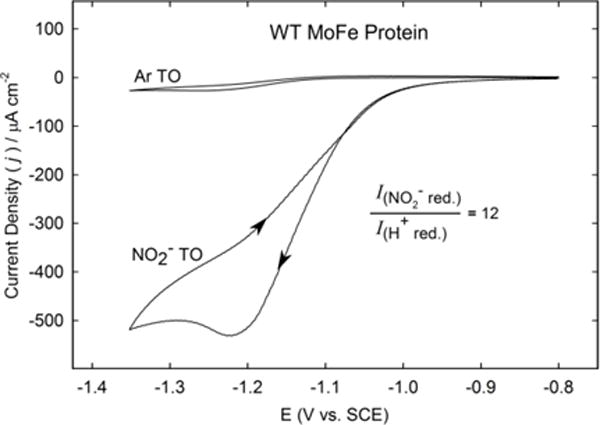
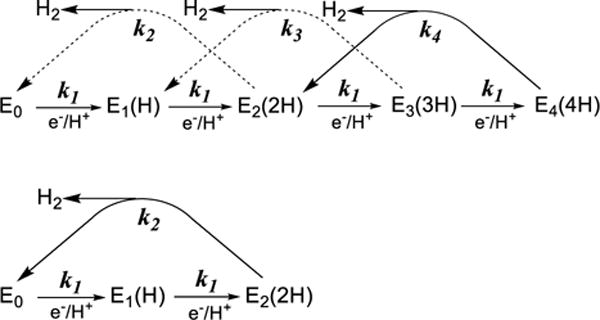
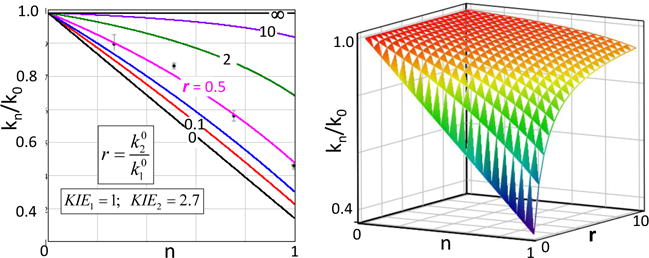
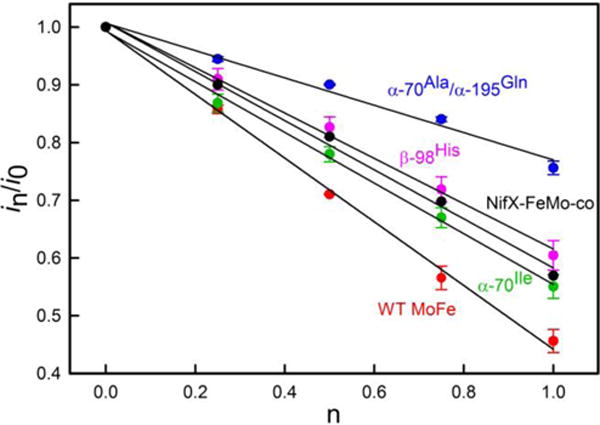
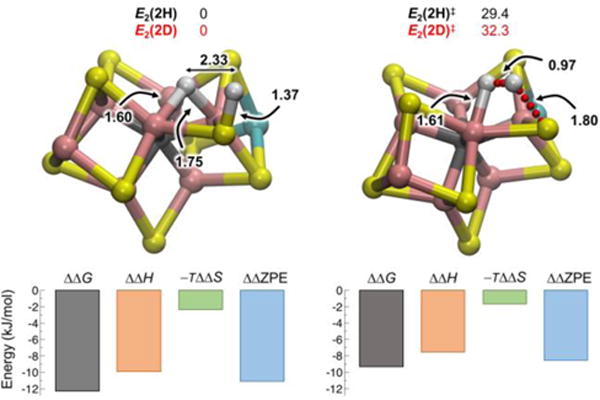
Nitrogenase catalyzes the reduction of dinitrogen (N2) to two ammonia (NH3) at its active site FeMo-cofactor through a mechanism involving reductive elimination of two [Fe-H-Fe] bridging hydrides to make H2. A competing reaction is the protonation of the hydride [Fe-H-Fe] to make H2. The overall nitrogenase rate-limiting step is associated with ATP-driven electron delivery from Fe protein, precluding isotope effect measurements on substrate reduction steps. Here, we use mediated bioelectrocatalysis to drive electron delivery to the MoFe protein allowing examination of the mechanism of H2 formation by the metal-hydride protonation reaction. The ratio of catalytic current in mixtures of H2O and D2O, the proton inventory, was found to change linearly with the D2O/H2O ratio, revealing that a single H/D is involved in the rate-limiting step of H2 formation. Kinetic models, along with measurements that vary the electron/proton delivery rate and use different substrates, reveal that the rate-limiting step under these conditions is the H2 formation reaction. Altering the chemical environment around the active site FeMo-cofactor in the MoFe protein, either by substituting nearby amino acids or transferring the isolated FeMo-cofactor into a different peptide matrix, changes the net isotope effect, but the proton inventory plot remains linear, consistent with an unchanging rate-limiting step. Density functional theory predicts a transition state for H2 formation where the S-H+ bond breaks and H+ attacks the Fe-hydride, and explains the observed H/D isotope effect. This study not only reveals the nitrogenase mechanism of H2 formation by hydride protonation, but also illustrates a strategy for mechanistic study that can be applied to other oxidoreductase enzymes and to biomimetic complexes.


Conflict of interest statement

Notes

The authors declare no competing financial interest.

Figures

Figure 1
Figure 1
(A) Schematic representation of the FeMo-cofactor with α-Cys275, α-His442 and R-homocitrate as ligands. The red highlighted square represents the catalytically active 4Fe-4S face of the FeMo-cofactor. (B) Shown are the En states of FeMo-cofactor during accumulation of the first four electrons/protons, along with the reductive elimination/oxidative addition (re/oa) mechanism at E4(4H). The “2N2H” intermediate implies a species at the diazene reduction level of unknown structure and coordination geometry.
Figure 2
Figure 2
Cyclic voltammogram (CV) for wild type MoFe protein. CV for wild type MoFe protein was collected using CC as an electron mediator. Shown is the current density (j) as a function of the applied potential at different percentages of D2O. The current was measured at −1.26 V, −1.25 V, −1.24, −1.24 V, and −1.24 V for 100% H2O, 25% D2O, 50% D2O, 75% D2O and 100% D2O, respectively. The non-catalytic current was subtracted from the observed current to get the net catalytic current. In the inset, the ratio of net current at n fraction of D2O (in) to the catalytic current in 0 % D2O (i0) is plotted against the mole fraction (n) of D2O. The line is a fit of the data to the Gross-Butler equation for a one proton transfer (eqn 1), where the solvent isotope effect is 2.7. Condition: 250 mM HEPES pH/pD = 7.2), 667 μM CC and a scan rate of 2 mV/s at 23°C.
Figure 3
Figure 3
Cyclic voltammogram for wild type MoFe protein turnover (TO) under Ar (Ar TO) and turnover in nitrite (NO2 TO). Condition: 250 mM HEPES pH 7.2, 667 μM CC, 50 mM NO2 and scan rate of 2 mV/s at 23°C.
Figure 4
Figure 4
(Top) Kinetic scheme for accumulation of protons and electrons on FeMo-co and loss of H2. The rate constants for ET are all taken to be k1, while the rate constants for H2 loss are k2, k3, and k4. (Top) Shown is relaxation from E4(4H) (solid line), E3(3H) and E2(2H); dashed lines indicate pathways suppressed in mediated electrochemistry (see text). (Bottom) Equivalent truncated catalytic cycle for H2 formation involving E0, E1, and E2.
Figure 5
Figure 5
Proton inventory plots (eq 6). (Left) Predicted plots of in/i0 versus fraction of D2O in buffer (n) at the indicated KIEi for selected values of r; also, blue, 0.2; points, inventory as measured for [CC] = 50 μM (Right) A 3D plot of the proton inventory (eq 6) as function of (n, r).
Figure 6
Figure 6
Proton inventory plot MoFe proteins. Shown are the proton inventory plots for wild type (red), β-98Tyr➔His (magenta), α-70Val➔Ile (green), α-70Val➔Ala/α-195His➔Gln (blue) MoFe protein and nifX-FeMo-cofactor (black). Condition: 250 mM HEPES pH or pD 7.2, 667 μM CC, and scan rate of 2 mV/s at 23°C.
Figure 7
Figure 7
Structure of the E2(2H) state and the transition state E2(2H) for the release of H2 (upper panels; for clarity, only the FeMo-co core is shown). Relevant distances are reported in Å along with the free energy of E2(2H) and E2(2D) relative to E2(2H) and E2(2D), respectively. The lower panels report the free energy ΔΔG of E2(2D) and E2(2D) relative to E2(2H) and E2(2H) along with the enthalpic (ΔΔH), entropic (−TΔΔS) and nuclear zero point energy (ΔΔZPE) contributions to ΔΔG. All energies in kJ/mol.

References

    1. Smil V. Enriching the earth: Fritz Haber, Carl Bosch, and the transformation of world food production. MIT Press; Cambridge, Mass: 2001.
    1. Yang Z-Y, Khadka N, Lukoyanov D, Hoffman BM, Dean DR, Seefeldt LC. Proc Natl Acad Sci USA. 2013;110:16327. - PMC - PubMed
    1. Hoffman BM, Lukoyanov D, Yang Z-Y, Dean DR, Seefeldt LC. Chem Rev. 2014;114:4041. - PMC - PubMed
    1. Lukoyanov D, Yang Z-Y, Khadka N, Dean DR, Seefeldt LC, Hoffman BM. J Am Chem Soc. 2015;137:3610. - PMC - PubMed
    1. Lukoyanov D, Khadka N, Dean DR, Raugei S, Seefeldt LC, Hoffman BM. Inorg Chem. 2017;56:2233. - PMC - PubMed

Publication types

LinkOut - more resources