. 2017 Aug 29;18(1):664.
doi: 10.1186/s12864-017-4048-0.

Expression profiling of genes regulated by sphingosine kinase1 signaling in a murine model of hyperoxia induced neonatal bronchopulmonary dysplasia

Affiliations

Expression profiling of genes regulated by sphingosine kinase1 signaling in a murine model of hyperoxia induced neonatal bronchopulmonary dysplasia

Viswanathan Natarajan et al. BMC Genomics. .

Abstract

Background: Sphingosine- 1-Phosphate (S1P) is a bioactive lipid and an intracellular as well as an extracellular signaling molecule. S1P ligand specifically binds to five related cell surface G-protein-coupled receptors (S1P1-5). S1P levels are tightly regulated by its synthesis catalyzed by sphingosine kinases (SphKs) 1 & 2 and catabolism by S1P phosphatases, lipid phosphate phosphatases and S1P lyase. We previously reported that knock down of SphK1 (Sphk1 -/- ) in a neonatal mouse BPD model conferred significant protection against hyperoxia induced lung injury. To better understand the underlying molecular mechanisms, genome-wide gene expression profiling was performed on mouse lung tissue using Affymetrix MoGene 2.0 array.

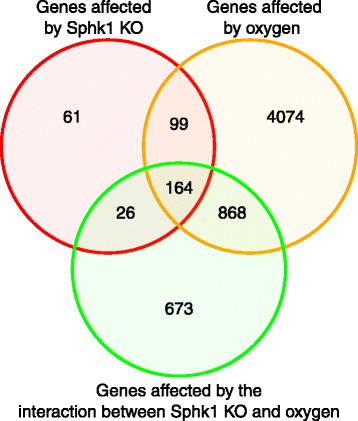
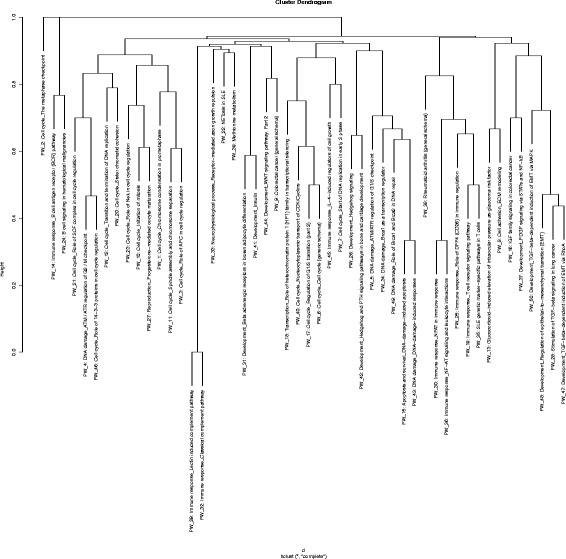
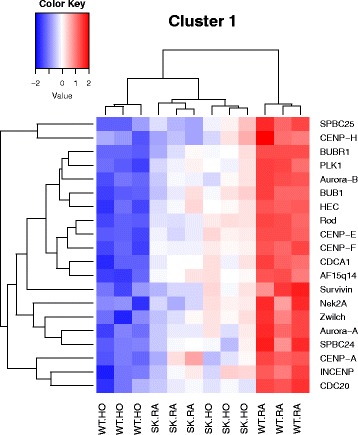
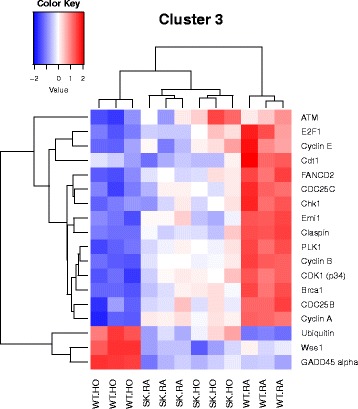
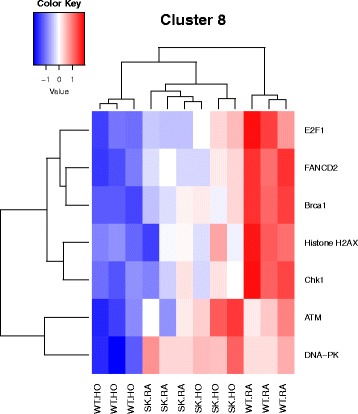
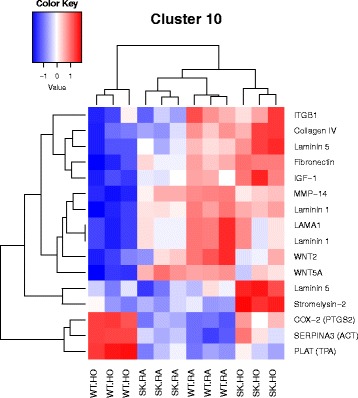
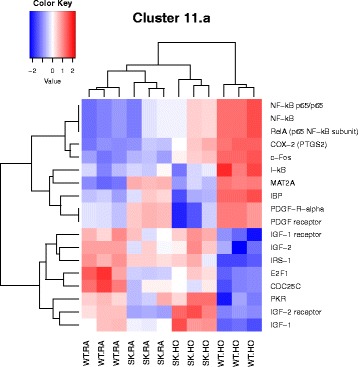
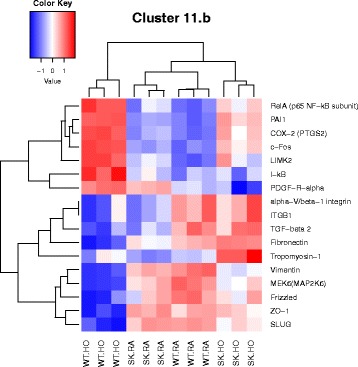
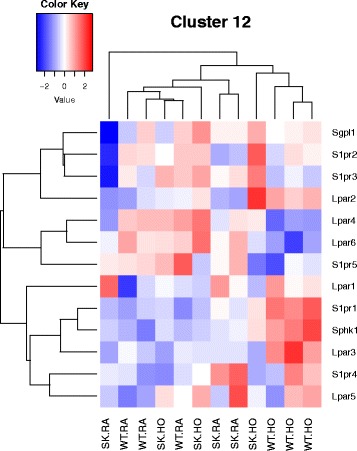
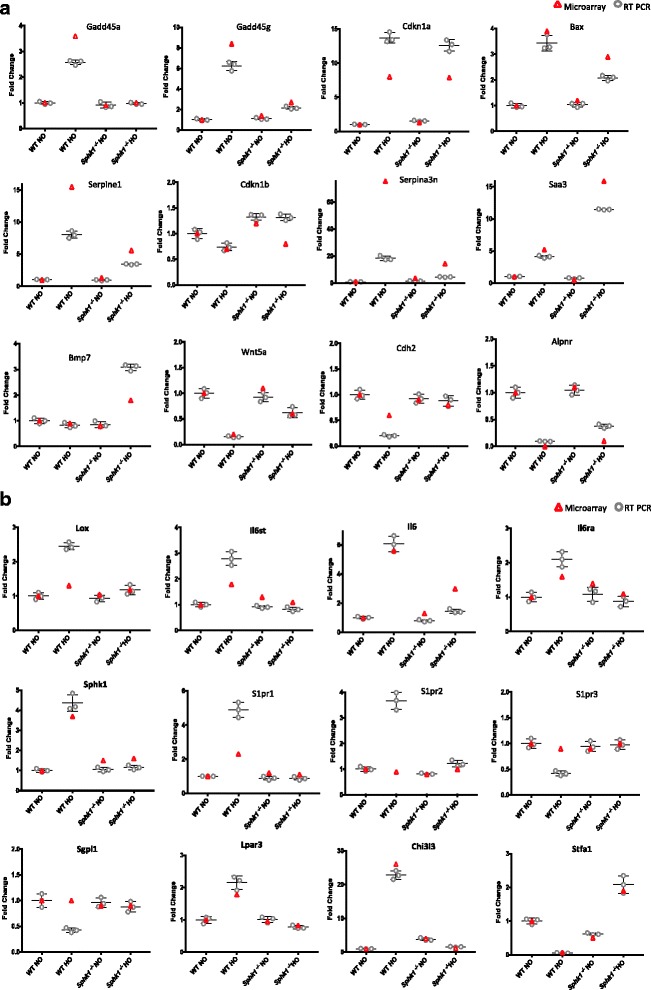
Results: Two-way ANOVA analysis was performed and differentially expressed genes under hyperoxia were identified using Sphk1 -/- mice and their wild type (WT) equivalents. Pathway (PW) enrichment analyses identified several signaling pathways that are likely to play a key role in hyperoxia induced lung injury in the neonates. These included signaling pathways that were anticipated such as those involved in lipid signaling, cell cycle regulation, DNA damage/apoptosis, inflammation/immune response, and cell adhesion/extracellular matrix (ECM) remodeling. We noted hyperoxia induced downregulation of the expression of genes related to mitotic spindle formation in the WT which was not observed in Sphk1 -/- neonates. Our data clearly suggests a role for SphK1 in neonatal hyperoxic lung injury through elevated inflammation and apoptosis in lung tissue. Further, validation by RT-PCR on 24 differentially expressed genes showed 83% concordance both in terms of fold change and vectorial changes. Our findings are in agreement with previously reported human BPD microarray data and completely support our published in vivo findings. In addition, the data also revealed a significant role for additional unanticipitated signaling pathways involving Wnt and GADD45.

Conclusion: Using SphK1 knockout mice and differential gene expression analysis, we have shown here that S1P/SphK1 signaling plays a key role in promoting hyperoxia induced DNA damage, inflammation, apoptosis and ECM remodeling in neonatal lungs. It also appears to suppress pro-survival cellular responses involved in normal lung development. We therefore propose SphK1 as a therapeutic target for the development drugs to combat BPD.

Keywords: Lipid signaling; Neonatal lung injury; Oxidative stress; Sphingosine 1 phosphate; Sphingosine kinase 1.


Conflict of interest statement

Ethics approval and consent to participate

Not applicable as this is not a study involving human beings. All experiments using animals were approved by the Institutional Animal Care and Use Committee at the University of Illinois at Chicago (protocol # 15-240). Sphk1 −/− mice were obtained from Dr. Richard L. Proia (NIDDK, National Institutes of Health, Bethesda), and backcrossed to C57BL/6 background for two generations (F2 hybrid).Dr. Proia of National Institutes of health has gifted us the mice with permission to breed as approved by the Institutional Animal Care protocol.

Consent for publication

Not applicable.

Competing interests

The authors declare that they have no competing interests.

Publisher’s Note

Springer Nature remains neutral with regard to jurisdictional claims in published maps and institutional affiliations.

Figures

Fig. 1
Fig. 1
Venn diagram showing the number of genes differentially regulated in the WT and Sphk1 −/− neonatal mice exposed to hyperoxia. Two-way ANOVA was performed to analyze the data. There are three variables in the two-way ANOVA performed here such as 1. knock out of Sphk1 gene, 2. hyperoxia, 3. interaction of Sphk1 −/− and hyperoxia. Red circle shows all the genes affected by knockout of Sphk1 gene (61 + 99 + 164 + 26 = 350). Sphk1 −/− shows 61 genes solely differentially regulated when the corresponding gene was knocked out. Orange circle shows all the genes (4074 + 868 + 99 + 164 = 5205) affected by hyperoxia. 4074 genes were differentially regulated by hyperoxia compared to the corresponding normoxic control unaffected by other factors. Green circle shows genes affected by the interaction between the two factors i.e., Sphk1 −/− and hyperoxia (673 + 26 + 164 + 868 = 1731). 673 genes were solely affected by the interaction between Sphk1 −/− and hyperoxia, independent of the direct impact of either
Fig. 2
Fig. 2
Nodal biological pathways identified as differentially regulated in the animal model of BPD. Differential gene expression analysis was further subjected to pathway enrichment analysis in order to delineate the underlying major biological signaling pathways that could be attributed to the protective effect seen in Sphk1 −/− mice against hyperoxia induced lung injury. The 7 M clusters of pathways were grouped by similar functions, thus highlighting significant differentially expressed genes most prevalent in our model, as shown here. The pathways combined to form clusters are described here. 1. Cell cycle metaphase check point (cluster 1), 2. DNA damage G2/M check point (cluster 3), 3. DNA-damage-induced apoptosis and survival (cluster 8), 4. Cell adhesion and extracellular matrix remodeling (cluster 10), 5. Pdgf signaling via NF-ĸB pathway (cluster 11a), 6. Wnt signaling and epithelial mesenchymal transition (cluster 11b), and 7. Sphingosine 1 phosphate (S1P) pathway (cluster 12). A detailed description of the pathways and how they were combined to form clusters is given in Additional file 2: Table S2
Fig. 3
Fig. 3
Heatmap showing differentially regulated genes in the nodal pathway related to cell cycle metaphase check point (cluster 1). Differentially expressed genes were analyzed using the “Pathway Maps” ontology and the top 50 most enriched pathways (PW) were identified. We clustered nodal PWs based on their gene content and reduced duplication. Complete linkage hierarchical clustering on the Jaccard distance between the complete set of genes in each PW was done and closely related individual entities were identified. Each cluster of closely related PWs was considered as one unit or mega pathway (dissimilarity cut off of 0.6). All associated differential genes were combined for creating heatmaps and analyzing gene interactions. Clustering of pathways has been detailed in Additional file 2: Table S2. The color key ranging from dark blue to dark red shows the degree of differential regulation from −2 of down regulation or more to +2 of upregulation or more. The color key ranging from dark blue to dark red shows the z-scored normalized expression level. This heatmap depicts the biological nodal pathway showing differential regulation of genes among the 4 different groups such as WT neonatal mice exposed to room air (WT RA), hyperoxia (WT HO), Sphk1 −/− mice exposed to room air (SK RA), or Sphk1 −/− mice exposed to hyperoxia (SK HO). Selected genes depicted in the heat map is described here. Among the genes prominently downregulated by hyperoxia in the WT include 1) centromere associated proteins, Cenp A, E, F and H, 2) Kinetochore proteins Bubr, Aurora A and B, Bub1 and Zwilch and 3) protein kinases such as Nek2a
Fig. 4
Fig. 4
Heatmap showing genes differentially regulated in the nodal pathway related to mostly DNA damage G2/M check point (cluster 3). The cluster combines data from 11 related pathways as shown in Additional file 2: Table S2. Selected genes depicted in the heatmap are described here. Among the genes prominently downregulated by hyperoxia in the WT are 1) Cyclins A, B and D, Cdk1, 2) ATM serine/threonine kinase, Chk1. ATM is activated by DNA double-strand breaks. In contrast, gene for Wee was upregulated in WT HO along with Gadd45 alpha
Fig. 5
Fig. 5
Heatmap showing genes differentially regulated in the nodal pathway related to DNA-damage-induced apoptosis and survival (cluster 8). The cluster combines data from 7 related pathways as shown in Additional file 2: Table S2. Selected genes depicted in the heatmap are described here. Genes related to DNA-damage-induced apoptosis and survival PW are downregulated in the WT HO group. These include Histone 2A component, H2AX contributing to the nucleosome-formation and DNA-PK i.e., DNA-dependent serine/threonine protein kinase
Fig. 6
Fig. 6
Heatmap showing genes differentially regulated in the nodal pathway related to cluster 10. The cluster combines gene expression analysis data from glucocorticoid-induced elevation of intraocular pressure as glaucoma risk factor and cell adhesion and extracellular matrix remodeling. Among the genes downregulated in WT HO in contrast to Sphk1 −/− HO are those coding for basal lamina such as Laminin 1, 5 and Collagen IV, matrix metalloproteinases such as MMP-14, MMP-3 (Stromelysin-1) and integrin beta sub unit (ITGB). Laminin-5 and Stromelysin-1 are upregulated significantly in Sphk1 −/− HO. Genes significantly upregulated in WT HO are those coding for Cox 2, Serpina 3 and Plat. Cyclooxygenase (COX) catalyzes formation of prostaglandins such as prostacyclin. Serpina 3 gene codes for alpha 1-antichymotrypsin which inhibits the activity of proteases, and thereby protects tissues from proteolytic damage. Sphk1 −/− HO also revealed upregulation of Cox 2 and Serpina3 gene expression in response to hyperoxia
Fig. 7
Fig. 7
Heatmap showing genes differentially regulated in the nodal pathway related to Pdgf signaling via NF-ĸB (cluster 11 a). NF-κB and related genes (NF-κB, NF-κB p65, Rel A, I-κB) are significantly upregulated in WT HO compared to the rest. Genes for insulin like growth factors (IGF) 1 and 2 and their receptors are downregulated in WT HO whereas they are upregulated in Sphk1 −/− HO. IGF is known to have anabolic effects. c-Fos is also noted to be upregulated in WT HO. C-Fos with c-Jun forms AP-1 (Activator Protein-1) complex. AP-1 complex is a transcription factor mediating a wide range of cellular processes such as cell growth, differentiation, and apoptosis
Fig. 8
Fig. 8
Heatmap showing genes differentially regulated in the nodal pathway related to Wnt signaling and epithelial mesenchymal transition (EMT) (cluster 11 b). The following genes related to EMT were downregulated in WT HO: alpha − V/beta − 1 integrin, fibronectin, vimentin, slug, Zo-1. Frizzled and Wnt signaling were also noted to be downregulated in WT HO. Gene for LIM Domain Kinase 2 (Limk 2) was upregulated in WT HO along with other genes described earlier. Limk2 is known to inactivate cofilin and induce formation of stress fibers and focal complexes
Fig. 9
Fig. 9
Heatmap representing differentially regulated genes in the WT and Sphk1 −/− neonatal mice exposed to hyperoxia in pathways related to lipid signaling. Sphk1, S1pr1 and Lpar3 are some of the genes whose expression is upregulated in WT HO neonatal mice lungs
Fig. 10
Fig. 10
a & b. Validation of microarray by RT-PCR. The figures represent microarray results in red open triangles and RT-PCR in gray open circles. The four different groups were: WT neonatal mice exposed to normoxia (WT RA), hyperoxia (WT HO), Sphk1 −/− mice exposed to normoxia (SK RA), or hyperoxia (SK HO). Each graph in the figure represents the corresponding gene studied. The gene names are shown at the top of each individual graph. The validation is evidenced by agreement in vectoral change between microarray and RT-PCR. The fold change may differ between the two methods

Similar articles

Cited by

References

    1. Farstad T, Bratlid D, Medbo S, Markestad T, Norwegian Extreme Prematurity Study G Bronchopulmonary dysplasia - prevalence, severity and predictive factors in a national cohort of extremely premature infants. Acta Paediatr. 2011;100(1):53–58. doi: 10.1111/j.1651-2227.2010.01959.x. - DOI - PubMed
    1. Landry JS, Menzies D. Occurrence and severity of bronchopulmonary dysplasia and respiratory distress syndrome after a preterm birth. Paediatr Child Health. 2011;16(7):399–403. - PMC - PubMed
    1. O'Reilly M, Sozo F, Harding R. Impact of preterm birth and bronchopulmonary dysplasia on the developing lung: long-term consequences for respiratory health. Clin Exp Pharmacol Physiol. 2013;40(11):765–773. doi: 10.1111/1440-1681.12068. - DOI - PubMed
    1. Trembath A, Laughon MM. Predictors of bronchopulmonary dysplasia. Clin Perinatol. 2012;39(3):585–601. doi: 10.1016/j.clp.2012.06.014. - DOI - PMC - PubMed
    1. Vogel ER, Britt RD, Jr, Trinidad MC, Faksh A, Martin RJ, MacFarlane PM, Pabelick CM, Prakash YS. Perinatal oxygen in the developing lung. Can J Physiol Pharmacol. 2015;93(2):119–127. doi: 10.1139/cjpp-2014-0387. - DOI - PMC - PubMed

MeSH terms

LinkOut - more resources