

Performance of risk prediction for inflammatory bowel disease based on genotyping platform and genomic risk score method
- PMID: 28851283
- PMCID: PMC5576242
- DOI: 10.1186/s12881-017-0451-2
Performance of risk prediction for inflammatory bowel disease based on genotyping platform and genomic risk score method
Abstract
Background: Predicting risk of disease from genotypes is being increasingly proposed for a variety of diagnostic and prognostic purposes. Genome-wide association studies (GWAS) have identified a large number of genome-wide significant susceptibility loci for Crohn's disease (CD) and ulcerative colitis (UC), two subtypes of inflammatory bowel disease (IBD). Recent studies have demonstrated that including only loci that are significantly associated with disease in the prediction model has low predictive power and that power can substantially be improved using a polygenic approach.
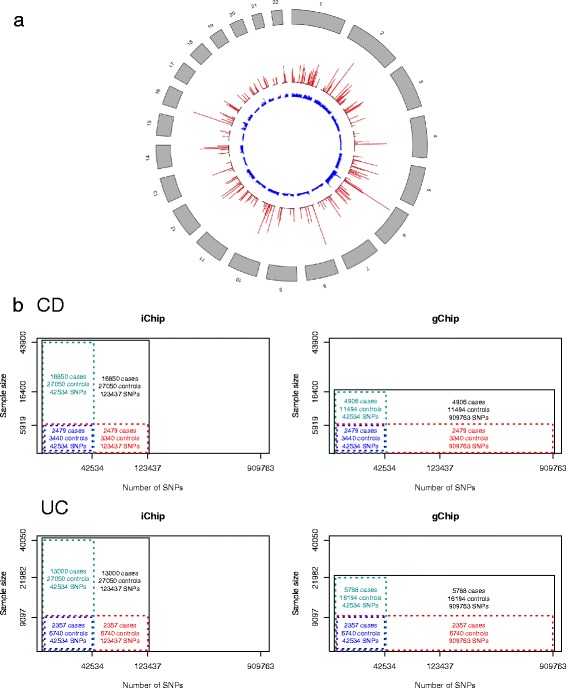
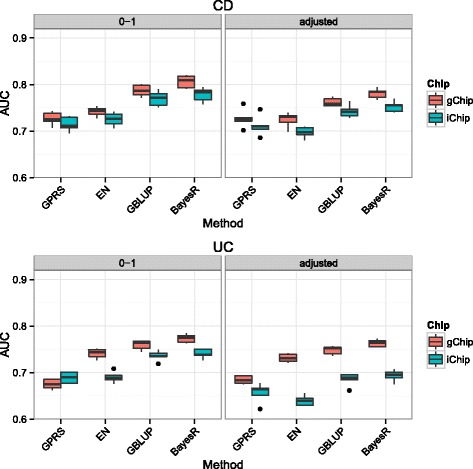
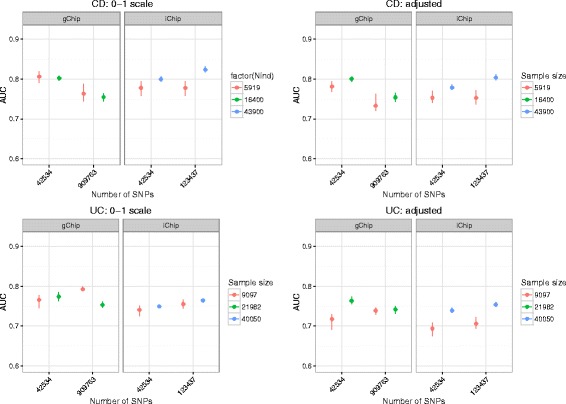
Methods: We performed a comprehensive analysis of risk prediction models using large case-control cohorts genotyped for 909,763 GWAS SNPs or 123,437 SNPs on the custom designed Immunochip using four prediction methods (polygenic score, best linear genomic prediction, elastic-net regularization and a Bayesian mixture model). We used the area under the curve (AUC) to assess prediction performance for discovery populations with different sample sizes and number of SNPs within cross-validation.
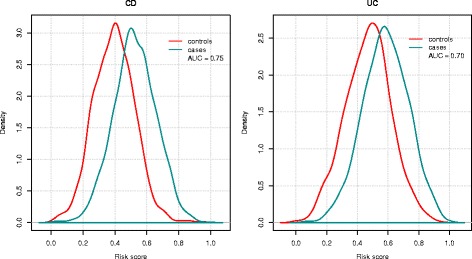
Results: On average, the Bayesian mixture approach had the best prediction performance. Using cross-validation we found little differences in prediction performance between GWAS and Immunochip, despite the GWAS array providing a 10 times larger effective genome-wide coverage. The prediction performance using Immunochip is largely due to the power of the initial GWAS for its marker selection and its low cost that enabled larger sample sizes. The predictive ability of the genomic risk score based on Immunochip was replicated in external data, with AUC of 0.75 for CD and 0.70 for UC. CD patients with higher risk scores demonstrated clinical characteristics typically associated with a more severe disease course including ileal location and earlier age at diagnosis.
Conclusions: Our analyses demonstrate that the power of genomic risk prediction for IBD is mainly due to strongly associated SNPs with considerable effect sizes. Additional SNPs that are only tagged by high-density GWAS arrays and low or rare-variants over-represented in the high-density region on the Immunochip contribute little to prediction accuracy. Although a quantitative assessment of IBD risk for an individual is not currently possible, we show sufficient power of genomic risk scores to stratify IBD risk among individuals at diagnosis.
Keywords: Case-control study; Complex trait; Crohn’s disease; Inflammatory bowel disease; Risk score; SNP array; Ulcerative colitis.
Conflict of interest statement
Ethics approval and consent to participate
The study was approved by the Human Research Ethics Committees of all participating hospitals (Additional file 11). The lead hospital for this study was the Royal Brisbane and Women’s Hospital (Ref: 2003/155). Informed consent was obtained from all subjects in this study.
Consent for publication
Not applicable.
Competing interests
The authors declare that they have no competing interests.
Publisher’s Note
Springer Nature remains neutral with regard to jurisdictional claims in published maps and institutional affiliations.
Figures

References
-
- Molodecky NA, Soon IS, Rabi DM, Ghali WA, Ferris M, Chernoff G, Benchimol EI, Panaccione R, Ghosh S, Barkema HW, et al. Increasing incidence and prevalence of the inflammatory bowel diseases with time, based on systematic review. Gastroenterology. 2012;142(1):46–54. doi: 10.1053/j.gastro.2011.10.001. - DOI - PubMed
-
- Liu JZ, van Sommeren S, Huang H, Ng SC, Alberts R, Takahashi A, Ripke S, Lee JC, Jostins L, Shah T, et al. Association analyses identify 38 susceptibility loci for inflammatory bowel disease and highlight shared genetic risk across populations. Nat Genet. 2015;47(9):979–986. doi: 10.1038/ng.3359. - DOI - PMC - PubMed
Publication types
MeSH terms
Grants and funding
LinkOut - more resources
Full Text Sources
Other Literature Sources
Medical
