Meta-Analysis
. 2017 Aug 29;17(1):683.
doi: 10.1186/s12889-017-4691-z.

Childhood obesity and adult cardiovascular disease risk factors: a systematic review with meta-analysis

Affiliations
Meta-Analysis

Childhood obesity and adult cardiovascular disease risk factors: a systematic review with meta-analysis

Amna Umer et al. BMC Public Health. .

Abstract

Background: Overweight and obesity is a major public health concern that includes associations with the development of cardiovascular disease (CVD) risk factors during childhood and adolescence as well as premature mortality in adults. Despite the high prevalence of childhood and adolescent obesity as well as adult CVD, individual studies as well as previous systematic reviews examining the relationship between childhood obesity and adult CVD have yielded conflicting results. The purpose of this study was to use the aggregate data meta-analytic approach to address this gap.

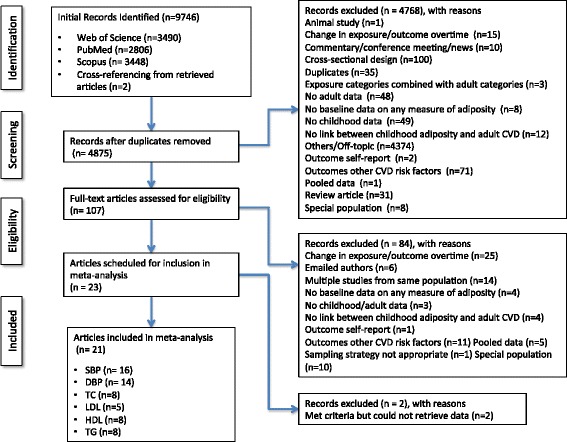
Methods: Studies were included if they met the following criteria: (1) longitudinal and cohort studies (including case-cohort), (2) childhood exposure and adult outcomes collected on the same individual over time, (3) childhood obesity, as defined by the original study authors, (4) English-language articles, (5) studies published up to June, 2015, (6) one or more of the following CVD risk factors [systolic blood pressure (SBP), diastolic blood pressure (DBP), total cholesterol (TC), high-density lipoprotein cholesterol (HDL), low-density lipoprotein cholesterol (LDL), non-high-density lipoprotein cholesterol (non-HDL), and triglycerides (TG)], (7) outcome(s) not self-reported, and (8) exposure measurements (child's adiposity) assessed by health professionals, trained investigators, or self-reported. Studies were retrieved by searching three electronic databases as well as citation tracking. Fisher's r to z score was calculated for each study for each outcome. Pooled effect sizes were calculated using random-effects models while risk of bias was assessed using the STROBE instrument. In order to try and identify sources of heterogeneity, random-effects meta-regression was also performed.

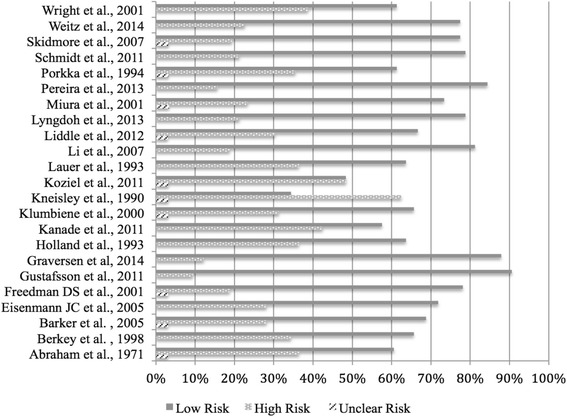
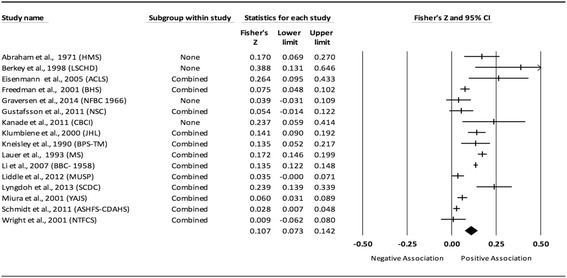
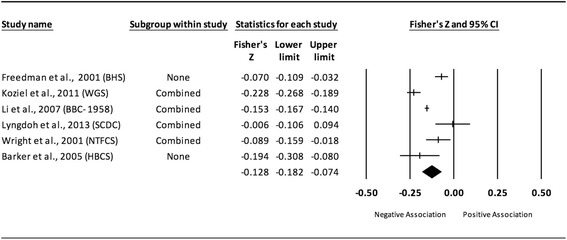
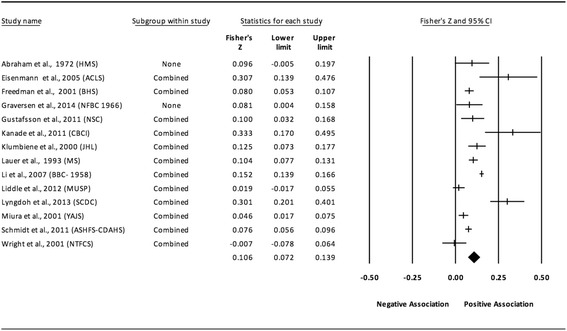
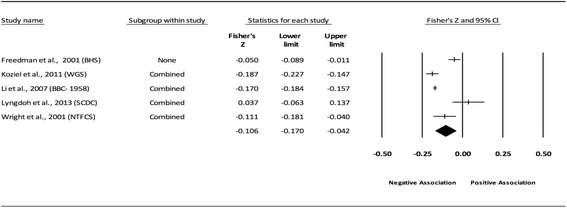
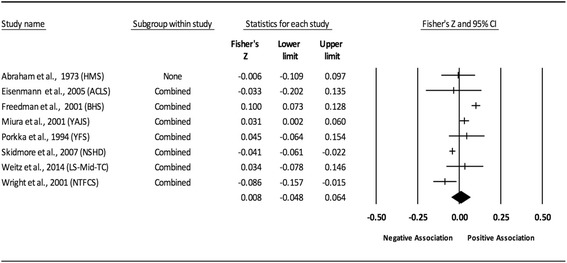
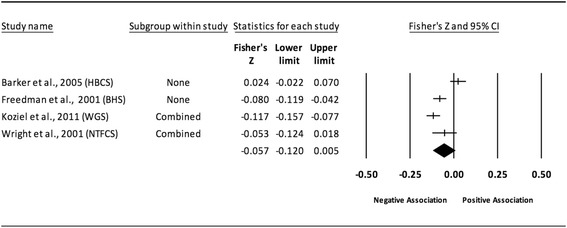
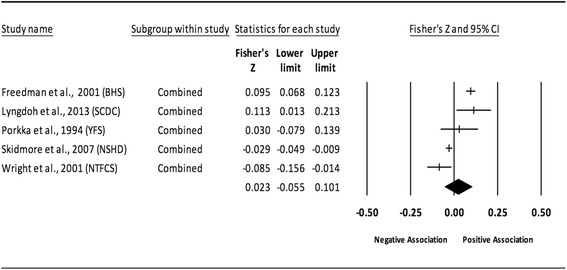
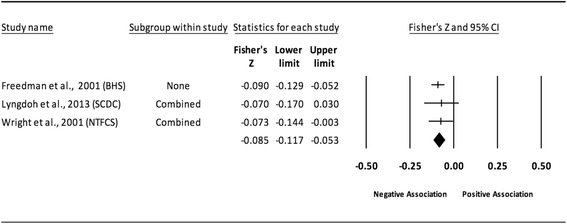
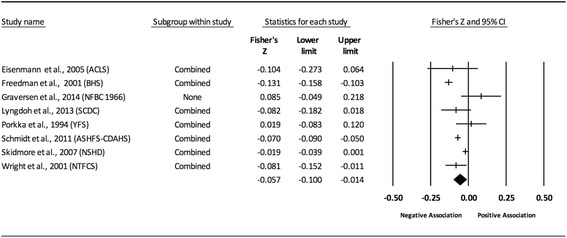
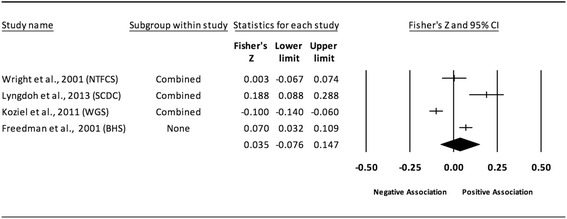
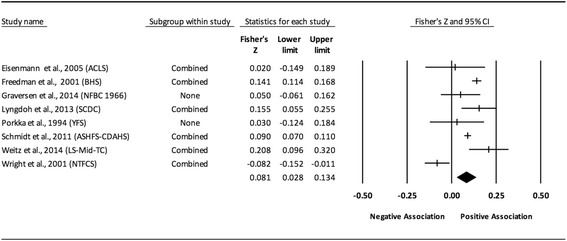
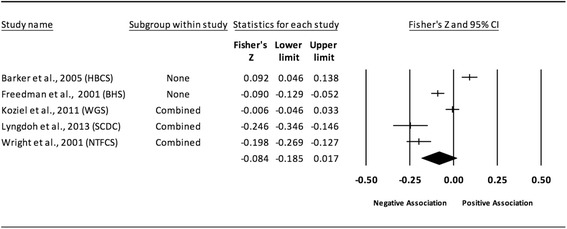
Results: Of the 4840 citations reviewed, a total of 23 studies were included in the systematic review and 21 in the meta-analysis. The findings suggested that childhood obesity is significantly and positively associated with adult SBP (Zr = 0.11; 95% CI: 0.07, 0.14), DBP (Zr = 0.11; 95% CI: 0.07, 0.14), and TG (Zr =0.08; 95% CI: 0.03, 0.13), and significantly and inversely associated with adult HDL (Zr = -0.06; 95% CI: -0.10, -0.02). For those studies that adjusted for adult body mass index (BMI), associations were reversed, suggesting that adult BMI may be a potential mediator. Nine studies had more than 33% of items that placed them at an increased risk for bias.

Conclusions: The results of this study suggest that childhood obesity may be a risk factor for selected adult CVD risk factors. However, a need exists for additional, higher-quality studies that include, but are not limited to, both unadjusted and adjusted measures such as BMI before any definitive conclusions can be reached.

Systematic review and meta-analysis: PROSPERO 2015: CRD42015019763 .

Keywords: Adults; Cardiovascular disease; Children; Meta-analysis; Obesity; Systematic review.


Conflict of interest statement

Ethics approval and consent to participate

Not Applicable.

Consent for publication

Not Applicable.

Competing interests

The authors declare that they have no competing interests.

Publisher’s Note

Springer Nature remains neutral with regard to jurisdictional claims in published maps and institutional affiliations.

Figures

Fig. 1
Fig. 1
Flow diagram for the selection of studies. Legend: Note: non-HDL was not analyzed because there were less than 3 studies to pool
Fig. 2
Fig. 2
Risk of bias assessment using STROBE instrument for each study. Legend: STROBE-Strengthening the Reporting of Observational Studies in Epidemiology (STROBE) instrument is a checklist of 22 items related to the title, abstract, introduction, methods, results and discussion sections of the articles. Each study was assessed for the 22 items. The total number of “yes” (low risk), “no” (high risk), or “unclear” items were added and divided by the total number of items for each study and multiplied by 100 in order to report the results in percentages. Scores were adjusted for NA responses. The STROBE checklist is available at: http://strobe-statement.org/index.php?id=available-checklists
Fig. 3
Fig. 3
Forest plot for the association between childhood obesity and adult SBP. Legend: The common metric for the effect size for each study is the Fisher’s r to z transformation of the correlation statistics. The vertical lines in the middle of each straight line represent the mean of Fisher’s Z while the left and right extremes of the vertical lines represent the corresponding 95% CI. The middle of the black diamond represents the overall mean for Fishers Z while the left and right extremes of the diamond represent the corresponding 95% CI. Combined measures represent those studies in which males and females were combined, different age cohorts from each study were combined, multiple readings from the same cohort were combined, or one study using more than one exposure definition was combined
Fig. 4
Fig. 4
Forest plot for the association between childhood obesity and adult SBP (adjusted for adult BMI). Legend: The common metric for the effect size for each study is the Fisher’s r to z transformation of the correlation statistics. The common metric for the effect size for each study is the Fisher’s r to z transformation of the correlation statistics. The vertical lines in the middle of each straight line represent the mean of Fisher’s Z while the left and right extremes of the vertical lines represent the corresponding 95% CI. The middle of the black diamond represents the overall mean for Fishers Z while the left and right extremes of the diamond represent the corresponding 95% CI. Combined measures represent those studies in which males and females were combined, different age cohorts from each study were combined, multiple readings from the same cohort were combined, or one study using more than one exposure definition
Fig. 5
Fig. 5
Forest plot for the association between childhood obesity and adult DBP. Legend: The common metric for the effect size for each study is the Fisher’s r to z transformation of the correlation statistics. The vertical lines in the middle of each straight line represent the mean of Fisher’s Z while the left and right extremes of the vertical lines represent the corresponding 95% CI. The middle of the black diamond represents the overall mean for Fishers Z while the left and right extremes of the diamond represent the corresponding 95% CI. Combined measures represent those studies in which males and females were combined, different age cohorts from each study were combined, multiple readings from the same cohort were combined, or one study using more than one exposure definition
Fig. 6
Fig. 6
Forest plot for the association between childhood obesity and adult DBP (adjusted for adult BMI). Legend: The common metric for the effect size for each study is the Fisher’s r to z transformation of the correlation statistics. The vertical lines in the middle of each straight line represent the mean of Fisher’s Z while the left and right extremes of the vertical lines represent the corresponding 95% CI. The middle of the black diamond represents the overall mean for Fishers Z while the left and right extremes of the diamond represent the corresponding 95% CI. Combined measures represent those studies in which males and females were combined, different age cohorts from each study were combined, multiple readings from the same cohort were combined, or one study using more than one exposure definition
Fig. 7
Fig. 7
Forest plot for the association between childhood obesity and adult TC. Legend: The common metric for the effect size for each study is the Fisher’s r to z transformation of the correlation statistics. The vertical lines in the middle of each straight line represent the mean of Fisher’s Z while the left and right extremes of the vertical lines represent the corresponding 95% CI. The middle of the black diamond represents the overall mean for Fishers Z while the left and right extremes of the diamond represent the corresponding 95% CI. Combined measures represent those studies in which males and females were combined, different age cohorts from each study were combined, multiple readings from the same cohort were combined, or one study using more than one exposure definition
Fig. 8
Fig. 8
Forest plot for the association between childhood obesity and adult TC (adjusted for adult BMI). Legend: The common metric for the effect size for each study is the Fisher’s r to z transformation of the correlation statistics. The vertical lines in the middle of each straight line represent the mean of Fisher’s Z while the left and right extremes of the vertical lines represent the corresponding 95% CI. The middle of the black diamond represents the overall mean for Fishers Z while the left and right extremes of the diamond represent the corresponding 95% CI. Combined measures represent those studies in which males and females were combined, different age cohorts from each study were combined, multiple readings from the same cohort were combined, or one study using more than one exposure definition
Fig. 9
Fig. 9
Forest plot for the association between childhood obesity and adult LDL. Legend: The common metric for the effect size for each study is the Fisher’s r to z transformation of the correlation statistics. The vertical lines in the middle of each straight line represent the mean of Fisher’s Z while the left and right extremes of the vertical lines represent the corresponding 95% CI. The middle of the black diamond represents the overall mean for Fishers Z while the left and right extremes of the diamond represent the corresponding 95% CI. Combined measures represent those studies in which males and females were combined, different age cohorts from each study were combined, multiple readings from the same cohort were combined, or one study using more than one exposure definition
Fig. 10
Fig. 10
Forest plot for the association between childhood obesity and adult LDL (adjusted for adult BMI). Legend: The common metric for the effect size for each study is the Fisher’s r to z transformation of the correlation statistics. The vertical lines in the middle of each straight line represent the mean of Fisher’s Z while the left and right extremes of the vertical lines represent the corresponding 95% CI. The middle of the black diamond represents the overall mean for Fishers Z while the left and right extremes of the diamond represent the corresponding 95% CI. Combined measures represent those studies in which males and females were combined, different age cohorts from each study were combined, multiple readings from the same cohort were combined, or one study using more than one exposure definition
Fig. 11
Fig. 11
Forest plot for the association between childhood obesity and adult HDL. Legend: The common metric for the effect size for each study is the Fisher’s r to z transformation of the correlation statistics. The vertical lines in the middle of each straight line represent the mean of Fisher’s Z while the left and right extremes of the vertical lines represent the corresponding 95% CI. The middle of the black diamond represents the overall mean for Fishers Z while the left and right extremes of the diamond represent the corresponding 95% CI. Combined measures represent those studies in which males and females were combined, different age cohorts from each study were combined, multiple readings from the same cohort were combined, or one study using more than one exposure definition
Fig. 12
Fig. 12
Forest plot for the association between childhood obesity and adult HDL (adjusted for adult BMI). Legend: The common metric for the effect size for each study is the Fisher’s r to z transformation of the correlation statistics. The vertical lines in the middle of each straight line represent the mean of Fisher’s Z while the left and right extremes of the vertical lines represent the corresponding 95% CI. The middle of the black diamond represents the overall mean for Fishers Z while the left and right extremes of the diamond represent the corresponding 95% CI. Combined measures represent those studies in which males and females were combined, different age cohorts from each study were combined, multiple readings from the same cohort were combined, or one study using more than one exposure definition
Fig. 13
Fig. 13
Forest plot for the association between childhood obesity and adult TG. Legend: The common metric for the effect size for each study is the Fisher’s r to z transformation of the correlation statistics. The vertical lines in the middle of each straight line represent the mean of Fisher’s Z while the left and right extremes of the vertical lines represent the corresponding 95% CI. The middle of the black diamond represents the overall mean for Fishers Z while the left and right extremes of the diamond represent the corresponding 95% CI. Combined measures represent those studies in which males and females were combined, different age cohorts from each study were combined, multiple readings from the same cohort were combined, or one study using more than one exposure definition
Fig. 14
Fig. 14
Forest plot for the association between childhood obesity and adult TG (adjusted for adult BMI). Legend: The common metric for the effect size for each study is the Fisher’s r to z transformation of the correlation statistics. The vertical lines in the middle of each straight line represent the mean of Fisher’s Z while the left and right extremes of the vertical lines represent the corresponding 95% CI. The middle of the black diamond represents the overall mean for Fishers Z while the left and right extremes of the diamond represent the corresponding 95% CI. Combined measures represent those studies in which males and females were combined, different age cohorts from each study were combined, multiple readings from the same cohort were combined, or one study using more than one exposure definition

Similar articles

Cited by

References

    1. Freedman DS, Mei Z, Srinivasan SR, Berenson GS, Dietz WH. Cardiovascular risk factors and excess adiposity among overweight children and adolescents: the Bogalusa heart study. J Pediatr. 2007;150(1):12–17. doi: 10.1016/j.jpeds.2006.08.042. - DOI - PubMed
    1. Teixeira PJ, Sardinha LB, Going SB, Lohman TG. Total and regional fat and serum cardiovascular disease risk factors in lean and obese children and adolescents. Obes Res. 2001;9(8):432–442. doi: 10.1038/oby.2001.57. - DOI - PubMed
    1. Celermajer DS, Ayer JG. Childhood risk factors for adult cardiovascular disease and primary prevention in childhood. Heart. 2006;92(11):1701–1706. doi: 10.1136/hrt.2005.081760. - DOI - PMC - PubMed
    1. Freedman DS, Khan LK, Dietz WH, Srinivasan SR, Berenson GS. Relationship of childhood obesity to coronary heart disease risk factors in adulthood: the Bogalusa heart study. Pediatrics. 2001;108(3):712–718. doi: 10.1542/peds.108.3.712. - DOI - PubMed
    1. WHO: World health statistics 2009. Geneva: World Health Organization 2009.