

Computer-assisted stereology and automated image analysis for quantification of tumor infiltrating lymphocytes in colon cancer
- PMID: 28851404
- PMCID: PMC5575870
- DOI: 10.1186/s13000-017-0653-0
Computer-assisted stereology and automated image analysis for quantification of tumor infiltrating lymphocytes in colon cancer
Abstract
Background: Precise prognostic and predictive variables allowing improved post-operative treatment stratification are missing in patients treated for stage II colon cancer (CC). Investigation of tumor infiltrating lymphocytes (TILs) may be rewarding, but the lack of a standardized analytic technique is a major concern. Manual stereological counting is considered the gold standard, but digital pathology with image analysis is preferred due to time efficiency. The purpose of this study was to compare manual stereological estimates of TILs with automatic counts obtained by image analysis, and at the same time investigate the heterogeneity of TILs.
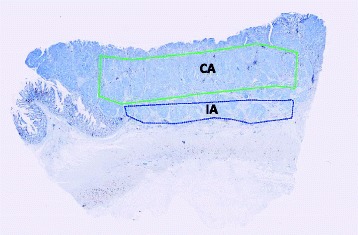
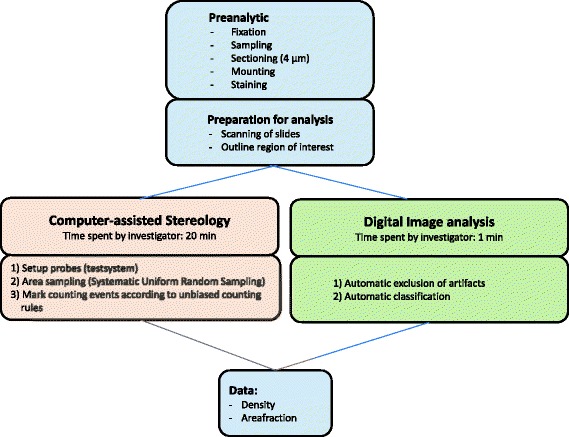
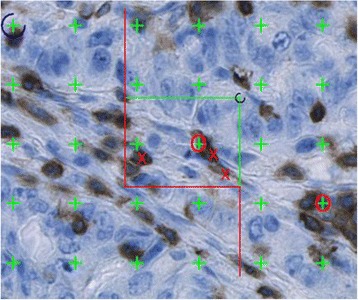
Methods: From 43 patients treated for stage II CC in 2002 three paraffin embedded, tumor containing tissue blocks were selected one of them representing the deepest invasive tumor front. Serial sections from each of the 129 blocks were immunohistochemically stained for CD3 and CD8, and the slides were scanned. Stereological estimates of the numerical density and area fraction of TILs were obtained using the computer-assisted newCAST stereology system. For the image analysis approach an app-based algorithm was developed using Visiopharm Integrator System software. For both methods the tumor areas of interest (invasive front and central area) were manually delineated by the observer.
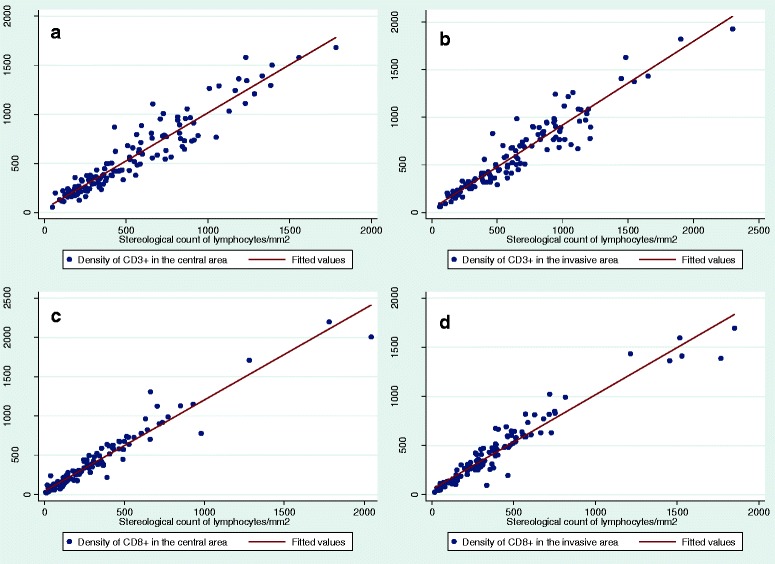
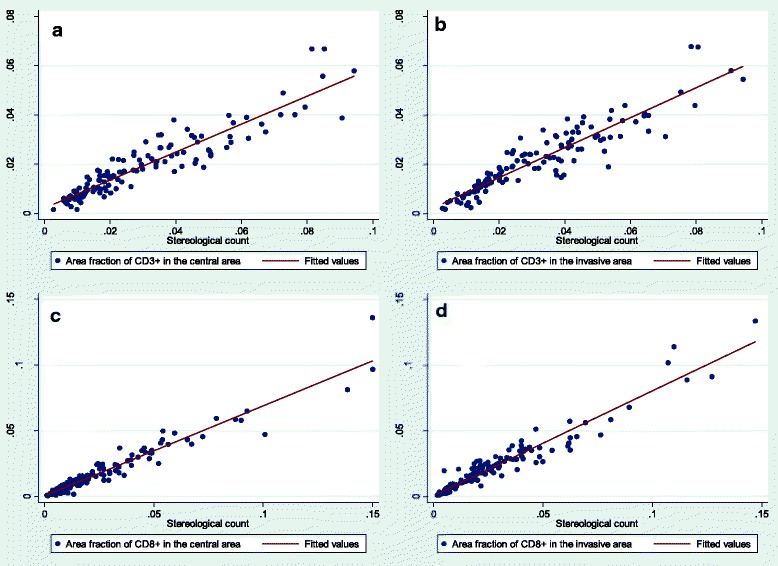
Results: Based on all sections, the Spearman's correlation coefficients for density estimates varied from 0.9457 to 0.9638 (p < 0.0001), whereas the coefficients for area fraction estimates ranged from 0.9400 to 0.9603 (P < 0.0001). Regarding heterogeneity, intra-class correlation coefficients (ICC) for CD3+ TILs varied from 0.615 to 0.746 in the central area, and from 0.686 to 0.746 in the invasive area. ICC for CD8+ TILs varied from 0.724 to 0.775 in the central area, and from 0.746 to 0.765 in the invasive area.
Conclusions: Exact objective and time efficient estimates of numerical densities and area fractions of CD3+ and CD8+ TILs in stage II colon cancer can be obtained by image analysis and are highly correlated to the corresponding estimates obtained by the gold standard based on stereology. Since the intra-tumoral heterogeneity was low, this method may be recommended for quantifying TILs in only one histological section representing the deepest invasive tumor front.
Keywords: Colon cancer; Heterogeneity; Image analysis; Stereology; Tumor infiltrating lymphocytes.
Conflict of interest statement
Ethics approval and consent to participate
The study was approved by The Regional Committees on Health Research Ethics for Southern Denmark (S-20140119) and the Danish Data Protection Agency. All patients were screened in the Danish Registry of Tissue Utilization before enrolment in the study.
Consent for publication
Not applicable.
Competing interests
Martin Kristensson and Johnnie Bremholm Andersen are employed by a commercial company (Visiopharm A/S, Denmark). This does not alter the authors’ adherence to Diagnostic Pathology’s policies on sharing data and materials.
Publisher’s Note
Springer Nature remains neutral with regard to jurisdictional claims in published maps and institutional affiliations.
Figures


Similar articles
-
A template to quantify the location and density of CD3 + and CD8 + tumor-infiltrating lymphocytes in colon cancer by digital pathology on whole slides for an objective, standardized immune score assessment.Cancer Immunol Immunother. 2021 Jul;70(7):2049-2057. doi: 10.1007/s00262-020-02834-y. Epub 2021 Jan 13. Cancer Immunol Immunother. 2021. PMID: 33439293 Free PMC article.
-
Does heterogeneity matter in the estimation of tumour budding and tumour stroma ratio in colon cancer?Diagn Pathol. 2018 Mar 20;13(1):20. doi: 10.1186/s13000-018-0697-9. Diagn Pathol. 2018. PMID: 29558947 Free PMC article.
-
Heterogeneity of tumour-infiltrating lymphocytes in breast cancer and its prognostic significance.Histopathology. 2018 Dec;73(6):887-896. doi: 10.1111/his.13695. Epub 2018 Oct 9. Histopathology. 2018. PMID: 29947077
-
The prognostic value of tumor-infiltrating lymphocytes in triple-negative breast cancer: a meta-analysis.Breast Cancer Res Treat. 2014 Dec;148(3):467-76. doi: 10.1007/s10549-014-3185-2. Epub 2014 Nov 1. Breast Cancer Res Treat. 2014. PMID: 25361613 Review.
-
Rational bases for the use of the Immunoscore in routine clinical settings as a prognostic and predictive biomarker in cancer patients.Int Immunol. 2016 Aug;28(8):373-82. doi: 10.1093/intimm/dxw021. Epub 2016 Apr 27. Int Immunol. 2016. PMID: 27121213 Free PMC article. Review.
Cited by
-
Evaluation of prognostic significance of histopathological characteristics and tumor-infiltrating lymphocytes for pancreatic cancer survival.Sci Rep. 2024 Nov 9;14(1):27392. doi: 10.1038/s41598-024-79342-x. Sci Rep. 2024. PMID: 39521901 Free PMC article.
-
High-performance Data Management for Whole Slide Image Analysis in Digital Pathology.Proc SPIE Int Soc Opt Eng. 2024 Feb;12933:129330Y. doi: 10.1117/12.3006273. Epub 2024 Apr 3. Proc SPIE Int Soc Opt Eng. 2024. PMID: 40343079 Free PMC article.
-
Reduced Tumor Volume and Increased Necrosis of Human Breast Tumor Xenograft in Mice Pretreated by a Cocktail of Three Specific Anti-HER2 scFvs.Curr Protein Pept Sci. 2024;25(5):409-418. doi: 10.2174/0113892037269645231031095145. Curr Protein Pept Sci. 2024. PMID: 38018211
-
Spatial Architecture and Arrangement of Tumor-Infiltrating Lymphocytes for Predicting Likelihood of Recurrence in Early-Stage Non-Small Cell Lung Cancer.Clin Cancer Res. 2019 Mar 1;25(5):1526-1534. doi: 10.1158/1078-0432.CCR-18-2013. Epub 2018 Sep 10. Clin Cancer Res. 2019. PMID: 30201760 Free PMC article.
-
An Accelerated Pipeline for Multi-label Renal Pathology Image Segmentation at the Whole Slide Image Level.Proc SPIE Int Soc Opt Eng. 2023 Feb;12471:124710Q. doi: 10.1117/12.2653651. Epub 2023 Apr 6. Proc SPIE Int Soc Opt Eng. 2023. PMID: 38606193 Free PMC article.
References
Publication types
MeSH terms
Substances
LinkOut - more resources
Full Text Sources
Other Literature Sources
Research Materials
