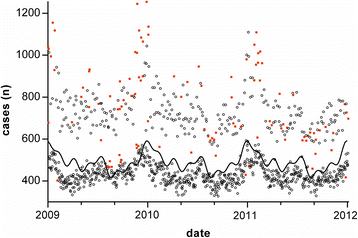
Daily volume of cases in emergency call centers: construction and validation of a predictive model
- PMID: 28851446
- PMCID: PMC5576313
- DOI: 10.1186/s13049-017-0430-9
Daily volume of cases in emergency call centers: construction and validation of a predictive model
Abstract
Background: Variations in the activity of emergency dispatch centers are an obstacle to the rationalization of resource allocation. Many explanatory factors are well known, available in advance and could predict the volume of emergency cases. Our objective was to develop and evaluate the performance of a predictive model of daily call center activity.
Methods: A retrospective survey was conducted on all cases from 2005 to 2011 in a large medical emergency call center (1,296,153 cases). A generalized additive model of daily cases was calibrated on data from 2005 to 2008 (1461 days, development sample) and applied to the prediction of days from 2009 to 2011 (1095 days, validation sample). Seventeen calendar and epidemiological variables and a periodic function for seasonality were included in the model.
Results: The average number of cases per day was 507 (95% confidence interval: 500 to 514) (range, 286 to 1251). Factors significantly associated with increased case volume were the annual increase, weekend days, public holidays, regional incidence of influenza in the previous week and regional incidence of gastroenteritis in the previous week. The adjusted R for the model was 0.89 in the calibration sample. The model predicted the actual number of cases within ± 100 for 90.5% of the days, with an average error of -13 cases (95% CI: -17 to 8).
Conclusions: A large proportion of the variability of the medical emergency call center's case volume can be predicted using readily available covariates.
Keywords: Emergency medical services; Health service needs and demand/trends; Models; Safety management/methods; Theoretical.
Conflict of interest statement
Ethics approval and consent to participate
Not applicable.
Consent for publication
Not applicable.
Competing interests
The authors declare that they have no competing interests.
Publisher’s Note
Springer Nature remains neutral with regard to jurisdictional claims in published maps and institutional affiliations.
Figures


Similar articles
-
Variation in accessibility of the population to an Emergency Medical Communication Centre: a multicentre observational study.Scand J Trauma Resusc Emerg Med. 2019 Oct 28;27(1):94. doi: 10.1186/s13049-019-0667-6. Scand J Trauma Resusc Emerg Med. 2019. PMID: 31661006 Free PMC article.
-
The impact of heat waves on transport volumes in an urban emergency medical services system: a retrospective review.Prehosp Disaster Med. 2013 Dec;28(6):610-5. doi: 10.1017/S1049023X13008960. Epub 2013 Oct 22. Prehosp Disaster Med. 2013. PMID: 24148831
-
Patient and case characteristics associated with 'no paramedic treatment' for low-acuity cases referred for emergency ambulance dispatch following a secondary telephone triage: a retrospective cohort study.Scand J Trauma Resusc Emerg Med. 2018 Jan 10;26(1):8. doi: 10.1186/s13049-018-0475-4. Scand J Trauma Resusc Emerg Med. 2018. PMID: 29321074 Free PMC article.
-
The influence of cold weather on the usage of emergency link calls: a case study in Hong Kong.BMC Med Inform Decis Mak. 2015 Aug 13;15:66. doi: 10.1186/s12911-015-0191-1. BMC Med Inform Decis Mak. 2015. PMID: 26590158 Free PMC article.
-
Emergency department factors associated with survival after sudden cardiac arrest.Resuscitation. 2013 Mar;84(3):292-7. doi: 10.1016/j.resuscitation.2012.10.013. Epub 2012 Oct 24. Resuscitation. 2013. PMID: 23103887 Review.
Cited by
-
Patterns of emergency dispatch calls and their changes during the COVID-19 pandemic in Ulaanbaatar, Mongolia.BMC Emerg Med. 2025 Jul 7;25(1):119. doi: 10.1186/s12873-025-01273-1. BMC Emerg Med. 2025. PMID: 40624622 Free PMC article.
-
Utility of emergency call centre, dispatch and ambulance data for syndromic surveillance of infectious diseases: a scoping review.Eur J Public Health. 2020 Aug 1;30(4):639-647. doi: 10.1093/eurpub/ckz177. Eur J Public Health. 2020. PMID: 31605491 Free PMC article.
-
Variation in accessibility of the population to an Emergency Medical Communication Centre: a multicentre observational study.Scand J Trauma Resusc Emerg Med. 2019 Oct 28;27(1):94. doi: 10.1186/s13049-019-0667-6. Scand J Trauma Resusc Emerg Med. 2019. PMID: 31661006 Free PMC article.
-
Urban-sub-urban-rural variation in the supply and demand of emergency medical services.Front Public Health. 2023 Jan 25;10:1064385. doi: 10.3389/fpubh.2022.1064385. eCollection 2022. Front Public Health. 2023. PMID: 36761335 Free PMC article.
-
Understanding EMS response times: a machine learning-based analysis.BMC Med Inform Decis Mak. 2025 Mar 24;25(1):143. doi: 10.1186/s12911-025-02975-z. BMC Med Inform Decis Mak. 2025. PMID: 40128718 Free PMC article.
References
-
- Gebbie KM, Silber S, McCollum M, Lazar EJ. Activating physicians within a hospital emergency plan: a concept whose time has come? Am J Disaster Med. 2007;2:74–80. - PubMed
Publication types
MeSH terms
LinkOut - more resources
Full Text Sources
Other Literature Sources
Medical
Miscellaneous

