. 2017 Oct 1;144(19):3625-3632.
doi: 10.1242/dev.151142. Epub 2017 Aug 29.

Psychrophilic proteases dramatically reduce single-cell RNA-seq artifacts: a molecular atlas of kidney development

Affiliations

Psychrophilic proteases dramatically reduce single-cell RNA-seq artifacts: a molecular atlas of kidney development

Mike Adam et al. Development. .

Abstract

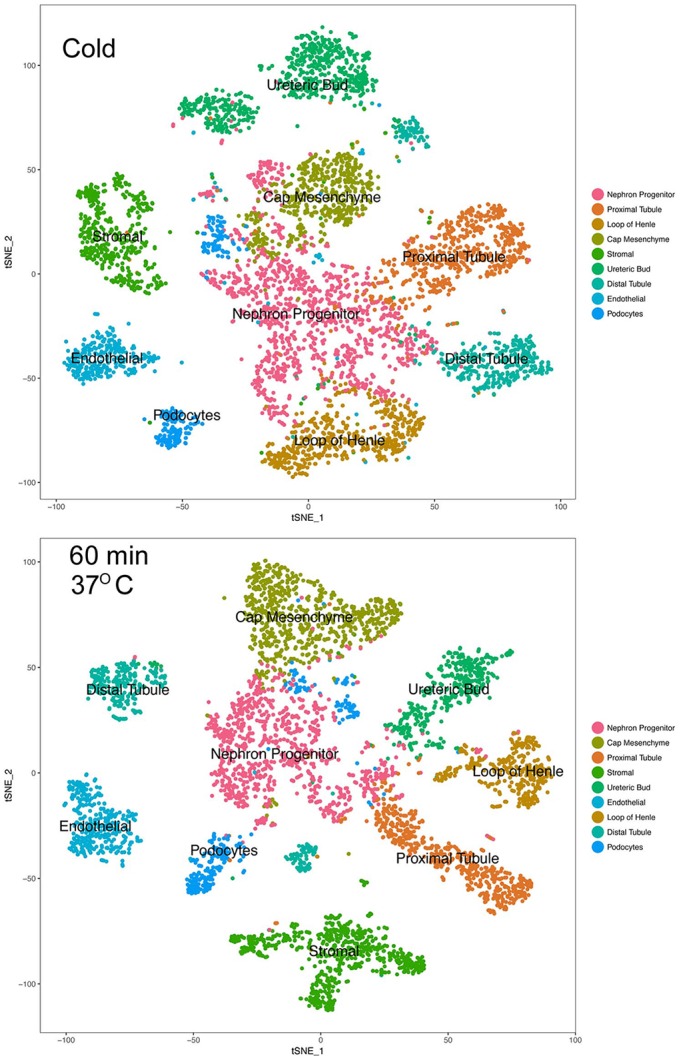
Single-cell RNA-seq is a powerful technique. Nevertheless, there are important limitations, including the technical challenges of breaking down an organ or tissue into a single-cell suspension. Invariably, this has required enzymatic incubation at 37°C, which can be expected to result in artifactual changes in gene expression patterns. Here, we describe a dissociation method that uses a protease with high activity in the cold, purified from a psychrophilic microorganism. The entire procedure is carried out at 6°C or colder, at which temperature mammalian transcriptional machinery is largely inactive, thereby effectively 'freezing in' the in vivo gene expression patterns. To test this method, we carried out RNA-seq on 20,424 single cells from postnatal day 1 mouse kidneys, comparing the results of the psychrophilic protease method with procedures using 37°C incubation. We show that the cold protease method provides a great reduction in gene expression artifacts. In addition, the results produce a single-cell resolution gene expression atlas of the newborn mouse kidney, an interesting time in development when mature nephrons are present yet nephrogenesis remains extremely active.

Keywords: Artifacts; Cell dissociation; Kidney development; RNA-seq; Single cell.


Conflict of interest statement

Competing interestsThe authors declare no competing or financial interests.

Figures

Fig. 1.
Fig. 1.
t-SNE plots of cells from P1 mouse kidneys. Top panel shows t-SNE analysis of cells that were dissociated with the cold active protease method, allowing the entire procedure to be carried out at 6°C or colder. Single-cell RNA-seq data for 5261 cells were generated with Drop-seq and unsupervised clustering carried out with the Seurat program. Even cells that are difficult to separate, such as podocytes, were effectively dissociated. The labeled nephron progenitor cells are rather diverse, as they include progenitor renal aggregate, renal vesicle, comma- and S-shaped bodies and multiple differentiating lineages. Bottom panel, for comparison, shows a t-SNE plot of 4440 cells dissociated using a 60 min at 37°C dissociation protocol. Similar groups of cells are identified using both procedures, demonstrating the power of the cold method to dissociate all cell types. Of interest, several cell types are showing separation into subtypes. For example, in the top panel the ureteric bud cells localized to the tips are distinct from the other ureteric bud cells in their clustering. Similarly, the color-coded distal tubule cells separate into two clusters, and other cell types, such as the stromal and proximal tubule cells, show interesting subdivisions, even in this first-stage analysis.
Fig. 2.
Fig. 2.
Venn diagrams showing overlap of gene expression differences associated with incubation at 37°C for varying time periods. This analysis focuses on five cell types, endothelial (Endo), podocytes (Pod), proximal tubule (Prox), loop of Henle (LOH) and cap mesenchyme (CM) progenitors. For each cell type, the gene expression patterns of the cells incubated at 37°C were compared with the gene expression patterns of the same cell types generated using the cold active protease procedure (P≤0.001, FC≥2). Results are shown for 15, 30 and 60 min 37°C incubations. Cell type-specific as well as shared gene expression changes are observed. The shared genes, showing change in more than one cell type, are thereby cross-validated. There are increasing numbers of these genes as a function of time of incubation at 37°C.
Fig. 3.
Fig. 3.
Changing expression of genes as a function of dissociation carried out at increasing times at 37°C. Gene expression after dissociation under the four different conditions is shown for the 38 genes with changed expression in all five cell types (endothelial, podocytes, proximal tubule, loop of Henle and cap mesenchyme) when incubated at 37°C for 60 min (P≤0.001, FC≥2). Cold represents expression levels with the cold active protease method. These basal expression levels, defined by the cold method, are often very low. Some genes, such as Fosb, show over 1000-fold increase in expression following 37°C incubation. The average normalized gene expression values (y-axis) were determined by first dividing the read count for each gene by the total of number reads in that cell, and multiplying by 10,000. These expression values were then averaged by adding for all cells, and dividing by the number of cells.
Fig. 4.
Fig. 4.
Heatmap showing subgroups of proximal tubule cells. Unsupervised clustering of the more mature proximal tubule cells generated the two clusters shown, with one expressing multiple segment specific genes associated with the S1 segment, and the other expressing genes known to be expressed in the S2,3 segments. Yellow indicates elevated expression; magenta indicates lower expression; black indicates equal expression.
Fig. 5.
Fig. 5.
Cells of the collecting duct system. Unsupervised clustering of the collecting duct cells identified a group expressing ureteric bud tip genes, including Ret, Wnt11 and Etv4, as shown in the left column (red cells). Most of the remaining cells expressed principle cell-associated genes, including Aqp2, Aqp4 and Scnn1b, as shown in the middle column (green cells). Of interest, a subset of the cells expressing principle cell genes also expressed genes that mark intercalated cells, as shown in the right column (blue cells), suggesting that they represent transitional cells. Many of these cells expressed the β intercalated cell-specific gene Slc26a4, whereas few expressed the more differentiated α intercalated cell gene Slc4a1.
Fig. 6.
Fig. 6.
Heatmap of stromal cell clusters. Unsupervised clustering of the stromal cells identified four subgroups: cells expressing genes active in the cortical stroma (Cort); cells with genes expressed in the medullary stroma (Med); cells expressing genes associated with the mesangial stroma (Mes); and cells expressing genes associated with active cell division (Div). Yellow indicates elevated expression; magenta indicates lower expression; black indicates equal expression.
Fig. 7.
Fig. 7.
Expression patterns of stromal-associated genes. Compartment-enriched expression of the genes associated with the cortical (Cort), medullary (Med) and mesangial (Mes) stromal cells (arrows). The genes shown do not necessarily show stroma-specific expression, but rather serve to separate the different stromal compartments. Of interest, Wnt11 showed moderate expression in the medullary stroma, and no detected expression in the cortical stroma, although the highest expression was, as expected, in the ureteric bud tips. Images are from in situ hybridizations generated as a part of the Allen Brain Atlas project (Jones et al., 2009). (The Allen Institute site contents are a free open resource, provided as a public courtesy.)

Similar articles

Cited by

References

    1. Al-Awqati Q. (2013). Cell biology of the intercalated cell in the kidney. FEBS Lett. 587, 1911-1914. 10.1016/j.febslet.2013.05.007 - DOI - PubMed
    1. Brunskill E. W., Park J.-S., Chung E., Chen F., Magella B. and Potter S. S. (2014). Single cell dissection of early kidney development: multilineage priming. Development 141, 3093-3101. 10.1242/dev.110601 - DOI - PMC - PubMed
    1. Chen J., Bardes E. E., Aronow B. J. and Jegga A. G. (2009). ToppGene Suite for gene list enrichment analysis and candidate gene prioritization. Nucleic Acids Res. 37, W305-W311. 10.1093/nar/gkp427 - DOI - PMC - PubMed
    1. Cheng C. N. and Wingert R. A. (2015). Nephron proximal tubule patterning and corpuscles of Stannius formation are regulated by the sim1a transcription factor and retinoic acid in zebrafish. Dev. Biol. 399, 100-116. 10.1016/j.ydbio.2014.12.020 - DOI - PMC - PubMed
    1. Chiang M.-K. and Melton D. A. (2003). Single-cell transcript analysis of pancreas development. Dev. Cell 4, 383-393. 10.1016/S1534-5807(03)00035-2 - DOI - PubMed

Publication types

Substances