. 2018 Jan 1;314(1):E21-E38.
doi: 10.1152/ajpendo.00215.2017. Epub 2017 Aug 29.

Cholesterol metabolism and Cx43, Cx46, and Cx50 gap junction protein expression and localization in normal and diabetic and obese ob/ob and db/db mouse testes

Affiliations

Cholesterol metabolism and Cx43, Cx46, and Cx50 gap junction protein expression and localization in normal and diabetic and obese ob/ob and db/db mouse testes

R-Marc Pelletier et al. Am J Physiol Endocrinol Metab. .

Abstract

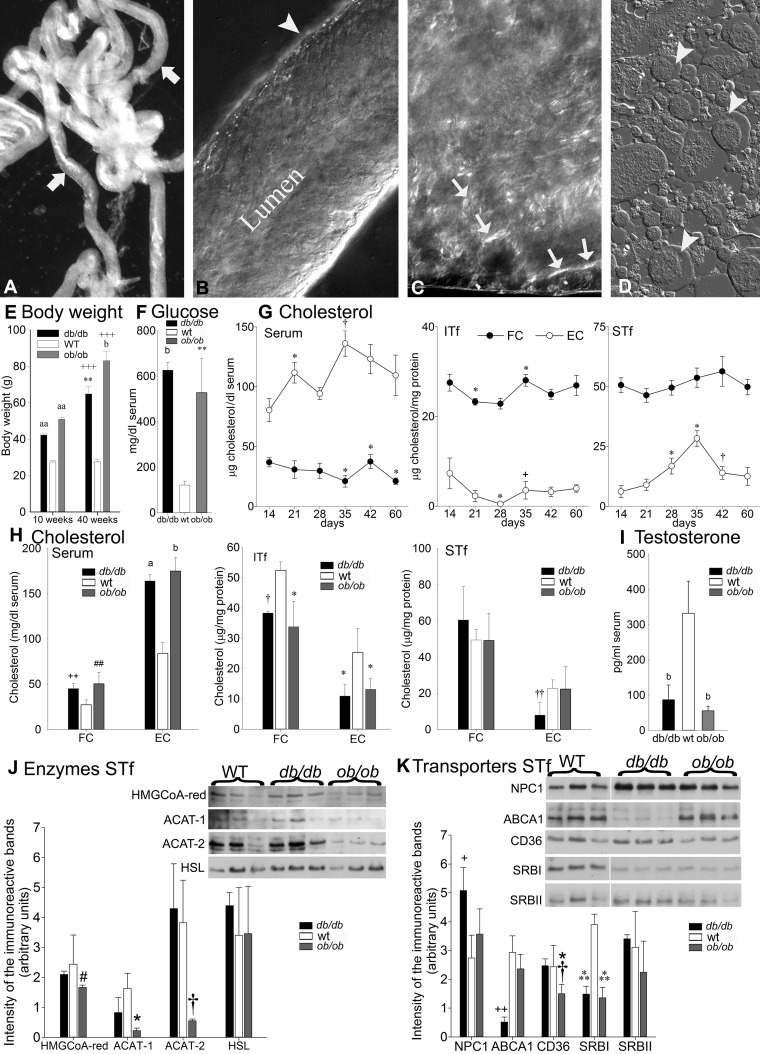
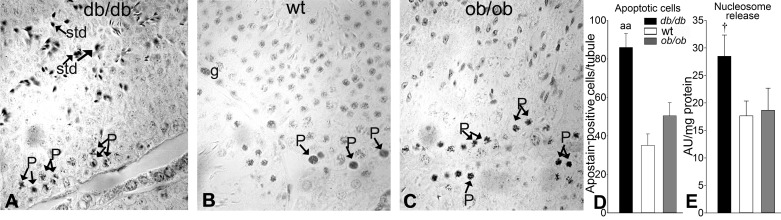
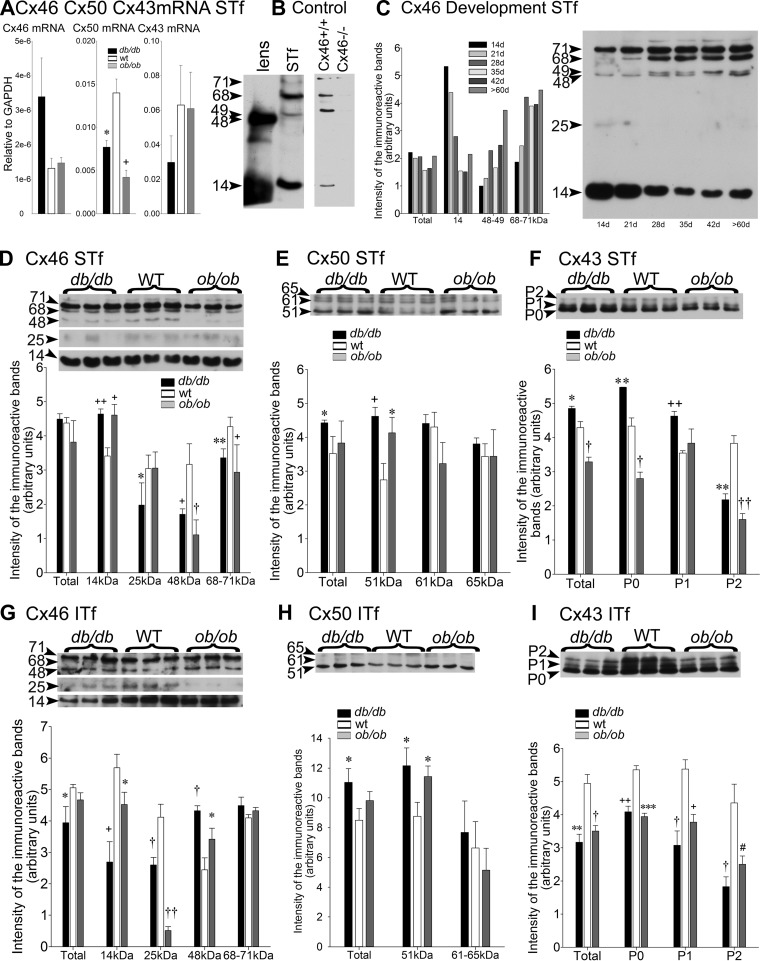
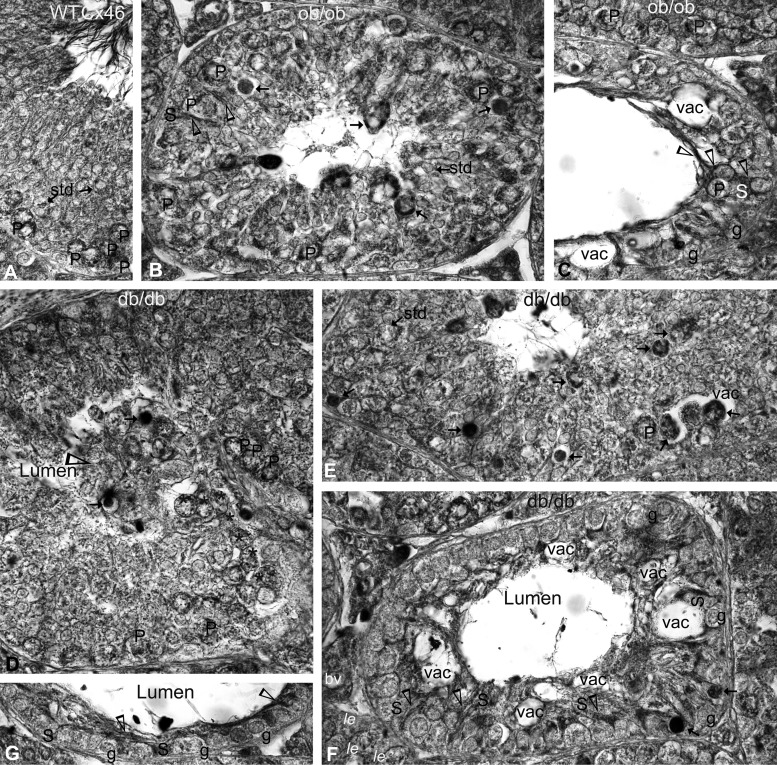
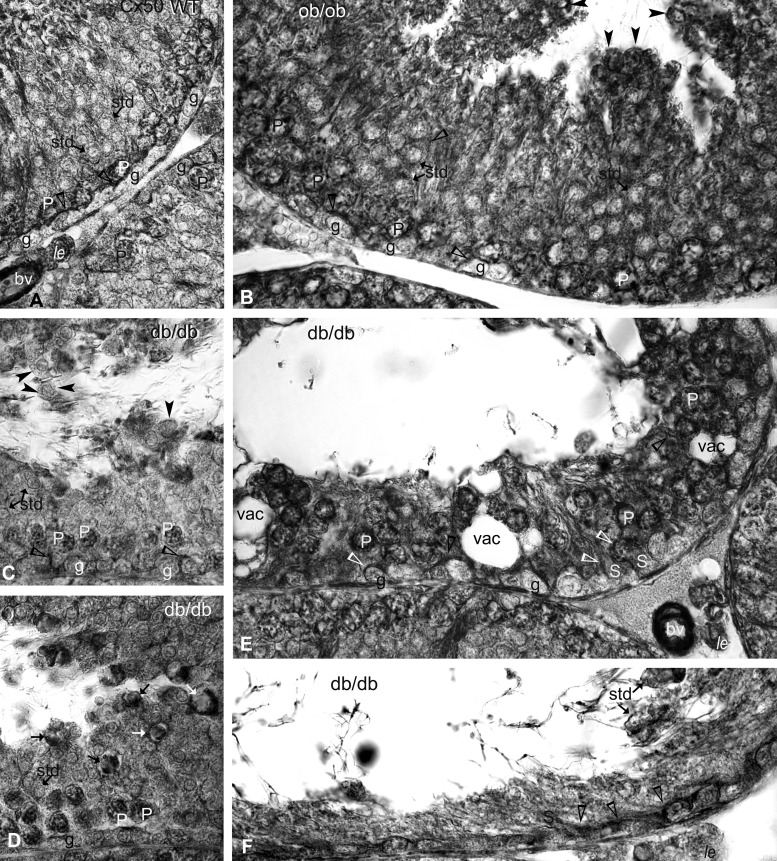
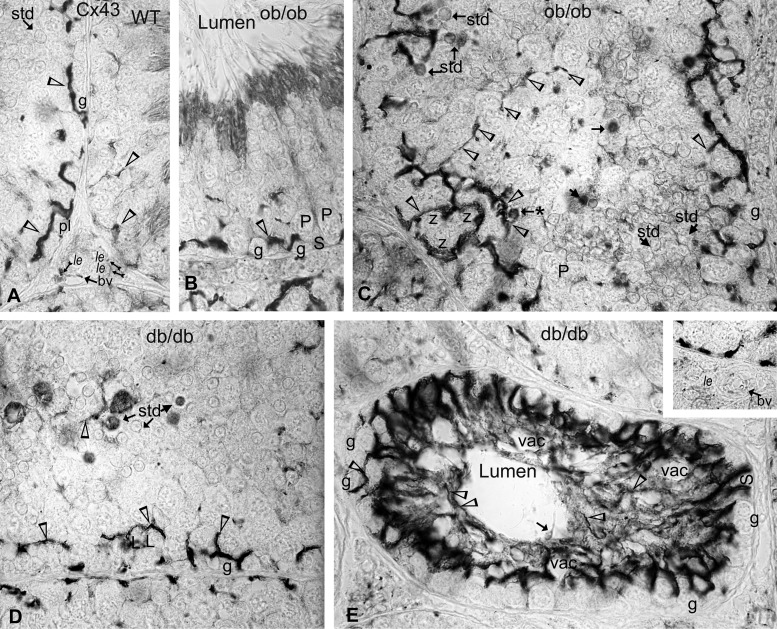
Decreased fertility and birth rates arise from metabolic disorders. This study assesses cholesterol metabolism and Cx46, Cx50, and Cx43 expression in interstitium- and seminiferous tubule-enriched fractions of leptin-deficient ( ob/ob) and leptin receptor-deficient ( db/db) mice, two type 2 diabetes and obesity models associated with infertility. Testosterone levels decreased and glucose and free and esterified cholesterol (FC and EC) levels increased in serum, whereas FC and EC levels decreased in the interstitium, in ob/ob and db/db mice. In tubules, a decrease in EC caused FC-to-EC ratios to increase in db/db mice. In tubules, only acyl coenzyme A:cholesterol acyl transferase type 1 and 2 protein levels significantly decreased in ob/ob, but not db/db, mice compared with wild-type mice, and imbalances in the cholesterol transporters Niemann-Pick C1 (NPC1), ATP-binding cassette A1 (ABCA1), scavenger receptor class B member I (SR-BI), and cluster of differentiation 36 (CD36) were observed in ob/ob and db/db mice. In tubules, 14-kDa Cx46 prevailed during development, 48- to 49- and 68- to 71-kDa Cx46 prevailed during adulthood, and total Cx46 changed little. Compared with wild-type mice, 14-kDa Cx46 increased, whereas 48- to 49- and 68- to 71-kDa Cx46 decreased, in tubules, whereas the opposite occurred in the interstitium, in db/db and ob/ob mice. Total and 51-kDa Cx50 increased in db/db and ob/ob interstitium and tubules. Cx43 levels decreased in ob/ob interstitium and tubules, whereas Cx43 decreased in db/db interstitium but increased in db/db tubules. Apoptosis levels measured by ELISA and numbers of apostain-labeled apoptotic cells significantly increased in db/db, but not ob/ob, tubules. Testicular db/db capillaries were Cx50-positive but weakly Cx43-positive with a thickened lamina, suggesting altered permeability. Our findings indicate that the db mutation-induced impairment of meiosis may arise from imbalances in cholesterol metabolism and upregulated Cx43 expression and phosphorylation in tubules.

Keywords: Sertoli cell; cholesterol; meiosis; spermatogenesis.


Figures

Fig. 1.
Fig. 1.
A–D: characterization of adult mouse unfixed and unstained seminiferous tubule (A–C) and interstitial tissue (D) fractions (STf and ITf) obtained without prior enzymatic digestion using an approach described in detail elsewhere (4). A and B: seminiferous tubule surface of the fractions is free of interstitial tissue residues (arrows in A and arrowhead in B). C: phase-contrast image of well-kept hexagonally packed actin filament bundles (arrows) near the base of the seminiferous epithelium facing cell junctions at the site of the blood-testis barrier and higher in the epithelium and facing spermatids. D: well-preserved lipid droplets (arrowheads) in several cells from this ITf. A: inverted bright-field light microscope image (magnification ×220). B and D: images obtained with Nomarsky optics (magnification ×440 and ×850, respectively). C: image obtained with a polarizing microscope (magnification ×700). E: body weight. By 10 wk, body weight was significantly higher in db/db (aaP < 0.000001) and ob/ob (aaP < 0.000001) than wild-type (WT) mice. By 40 wk, body weight was significantly higher in db/db (**P < 0.005) and ob/ob (bP < 0.0002) than WT mice. In WT mice, body weight was not significantly different between 10 and 40 wk. By contrast, body weight increased ∼1.5-fold in db/db mice (+++P < 0.0001) and 2-fold in ob/ob mice (+++P < 0.0001) between 10 and 40 wk. Values are means ± SE; n = 10 mice in each group. F: glucose concentration. Circulating glucose concentration increased in db/db (bP < 0.0002) and ob/ob (**P < 0.005) compared with WT mice. Values are means ± SE; n = 10 mice in each group. G: free and esterified cholesterol (FC and EC) in serum, STf, and ITf throughout development. Values are means ± SE of 3 independent experiments, with 5 mice in each group. In serum, FC levels decreased (*P < 0.05) from 14 to 35 days, increased significantly (*P < 0.05) from 35 to 42 days, and then decreased (*P < 0.05); EC levels increased significantly from 14 to 21 days (*P < 0.05) and again from 28 to 35 days (†P < 0.01). In ITf, decrease in FC levels from 14 to 21 days and increase from 28 to 35 days were significant (*P < 0.05); EC levels significantly decreased (*P < 0.05) from 14 to 28 days and then increased (+P < 0.02) from 28 to 35 days. In STf, FC was higher than EC; variations in FC were not significant; EC significantly increased (*P < 0.05) from 21 to 28 days and then from 28 to 35 days (*P < 0.05, 35 vs. 28 days) increased to ∼3-fold the magnitude of the 14-day value by 35 days, dropped sharply (†P < 0.01) from 35 to 42 days, and stabilized at ∼11 µg/mg total protein by >60 days. H: cholesterol in db/db, ob/ob, and WT mice. Serum FC levels very significantly increased (++P < 0.002) in db/db, as well as ob/ob (## P < 0.003), mice compared with their WT counterparts. Serum EC significantly increased in db/db (aP < 0.00001) and ob/ob (bP < 0.0002) mice compared with their WT counterparts. In ITf, FC (†P < 0.01) and EC (*P < 0.05) significantly decreased in db/db compared with WT mice. FC (*P < 0.05) and EC (*P < 0.05) were significantly lower in ob/ob than WT mice. Differences in FC were not significant in STf from db/db, ob/ob, and WT mice, whereas EC significantly decreased (††P < 0.001) in db/db compared with WT mice and was not different in ob/ob and WT mice. Values are means ± SE; n = 5 mice in each group. I: testosterone. Serum testosterone levels declined very significantly in db/db (bP < 0.0002) and ob/ob (bP < 0.0002) mice compared with their WT counterparts. Values are means ± SE; n = 10 mice in each group. J: representative Western blots and histograms of quantification of levels of enzyme proteins involved in cholesterol metabolism in STf from db/db, ob/ob, and WT mice. 3-Hydroxy-3-methylglutaryl coenzyme A (HMGCoA) reductase protein levels declined little in ob/ob and db/db compared with WT mice but were significantly lower in ob/ob (#P < 0.03) than db/db mice. Acyl coenzyme A:cholesterol acyl transferase (ACAT) type 1 (*P < 0.05) and ACAT-2 (†P < 0.01) levels decreased significantly in ob/ob compared with WT mice. Hormone-sensitive lipase (HSL) levels tended to rise in db/db compared with WT mice, but differences were not significant. Values are means ± SE; n = 3 mice per experimental condition. K: representative Western blots and histograms of quantification of levels of cholesterol transporter proteins in STf from db/db, ob/ob, and WT mice. Values are means ± SE; n = 3 animals per experimental condition. Increase in Niemann-Pick C1 (NPC1) protein was significant (+P < 0.02) in db/db, but not ob/ob, mice compared with their WT counterparts. Decrease in ATP-binding cassette A1 (ABCA1) was very significant (++P < 0.002) in db/db, but not ob/ob, mice compared with their WT counterparts. Cluster of differentiation 36 (CD36) decreased significantly in ob/ob compared with WT (*P < 0.05), but not db/db, mice. In addition, CD36 protein levels were significantly (†P < 0.01) lower in ob/ob than db/db mice. Scavenger receptor class B member I (SR-BI) levels decreased very significantly (***P < 0.0005) in db/db and ob/ob compared with WT mice, whereas SR-BII levels were not different in db/db, ob/ob, and WT mice.
Fig. 2.
Fig. 2.
A–C: Bouin’s-fixed paraffin-embedded testis sections from db/db, WT, and ob/ob mice reacted with MAb F7-26 (apostain) to immunolabel cells in apoptosis. Abundance of apostain-positive pachytene (P) spermatocytes and spermatids (std) was greater in testis sections from db/db than WT mice but comparable in ob/ob and WT mice. g, Spermatogonia. Magnification ×860. D: number of apostain-positive cells per seminiferous tubule. Number of apostain-labeled cells was significantly greater (aaP < 0.000001) in db/db than WT mice and increased, but not significantly, in ob/ob mice. Values are means ± SE; n = 3 animals per experimental condition. E: nucleosome releases measured by cell death detection ELISA in the cytoplasmic fraction of STf from db/db, WT, and ob/ob mice. Data are expressed as optical density at 410 nm [arbitrary units (AU)]. Values are means ± SE; n = 5 mice per experimental group. Increase in nucleosome release was significantly different in db/db (†P < 0.01) compared with WT mice, but not between ob/ob and WT mice.
Fig. 3.
Fig. 3.
A: connexin 46 (Cx46), Cx50, and Cx43 mRNA in db/db, ob/ob, and WT mice. STf samples were subjected to RT-PCR. Cx46 and Cx43 mRNA levels were not significantly different in db/db, ob/ob, and WT mice, whereas Cx50 mRNA levels decreased significantly in db/db (*P < 0.05) and ob/ob (+P < 0.02) compared with WT mice. Values are means ± SE; n = 3 animals per experimental condition. B: controls. Cx46 antibodies detected a prominent 14-kDa band and a 48- to 49-kDa Cx46-immunoreactive band in the lens, used as positive control. C: in adult (>60-day- old) normal mouse STf, 71- and 68-kDa, in addition to 48- and 14-kDa, Cx46-immunoreactive bands were detected. These immunoreactive bands were apparent in Cx46+/+, but not Cx46−/−, mouse tubule-enriched fractions. Values are means ± SE; n = 5 mice per group. D−F: representative Western blots and histograms of quantification of Cx46, Cx50, and Cx43 protein levels in STf from db/db, ob/ob, and WT mice. Values are means ± SE; n = 3 animals per experimental group. In D, sum of 14-, 25-, 48-, and 68- to 71-kDa (Total) Cx46 in db/db and ob/ob mice was not significantly different from that in WT mice; 14-kDa levels increased significantly in db/db (++P < 0.002) and ob/ob (+P < 0.02) mice, 25-kDa levels decreased significantly in db/db mice (*P < 0.05), 48-kDa levels decreased in db/db (+P < 0.02) and ob/ob (†P < 0.01) mice, and 68- to 71-kDa levels declined in db/db (**P < 0.005) and ob/ob (+P < 0.02) compared with WT mice. E: sum of 51- and 60-kDa (Total) Cx50 significantly increased in db/db (*P < 0.05), but not significantly in ob/ob, mice compared with their WT counterparts; 51-kDa levels rose sharply in db/db (+P < 0.02) and ob/ob (*P < 0.05) mice compared with their WT counterparts; 61-kDa levels changed little in db/db mice but slightly decreased in ob/ob compared with WT mice; 65-kDa levels were not significantly different in db/db and ob/ob compared with WT mice. F: sum of P0, P1, and P2 (Total) Cx43 significantly increased in db/db (*P < 0.05) but decreased in ob/ob (†P < 0.01) mice compared with their WT counterparts. P0 levels significantly increased in db/db (**P < 0.005) but decreased in ob/ob (†P < 0.01) mice. P1 levels increased significantly in db/db (++P < 0.002), but not significantly in ob/ob, mice compared with their WT counterparts. P2 levels dramatically decreased in db/db (**P < 0.005) and ob/ob (††P < 0.001) compared with WT mice. G−I: representative Western blots and histograms of quantification of Cx46, Cx50, and Cx43 protein levels in ITf from db/db, ob/ob, and WT mice. Values are means ± SE; n = 3 mice per experimental group. G: sum of 14-, 25-, 48-, and 68- to 71-kDa (Total) Cx46-immunoreactive bands decreased significantly in db/db (*P < 0.05), but not significantly in ob/ob, mice compared with their WT counterparts; 14-kDa levels decreased significantly in db/db (+P < 0.02) and ob/ob (*P < 0.05) mice compared with their WT counterparts; 25-kDa levels decreased in db/db (†P < 0.01) and ob/ob (†† P < 0.001) compared with WT mice; 48-kDa levels significantly increased in db/db (†P < 0.01) and ob/ob (*P < 0.05) mice; increase in 68- to 71-kDa levels was not significant in db/db and ob/ob compared with WT mice. H: sum of 65-, 61-, and 51-kDa (Total) Cx50 increased significantly in db/db (*P < 0.05), but not significantly in ob/ob, mice compared with their WT counterparts; 51-kDa levels significantly increased in db/db (*P < 0.05) and ob/ob (*P < 0.05) compared with WT mice. I: sum of P0, P1, and P2 (Total) Cx43 significantly decreased in db/db (**P < 0.005) and ob/ob (†P < 0.01) compared with WT mice; P0 levels significantly decreased in db/db (++P < 0.002) and ob/ob (***P < 0.0005) mice; P1 levels significantly decreased in db/db (†P < 0.01) and ob/ob (+P < 0.02) mice, and P2 levels dramatically decreased in db/db (†P < 0.01) and ob/ob (#P < 0.03) mice.
Fig. 4.
Fig. 4.
Cx46 immunoperoxidase labeling with anti-Cx46 in WT (A), ob/ob (B and C), and db/db (D−G) mouse testis. A: Cx46 in endoplasmic reticulum and Golgi apparatus of pachytene spermatocytes and in spermatids (std), where it appears as plentiful Cx46-positive minute dots. B: several apoptotic figures (arrows) among pachytene spermatocytes (P) and spermatids; abutting Sertoli cell membranes were Cx46-labeled (open arrowheads). C: the most damaged ob/ob mouse tubules contained fewer spermatids, and Sertoli cells (S) displayed several vacuoles (vac) in place of spermatogonia (g) and pachytene spermatocytes. Note Cx46 labeling (open arrowheads) in Sertoli cell processes that surround empty vacuoles and a few spermatogonia remaining in the seminiferous epithelium. D: sizeable plug (open arrowhead) of aggregating germ cells in various degenerative states, including apoptosis (arrows), virtually fills the lumen of this seminiferous tubule. *, Cells sloughed from the epithelium into the lumen. Labeling was seen in pachytene spermatocytes. E: arrows point to apoptotic figures, some within vacuoles. F: advanced stage of destruction. Most germ cells have been exfoliated; spermatogonia and remaining Sertoli cells display variously sized vacuoles and contain Cx46-positive material (open arrowheads). Blood vessel is not labeled. le, Cx46-positive Leydig cells. G: much thinned seminiferous epithelium in advanced stages of destruction containing few remaining spermatogonia and Sertoli cells exhibiting Cx46-positive material (open arrowheads). Arrows point to apoptotic figures. Magnification ×860.
Fig. 5.
Fig. 5.
Cx50. Immunoperoxidase labeling with anti-Cx50 in WT (A), ob/ob (B), and db/db (C−F) mouse testes. A: labeling of intercellular contacts above spermatogonia (g) and young spermatocytes near the basal third of the seminiferous epithelium (open arrowheads). Pachytene spermatocytes (P) are intensely labeled; spermatids (std) contain minute Cx50-positive dots. Distribution of Cx50 labeling (open arrowheads) above spermatogonia and preleptotene spermatocytes occurred with that of junctional complexes established at the site of the blood-testis barrier in this late-stage VII seminiferous tubule from a WT mouse. Blood vessel (bv) within the interstitial space is labeled. B: Cx50 labeling (open arrowheads) in Sertoli cell junctional complexes set at the site of the barrier luminal to spermatogonia and at the cell membranes of round spermatids. Pachytene spermatocytes and round spermatids exhibit heavy labeling, and minute Cx50-positive dots are abundant within spermatids. Closed arrowheads point to clumps of sloughed germ cells. C: frequent sloughing (closed arrowheads) of clumps of germ cells in db/db mouse tubules. Pachytene spermatocytes are labeled. Open arrowheads show Cx50 labeling of Sertoli cell junctional complexes established above spermatogonia. D: arrows point to apoptotic figures among spermatids. Pachytene spermatocytes are labeled. E: sloughing of germ cells left behind large vacuoles (vac) within Sertoli cells (S). Note labeling (open arrowheads) in inter-Sertoli cell contacts arching above spermatogonia and in pachytene spermatocytes remaining. Blood vessels are heavily labeled. F: labeling (open arrowheads) in Sertoli cells of this damaged tubule containing few spermatogonia and sloughed spermatids. Magnification ×860.
Fig. 6.
Fig. 6.
Cx43. Immunoperoxidase pan-Cx43 labeling in WT (A), ob/ob (B and C), and db/db (D and E) mouse testes. A: pan-Cx43 distribution in WT mouse seminiferous epithelium similar to that reported in other rodent species (64, 65). Open arrowheads show Cx43 labeling of basal third of the epithelium in stage VI of a WT adult mouse, next to spermatogonia (g) and young spermatocytes. In interstitial tissue, Cx43 labels small blood vessels (bv) and Leydig cell (le) contacts. B: in ob/ob mice, a large proportion of tubules exhibit Cx43 labeling (open arrowheads) in intercellular contacts established near the basal third of the epithelium next to spermatogonia and, occasionally, near pachytene spermatocytes (P) and spermatids (std). C: tubule with collapsed lumen. Arrows point to apoptotic figures, many of which are spermatids. Arrow with asterisk points to an apoptotic figure surrounded by a faint Cx43-positive halo. Open arrowheads point to Cx43-positive Sertoli cell contacts next to spermatogonia, some surrounding a cohort of zygotene spermatocytes (z), and others near the center of the tubule. D: tubule with collapsed lumen. Spermatids exhibit apoptotic features. Open arrowheads point to reaction product in intercellular contacts near spermatogonia and leptotene spermatocytes (L) and other contacts near the center of the tubule. E: tubule with lumen showing advanced deterioration, although epithelium appears to be depleted of most spermatids and to contain several empty vacuoles (vac) surrounded by thin Sertoli cell cytoplasmic processes intensely labeled with Cx43 (open arrowheads). Spermatogonia (g) and Sertoli cells (S) remain. Inset: traces of Cx43 labeling in a small blood vessel; labeling is scarce among db/db Leydig cells. Magnification ×860.

Similar articles

Cited by

References

    1. Adamson GD, Baker VL. Subfertility: causes, treatment and outcome. Best Pract Res Clin Obstet Gynaecol 17: 169–185, 2003. doi:10.1016/S1521-6934(02)00146-3. - DOI - PubMed
    1. Akpovi CD, Anago EAA, Segbo JAG, Manindji C, Medehouenou TCM, Loko F, Vitale ML, Pelletier R-M. Blood biochemical parameter levels vary with spermatogenesis in seasonal reproductive model, the mink (Mustela vison). Int J Biosci 6: 222–229, 2015. doi:10.12692/ijb/6.2.222-229. - DOI
    1. Akpovi CD, Murphy BD, Erickson RP, Pelletier R-M. Dysregulation of testicular cholesterol metabolism following spontaneous mutation of the Niemann-Pick C1 gene in mice. Biol Reprod 91: 42–49, 2014. doi:10.1095/biolreprod.114.119412. - DOI - PubMed
    1. Akpovi CD, Pelletier R-M. A revised and improved method for the isolation of seminiferous tubule-enriched fractions that preserves the phosphorylated and glycosylated forms of proteins. In: Human Embryogenesis: Methods and Protocols, edited by Lafond J, Vaillancourt C. Totowa, NJ: Humana Press Springer Protocols, 2009, p. 159–168. doi:10.1007/978-1-60327-009-0_9. - DOI - PubMed
    1. Akpovi CD, Yoon SR, Vitale ML, Pelletier R-M. The predominance of one of the SR-BI isoforms is associated with increased esterified cholesterol levels not apoptosis in mink testis. J Lipid Res 47: 2233–2247, 2006. doi:10.1194/jlr.M600162-JLR200. - DOI - PubMed

Publication types

MeSH terms