Transcription elongation rate has a tissue-specific impact on alternative cleavage and polyadenylation in Drosophila melanogaster
- PMID: 28851752
- PMCID: PMC5689002
- DOI: 10.1261/rna.062661.117
Transcription elongation rate has a tissue-specific impact on alternative cleavage and polyadenylation in Drosophila melanogaster
Abstract
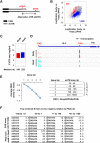
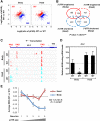
Alternative polyadenylation (APA) is a mechanism that generates multiple mRNA isoforms with different 3'UTRs and/or coding sequences from a single gene. Here, using 3' region extraction and deep sequencing (3'READS), we have systematically mapped cleavage and polyadenylation sites (PASs) in Drosophila melanogaster, expanding the total repertoire of PASs previously identified for the species, especially those located in A-rich genomic sequences. Cis-element analysis revealed distinct sequence motifs around fly PASs when compared to mammalian ones, including the greater enrichment of upstream UAUA elements and the less prominent presence of downstream UGUG elements. We found that over 75% of mRNA genes in Drosophila melanogaster undergo APA. The head tissue tends to use distal PASs when compared to the body, leading to preferential expression of APA isoforms with long 3'UTRs as well as with distal terminal exons. The distance between the APA sites and intron location of PAS are important parameters for APA difference between body and head, suggesting distinct PAS selection contexts. APA analysis of the RpII215C4 mutant strain, which harbors a mutant RNA polymerase II (RNAPII) with a slower elongation rate, revealed that a 50% decrease in transcriptional elongation rate leads to a mild trend of more usage of proximal, weaker PASs, both in 3'UTRs and in introns, consistent with the "first come, first served" model of APA regulation. However, this trend was not observed in the head, suggesting a different regulatory context in neuronal cells. Together, our data expand the PAS collection for Drosophila melanogaster and reveal a tissue-specific effect of APA regulation by RNAPII elongation rate.
Keywords: 3′READS; Drosophila; RNA polymerase II; alternative polyadenylation; transcription elongation rate.
© 2017 Liu et al.; Published by Cold Spring Harbor Laboratory Press for the RNA Society.
Figures


Similar articles
-
Systematic profiling of poly(A)+ transcripts modulated by core 3' end processing and splicing factors reveals regulatory rules of alternative cleavage and polyadenylation.PLoS Genet. 2015 Apr 23;11(4):e1005166. doi: 10.1371/journal.pgen.1005166. eCollection 2015 Apr. PLoS Genet. 2015. PMID: 25906188 Free PMC article.
-
Analysis of alternative cleavage and polyadenylation by 3' region extraction and deep sequencing.Nat Methods. 2013 Feb;10(2):133-9. doi: 10.1038/nmeth.2288. Epub 2012 Dec 16. Nat Methods. 2013. PMID: 23241633 Free PMC article.
-
Evolution of Hox post-transcriptional regulation by alternative polyadenylation and microRNA modulation within 12 Drosophila genomes.Mol Biol Evol. 2011 Sep;28(9):2453-60. doi: 10.1093/molbev/msr073. Epub 2011 Mar 24. Mol Biol Evol. 2011. PMID: 21436120
-
Implications of polyadenylation in health and disease.Nucleus. 2014;5(6):508-19. doi: 10.4161/nucl.36360. Epub 2014 Oct 31. Nucleus. 2014. PMID: 25484187 Free PMC article. Review.
-
Cleavage factor Im (CFIm) as a regulator of alternative polyadenylation.Biochem Soc Trans. 2016 Aug 15;44(4):1051-7. doi: 10.1042/BST20160078. Biochem Soc Trans. 2016. PMID: 27528751 Review.
Cited by
-
Targeting mRNA processing as an anticancer strategy.Nat Rev Drug Discov. 2020 Feb;19(2):112-129. doi: 10.1038/s41573-019-0042-3. Epub 2019 Sep 25. Nat Rev Drug Discov. 2020. PMID: 31554928 Review.
-
Elevated pre-mRNA 3' end processing activity in cancer cells renders vulnerability to inhibition of cleavage and polyadenylation.Nat Commun. 2023 Aug 1;14(1):4480. doi: 10.1038/s41467-023-39793-8. Nat Commun. 2023. PMID: 37528120 Free PMC article.
-
Alternative polyadenylation mediates genetic regulation of gene expression.Elife. 2020 Jun 25;9:e57492. doi: 10.7554/eLife.57492. Elife. 2020. PMID: 32584258 Free PMC article.
-
CDK12 regulates DNA repair genes by suppressing intronic polyadenylation.Nature. 2018 Dec;564(7734):141-145. doi: 10.1038/s41586-018-0758-y. Epub 2018 Nov 28. Nature. 2018. PMID: 30487607 Free PMC article.
-
Light regulates widespread plant alternative polyadenylation through the chloroplast.Proc Natl Acad Sci U S A. 2024 Aug 20;121(34):e2405632121. doi: 10.1073/pnas.2405632121. Epub 2024 Aug 16. Proc Natl Acad Sci U S A. 2024. PMID: 39150783 Free PMC article.
References
-
- Cai T, Krause MW, Odenwald WF, Toyama R, Notkins AL. 2001. The IA-2 gene family: homologs in Caenorhabditis elegans, Drosophila and zebrafish. Diabetologia 44: 81–88. - PubMed
-
- Chang JW, Zhang W, Yeh HS, de Jong EP, Jun S, Kim KH, Bae SS, Beckman K, Hwang TH, Kim KS, et al. 2015. mRNA 3′-UTR shortening is a molecular signature of mTORC1 activation. Nat Commun 6: 7218. - PubMed
-
- Chen Y, Chafin D, Price DH, Greenleaf AL. 1996. Drosophila RNA polymerase II mutants that affect transcription elongation. J Biol Chem 271: 5993–5999. - PubMed
Publication types
MeSH terms
Substances
Grants and funding
LinkOut - more resources
Full Text Sources
Other Literature Sources
Molecular Biology Databases
Miscellaneous
