

The innate immune receptor MDA5 limits rotavirus infection but promotes cell death and pancreatic inflammation
- PMID: 28851763
- PMCID: PMC5599799
- DOI: 10.15252/embj.201696273
The innate immune receptor MDA5 limits rotavirus infection but promotes cell death and pancreatic inflammation
Abstract
Melanoma differentiation-associated protein 5 (MDA5) mediates the innate immune response to viral infection. Polymorphisms in IFIH1, the gene coding for MDA5, correlate with the risk of developing type 1 diabetes (T1D). Here, we demonstrate that MDA5 is crucial for the immune response to enteric rotavirus infection, a proposed etiological agent for T1D. MDA5 variants encoded by minor IFIH1 alleles associated with lower T1D risk exhibit reduced activity against rotavirus infection. We find that MDA5 activity limits rotavirus infection not only through the induction of antiviral interferons and pro-inflammatory cytokines, but also by promoting cell death. Importantly, this MDA5-dependent antiviral response is specific to the pancreas of rotavirus-infected mice, similar to the autoimmunity associated with T1D. These findings imply that MDA5-induced cell death and inflammation in the pancreas facilitate progression to autoimmune destruction of pancreatic β-cells.
Keywords: MDA5; inflammation; innate immunity; interferons; type 1 diabetes.
© 2017 The Authors.
Figures
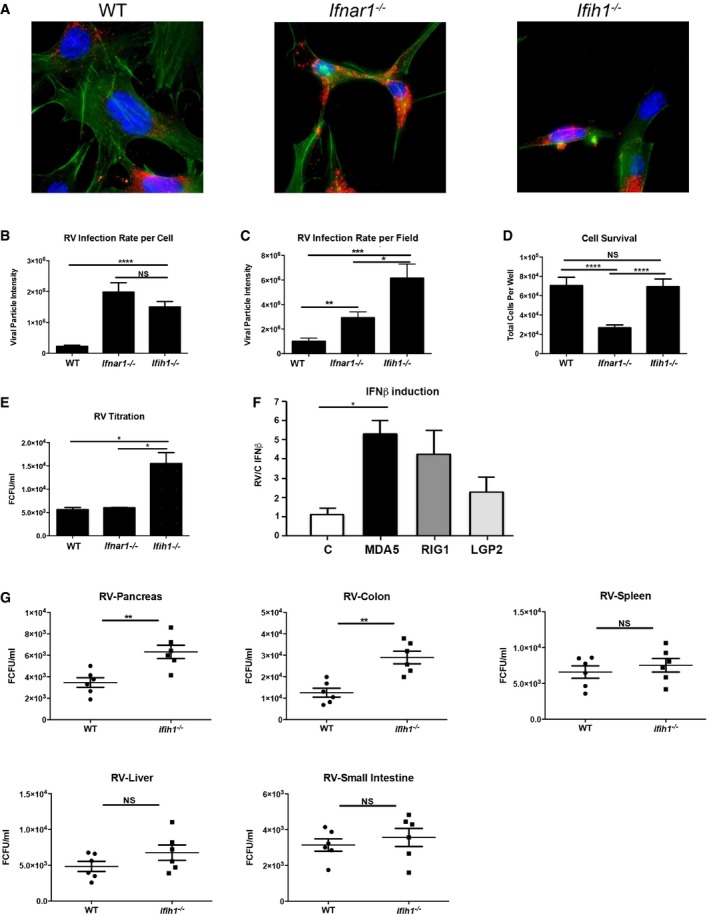
- A
Micrographs of WT, Ifnar1 −/−, and Ifih1 −/− MEFs infected with RV for 24 h, then assessed by immunofluorescence. The viral capsid protein is detected with an anti‐SA11 antibody (red), actin filaments are visualized with CF647 phalloidin (green), and nuclei are visualized with Hoechst stains (blue).
- B, C
RV replication in the indicated MEFs was quantitated by calculating the number and intensities of viral particles per cell (B), or per micrograph field (C).
- D
The relative survival of WT, Ifnar1 −/−, and Ifih1 −/− MEFs after RV infection for 24 h was assessed by direct counting of the cells.
- E
A titration of virus produced in WT, Ifnar1 −/−, and Ifih1 −/− MEFs by immunofluorescence.
- F
The relative induction of an IFNB1‐promoter firefly‐luciferase reporter 24 h after RV infection in HEK293 cells co‐transfected with control empty vector (C), MDA5‐, RIG‐I‐, or LGP2‐expressing constructs. The levels of firefly luciferase were normalized to a constitutively active Renilla luciferase and expressed relative to control cells.
- G
Quantitation of RV from the indicated tissues of WT and Ifih1 −/− mice orally infected with RV for 5 days. Viral infection was quantified by titration against MA104 cells and immunofluorescence.
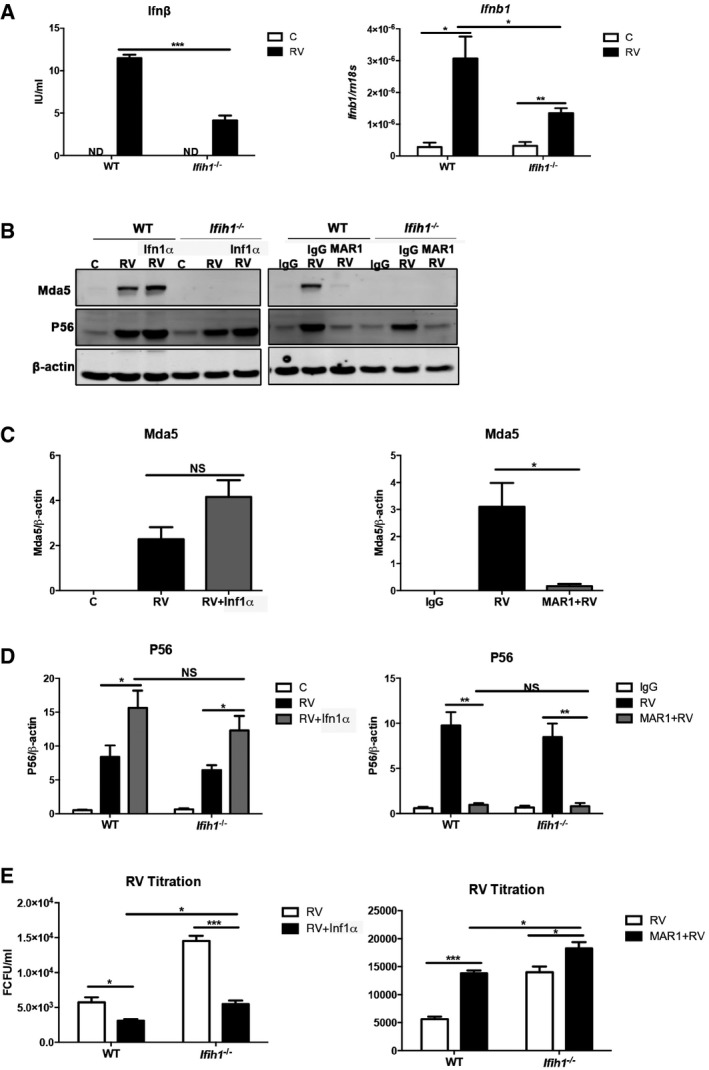
- A
Graphs showing the levels of Ifnβ protein (on left) and the Ifnb1 transcript (on right) induced in WT and Ifih1 −/− MEFs infected with RV assessed after 24 h by ELISA or after 6 h by qRT–PCR.
- B
Immunoblots assessing the levels of Mda5 and P56 relative to β‐actin in lysates from control (C) or infected (RV) WT and Ifih1 −/− MEFs pre‐treated with Ifn1α for 16 h or, alternatively, an Ifnar1‐neutralizing (MAR1) or control (IgG) antibody for 1 h prior to infection with RV for 24 h.
- C, D
Graphs showing the quantitation of the levels of Mda5 and P56 under the identified conditions as detected by immunoblot (see also Fig EV1).
- E
A quantitation of progeny RV from WT and Ifih1 −/− MEFs treated with Ifn1α or MAR1.
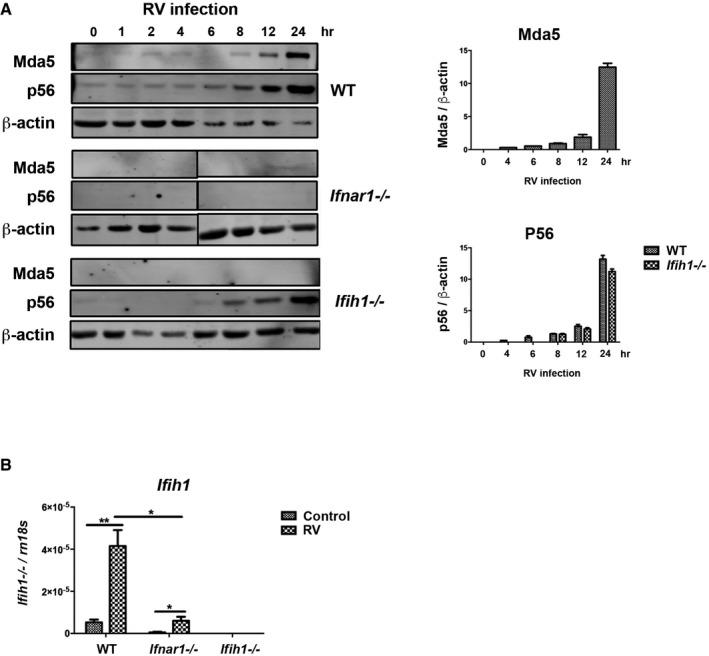
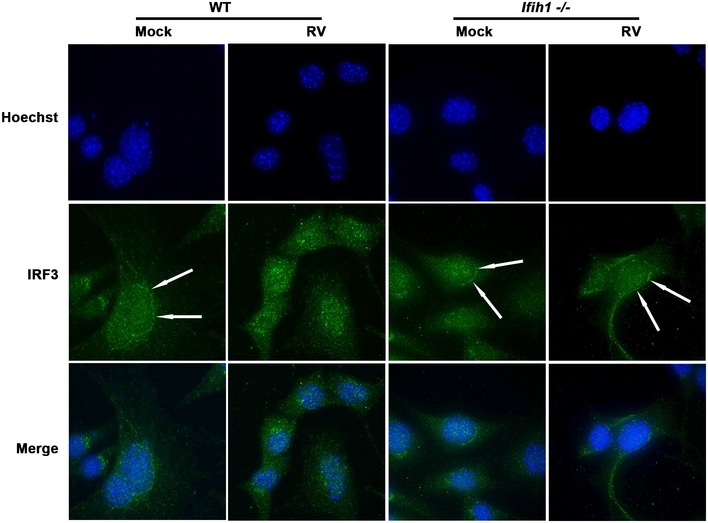
Detection (on left) and quantitation (on right) of Mda5 and P56 induction relative to β‐actin in WT, Ifnar1 −/−, and Ifih1 −/− MEFs infected with RV for the indicated times by immunoblot.
Quantitation of the induction of the Ifih1 mRNA in WT, Ifnar1 −/−, and Ifih1 −/− MEFs 6 h post‐infection with RV by qRT–PCR.
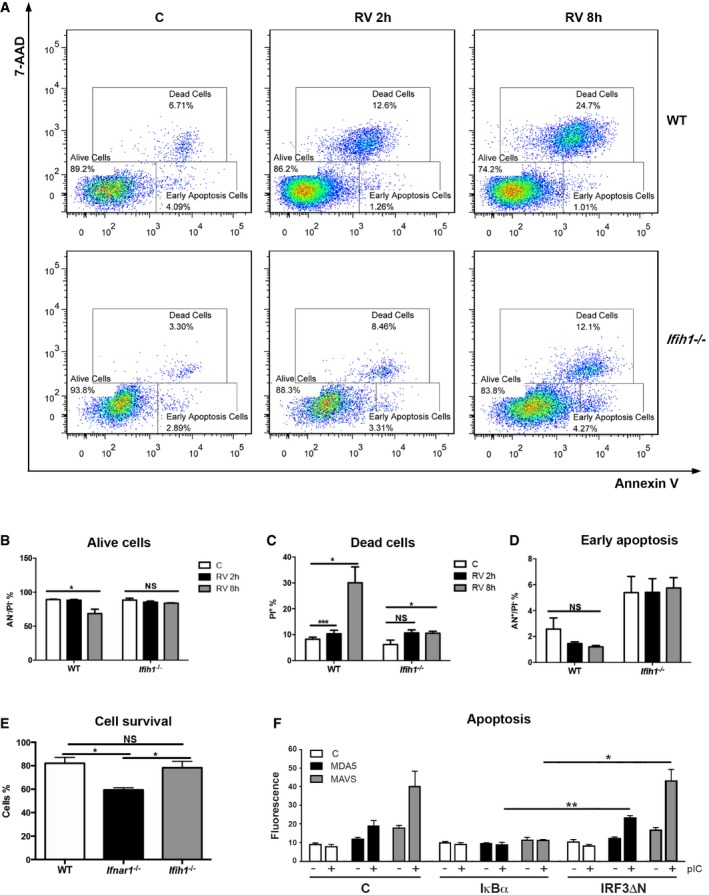
- A
FACS plots showing annexin V and 7‐AAD staining of WT and Ifih1 −/− MEFs mock‐ or RV‐infected for 2 and 8 h.
- B–D
A quantitation of the live, dead, and early apoptotic cells by their relative 7‐AAD and annexin V staining.
- E
A quantitation of the relative survival of WT, Ifnar1 −/−, and Ifih1 −/− MEFs RV‐infected for 24 h, then assessed by staining with crystal violet and spectrophotometry.
- F
A quantitation of apoptosis in HEK293 cells co‐transfected with an empty control (C), MDA5‐, or MAVS‐expressing vectors and either control (C), IκBα, or dominant‐negative IRF3 (IRF3ΔN) constructs to repress the activity of NFκB or IRF3, respectively. These cells were either left untreated (−) or transfected (+) with FuGENE:pIC for 10 h, and then, apoptosis was assessed by measuring the nuclear accumulation of YO‐PRO by co‐localization with the nuclear Hoechst stain (see also Fig EV3).
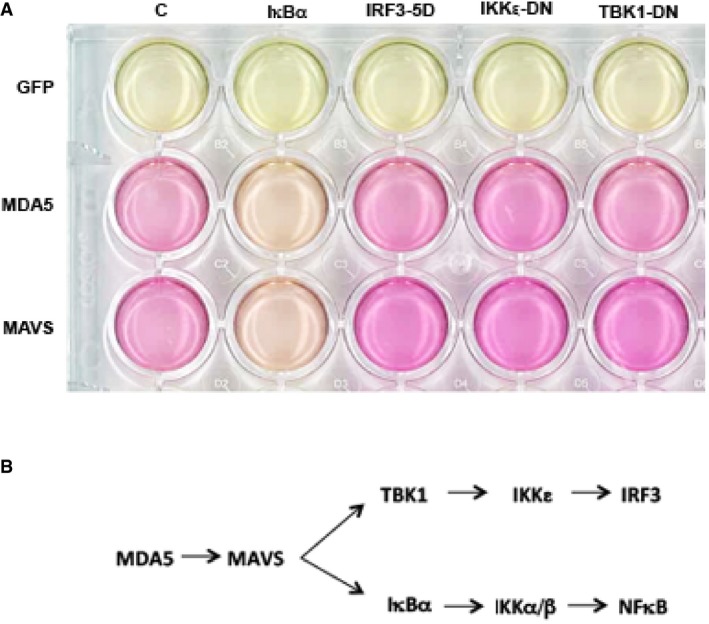
Relative cell survival assessed by the pH‐dependent color change of culture medium supporting HEK293 cells transfected with GFP, MDA5 or MAVS expression constructs, and a control backbone vector (C) or dominant‐negative constructs of TANK‐binding kinase 1 (TBK1‐DN), IKK‐related kinase ε (IKKε‐DN), a constitutively active IRF3 construct (IRF3‐5D), or the NFκB inhibitor, IκBα, after 90 h of culture.
A schematic of MDA5‐dependent cell signaling in the cell.
- A
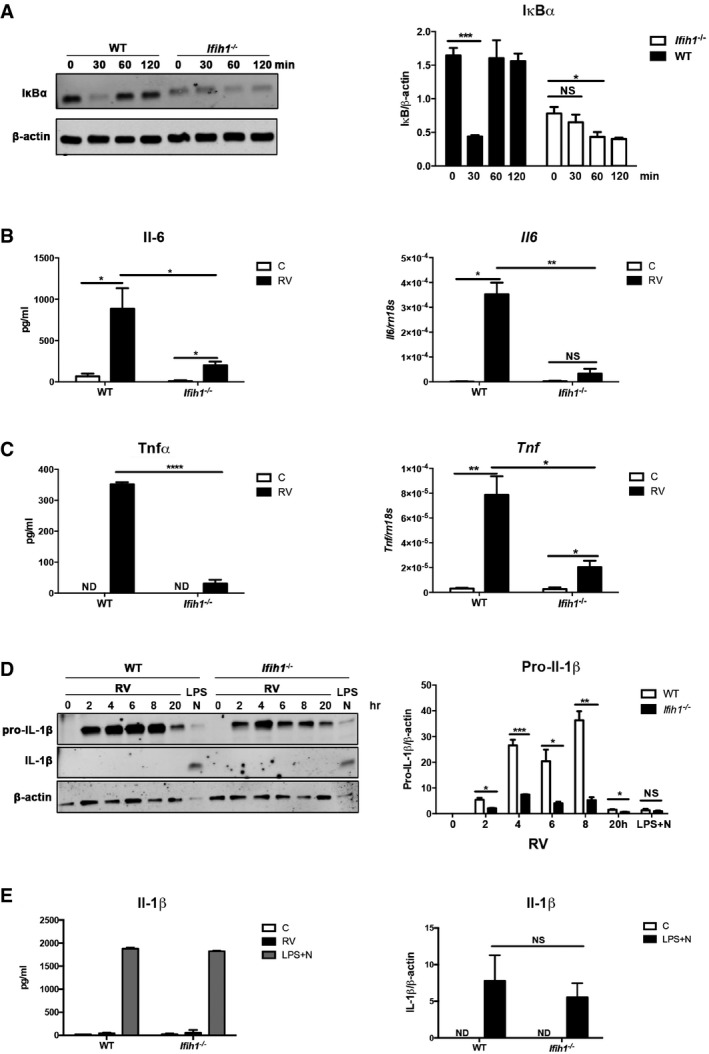
Detection (on left) and quantitation (on right) of NFκB activation by assessing the levels of its cytosolic inhibitor IκBα relative to the β‐actin in WT and Ifih1 −/− MEFs infected with RV for the indicated times.
- B, C
Graphs showing the relative induction of the Il‐6 and Tnfα cytokines and Il6 and Tnf transcripts in WT and Ifih1 −/− primary peritoneal macrophages infected with RV measured by ELISA after 24 h or qRT–PCR after 6 h, respectively.
- D, E
Detection (on left) and quantitation of both immature and processed Il‐1β in lysates from WT and Ifih1 −/− primary peritoneal macrophages that were infected with RV for the indicated times, or treated with lipopolysaccharide (LPS) plus the potassium ionophore nigericin (N) by ELISA (on left) and immunoblot (on right) after 20 h. The levels of Il‐1β are quantitated relative to β‐actin in the immunoblot.
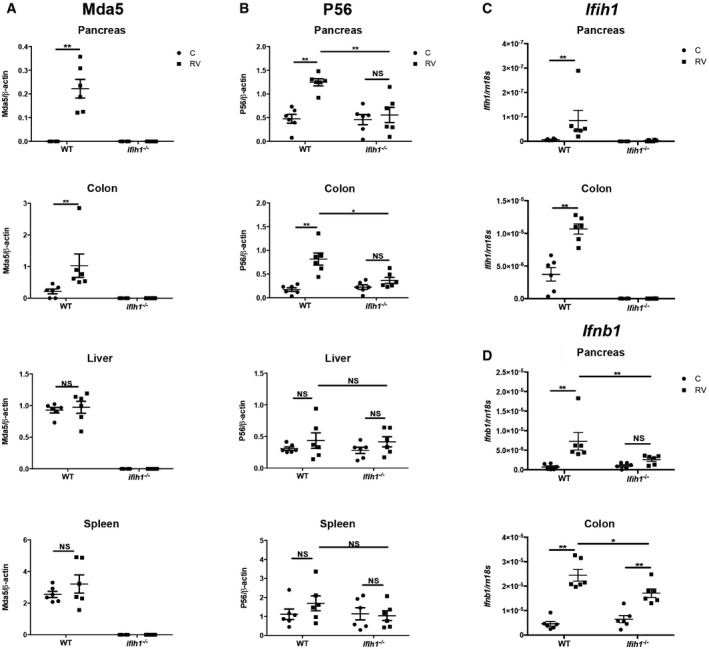
- A–D
Measures of the induction of the Mda5 and P56 proteins and the Ifih1 and Ifnb1 transcripts in the indicated tissues of 5‐week‐old WT and Ifih1 −/− mice infected with RV for 5 days, detected by ELISA or qRT–PCR, respectively. The levels of the transcripts were quantified and normalized to the levels of the 18S ribosomal RNA (Rn18s). The data are shown as mean ± SEM. The Mann–Whitney test was used to calculate the P‐values (n = 6). NS = P > 0.05, *P ≤ 0.05, **P ≤ 0.01.
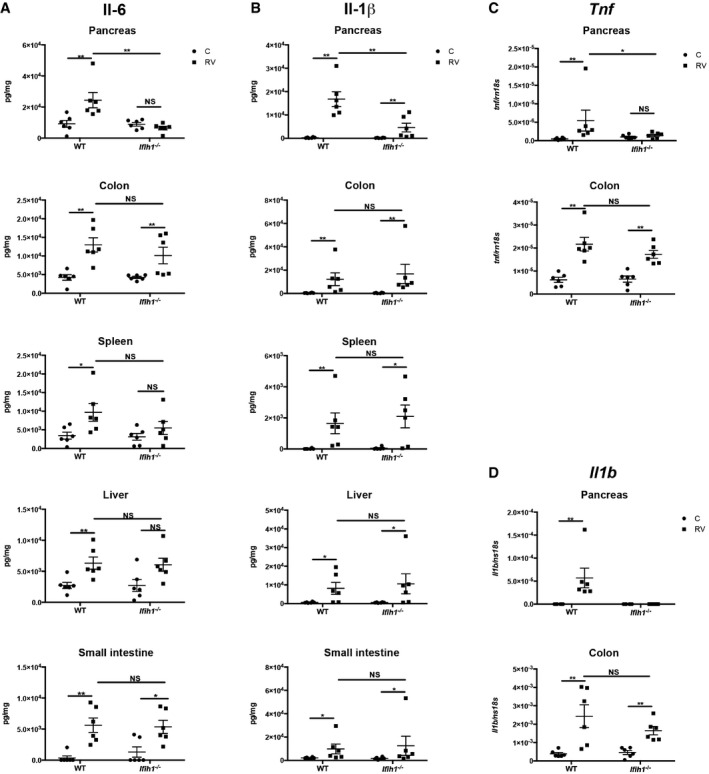
- A–D
Measures of the induction of the Il‐6 and Il‐1β proteins and the Tnf and Il1b transcripts in the indicated tissues of 5‐week‐old WT and Ifih1 −/− mice infected with RV for 5 days as detected by ELISA or qRT–PCR, respectively. The levels of the transcripts were quantified and normalized to the levels of the 18S ribosomal RNA (Rn18s). The data are shown as mean ± SEM. The Mann–Whitney test was used to calculate the P‐values (n = 6). NS = P > 0.05, *P ≤ 0.05, **P ≤ 0.01.

- A
Micrographs showing Venus fluorescence (green) produced by homotypic interaction between split‐Venus fusion constructs of MAVS at 56 h (far right) or MDA5 after 48 and 56 h (first and second columns) and heterologous interactions between MDA5 and MAVS at 56 h (third column) in HEK293 cells. Mitochondria are visualized with MitoTracker (magenta), and cell nuclei are stained with Hoechst (blue). Arrows indicate the co‐localization of protein complexes (Venus) and mitochondria.
- B, C
Graphs quantitating the association between the major (MDA5) and minor IFIH1 alleles (T946, V923, and X627) and the complementary split‐Venus tag alone (C), MDA5 or MAVS tagged with the separate halves of the split‐Venus fluorophore and assessed by the fluorescence intensity in the cell after 48 h (n = 3) (see also Fig EV4).
- D–F
The relative induction of IFNB1‐, IFIT1‐, and IL‐8‐promoter firefly‐luciferase reporters 24 h after mock or RV infection in HEK293 cells co‐transfected with the control LV‐GFP (C) or the indicated MDA5‐GFP constructs (n = 3). The levels of firefly luciferase were normalized to a constitutively active Renilla luciferase and expressed relative to control (GFP only) cells that did not express MDA5 (see also Fig EV5).
- G
The relative survival of HEK293 cells expressing the indicated MDA5‐GFP or control GFP (C) constructs labeled with annexin V and 7‐AAD and assessed by FACS (n = 3) (see also Fig EV5).
- H
The relative production of recombinant control LV‐GFP (C) or the indicated MDA5‐GFP lentivirus (LV) measured by quantitating GFP fluorescence in HEK293 cells (n = 3).
- I
Titration of RV produced from HEK293 cells transfected with the control LV‐GFP (C) or the indicated MDA5‐GFP constructs (n = 3) (see also Fig EV6).
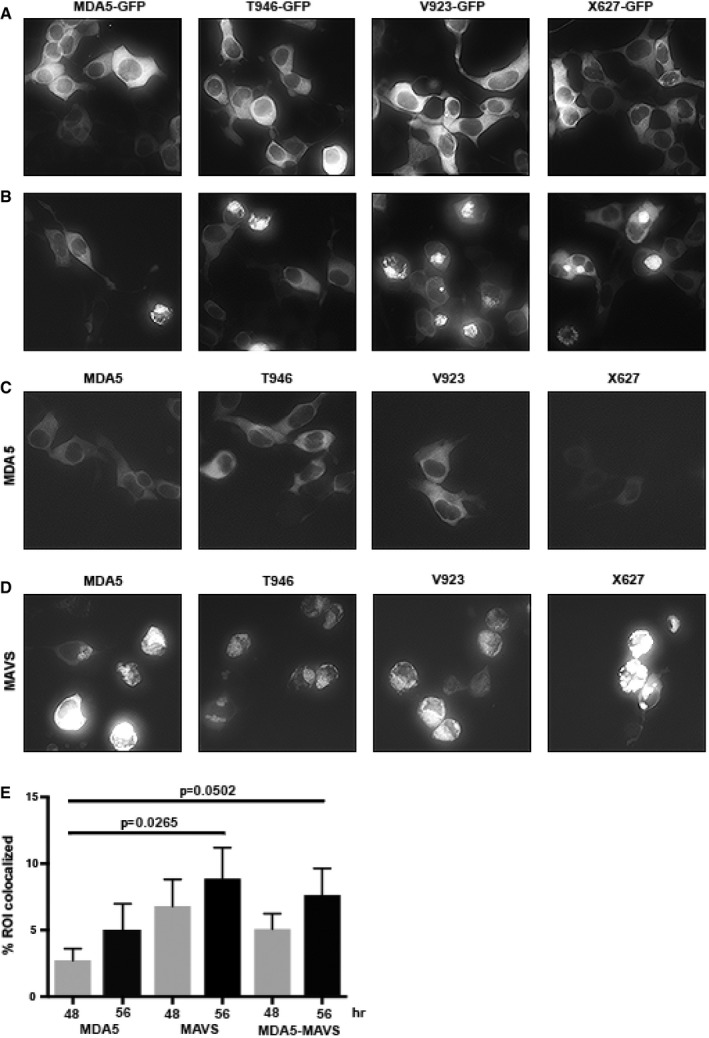
- A, B
Micrographs showing GFP fluorescence in HEK293 cells transfected with the indicated LV‐MDA5‐GFP variants after 48 (A) and 56 h (B), showing that the cytosolic expressed fusion protein coalesces to a perinuclear signal.
- C, D
Micrographs showing Venus fluorescence in cells co‐transfected with split‐Venus constructs separately fused to the indicated MDA5 variants and either (C) MDA5 to detect homotropic interactions or (D) MAVS to detect hetero‐oligomerization.
- E
A quantitation of the extent of the association of protein complexes with the mitochondria assessed by measuring the co‐localization of Venus fluorescence with the signal from the MitoTracker stain as regions of interest (ROI). The data are shown as mean ± SD. Student's t‐test was used to calculate the P‐values from six measures for each protein pair at each time point. NS = P > 0.05, *P ≤ 0.05, **P ≤ 0.01, ***P ≤ 0.001, ****P ≤ 0.0001.
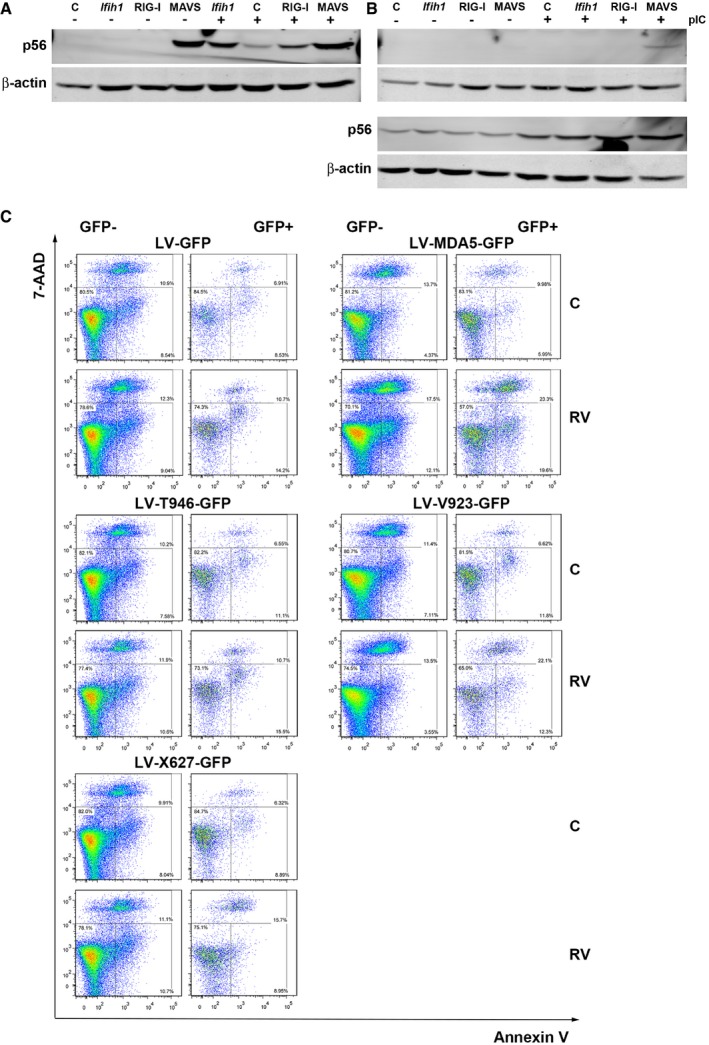
- A, B
Immunoblots detecting the induction of P56 to demonstrate the responsiveness of (A) HEK293 compared to (B) HEK293T (at top) and HeLa (at bottom) cells expressing MDA5 (Ifih1), RIG‐I, or MAVS when treated with FuGENE:pIC to activate the RLRs. β‐Actin is used as a loading control.
- C
FACS plots of HEK293 cells expressing LV‐GFP or the indicated LV‐MDA5‐GFP variants stained with annexin V and 7‐AAD. The data represent cellular viability in both transfected (GFP+) and non‐transfected cells (GFP−). The GFP‐, annexin V‐, and 7‐AAD‐positive cells are graphed in Fig 7G.
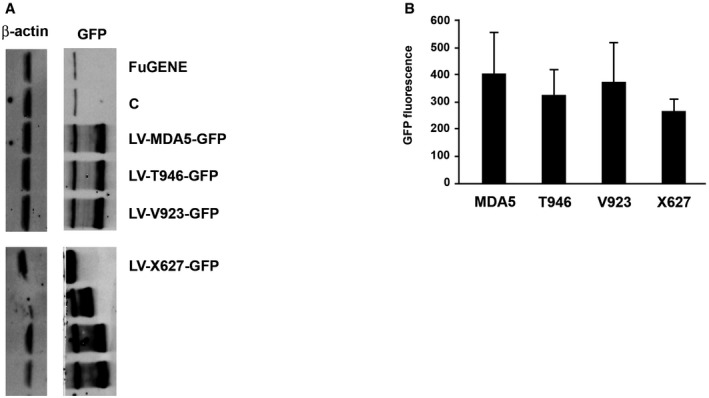
Immunoblot detection of the expression of the indicated LV‐MDA5‐GFP constructs in HEK293 cells using an anti‐GFP antibody. Unmarked lanes are mutant MDA5 constructs that were used as additional controls in the study that are not described in the text.
A graph showing the relative GFP fluorescence produced in HEK293 cells transfected with the indicated LV‐MDA5‐GFP constructs. The data is shown as mean ± the SD (n = 3).
Similar articles
-
MDA5-dependent responses contribute to autoimmune diabetes progression and hindrance.JCI Insight. 2023 Jan 24;8(2):e157929. doi: 10.1172/jci.insight.157929. JCI Insight. 2023. PMID: 36512407 Free PMC article.
-
MDA5 against enteric viruses through induction of interferon-like response partially via the JAK-STAT cascade.Antiviral Res. 2020 Apr;176:104743. doi: 10.1016/j.antiviral.2020.104743. Epub 2020 Feb 10. Antiviral Res. 2020. PMID: 32057771
-
Role of Enteroviral RNA-Dependent RNA Polymerase in Regulation of MDA5-Mediated Beta Interferon Activation.J Virol. 2019 May 1;93(10):e00132-19. doi: 10.1128/JVI.00132-19. Print 2019 May 15. J Virol. 2019. PMID: 30814289 Free PMC article.
-
Effects of type 1 diabetes-associated IFIH1 polymorphisms on MDA5 function and expression.Curr Diab Rep. 2015 Nov;15(11):96. doi: 10.1007/s11892-015-0656-8. Curr Diab Rep. 2015. PMID: 26385483 Review.
-
Innate Viral Sensor MDA5 and Coxsackievirus Interplay in Type 1 Diabetes Development.Microorganisms. 2020 Jul 3;8(7):993. doi: 10.3390/microorganisms8070993. Microorganisms. 2020. PMID: 32635205 Free PMC article. Review.
Cited by
-
Diabetogenic viruses: linking viruses to diabetes mellitus.Heliyon. 2023 Mar 30;9(4):e15021. doi: 10.1016/j.heliyon.2023.e15021. eCollection 2023 Apr. Heliyon. 2023. PMID: 37064445 Free PMC article.
-
Viruses as a potential environmental trigger of type 1 diabetes mellitus (Review).Biomed Rep. 2024 Mar 26;20(5):81. doi: 10.3892/br.2024.1770. eCollection 2024 May. Biomed Rep. 2024. PMID: 38628629 Free PMC article. Review.
-
Exploiting RIG-I-like receptor pathway for cancer immunotherapy.J Hematol Oncol. 2023 Feb 8;16(1):8. doi: 10.1186/s13045-023-01405-9. J Hematol Oncol. 2023. PMID: 36755342 Free PMC article. Review.
-
Re-Examining Rotavirus Innate Immune Evasion: Potential Applications of the Reverse Genetics System.mBio. 2022 Aug 30;13(4):e0130822. doi: 10.1128/mbio.01308-22. Epub 2022 Jun 14. mBio. 2022. PMID: 35699371 Free PMC article. Review.
-
New immunodeficiency syndromes that help us understand the IFN-mediated antiviral immune response.Curr Opin Pediatr. 2019 Dec;31(6):815-820. doi: 10.1097/MOP.0000000000000827. Curr Opin Pediatr. 2019. PMID: 31693592 Free PMC article. Review.
References
-
- Broquet AH, Hirata Y, McAllister CS, Kagnoff MF (2011) RIG‐I/MDA5/MAVS are required to signal a protective IFN response in rotavirus‐infected intestinal epithelium. J Immunol 186: 1618–1626 - PubMed
Publication types
MeSH terms
Substances
LinkOut - more resources
Full Text Sources
Other Literature Sources
Medical
Molecular Biology Databases
