. 2017 Sep 12;114(37):E7707-E7716.
doi: 10.1073/pnas.1709120114. Epub 2017 Aug 29.

TFG facilitates outer coat disassembly on COPII transport carriers to promote tethering and fusion with ER-Golgi intermediate compartments

Affiliations

TFG facilitates outer coat disassembly on COPII transport carriers to promote tethering and fusion with ER-Golgi intermediate compartments

Michael G Hanna 4th et al. Proc Natl Acad Sci U S A. .

Erratum in

Abstract

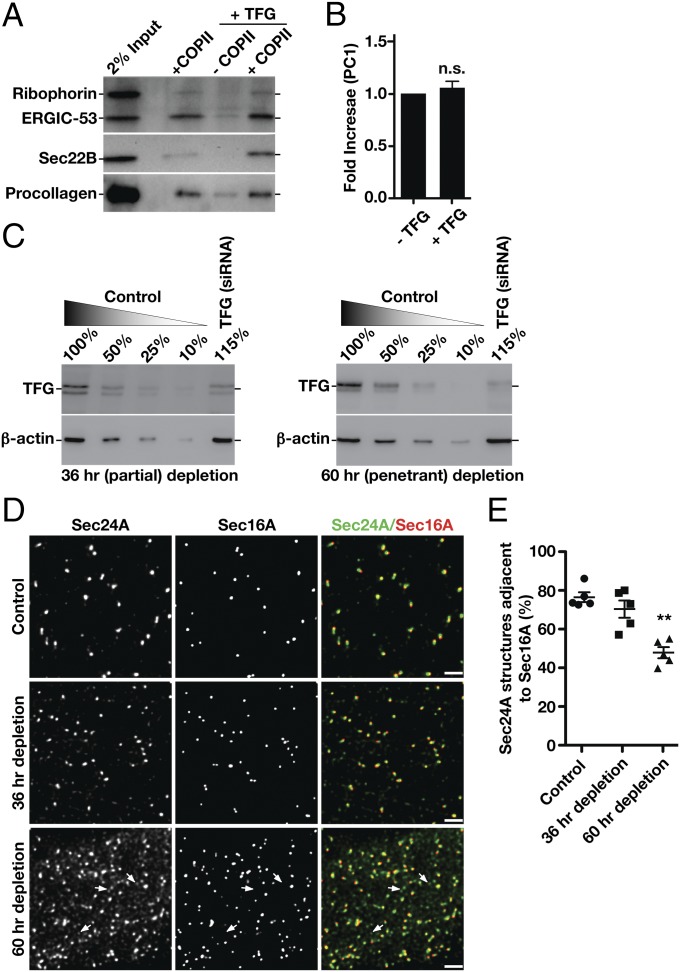
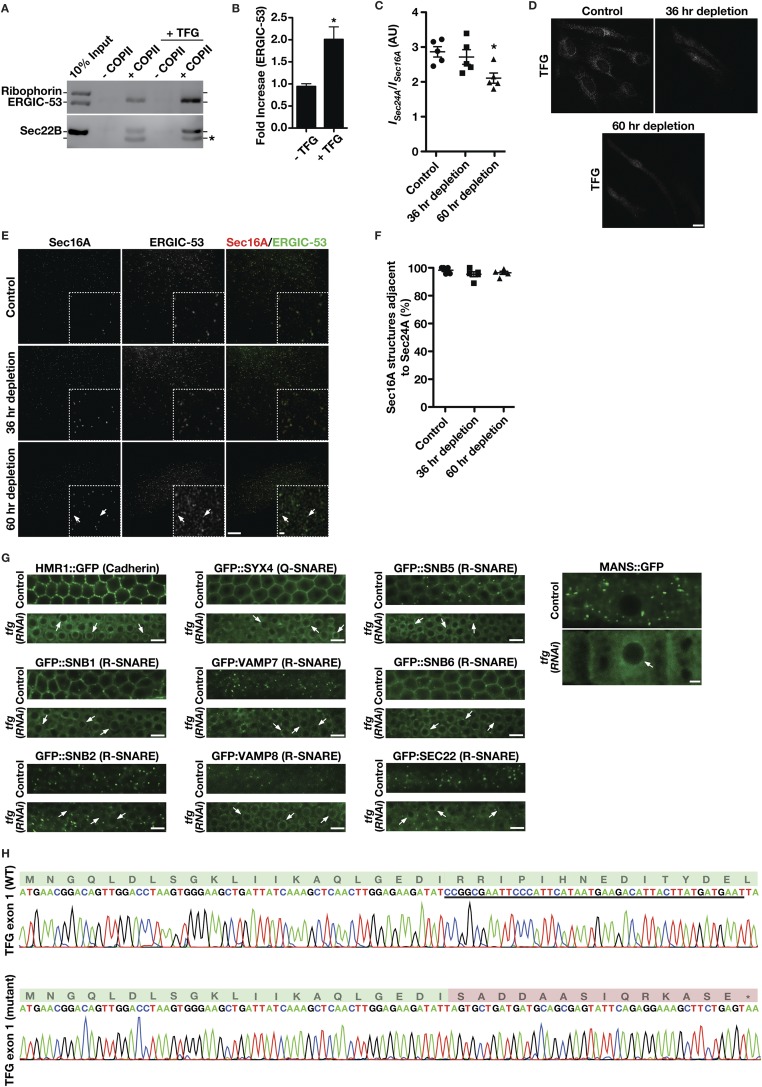
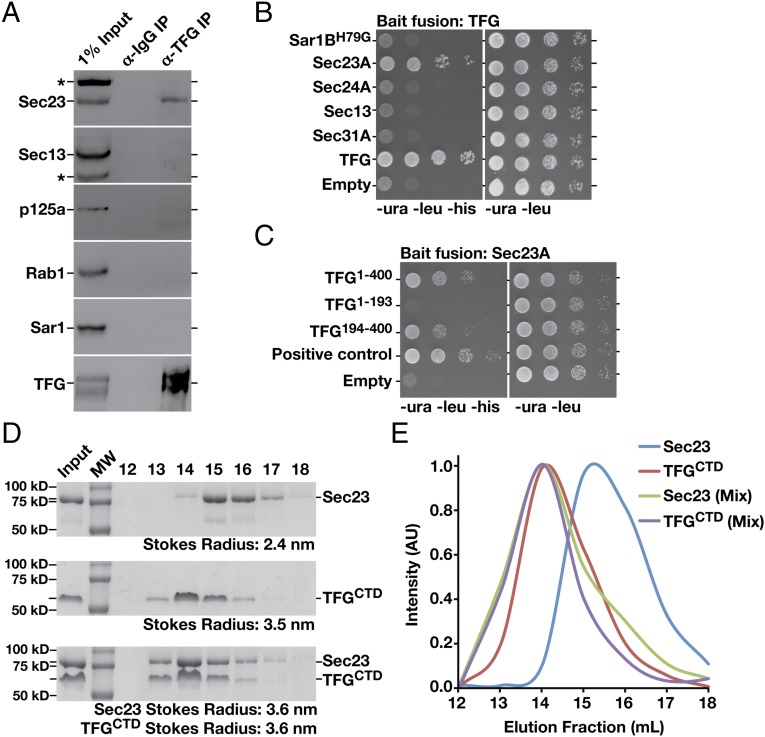
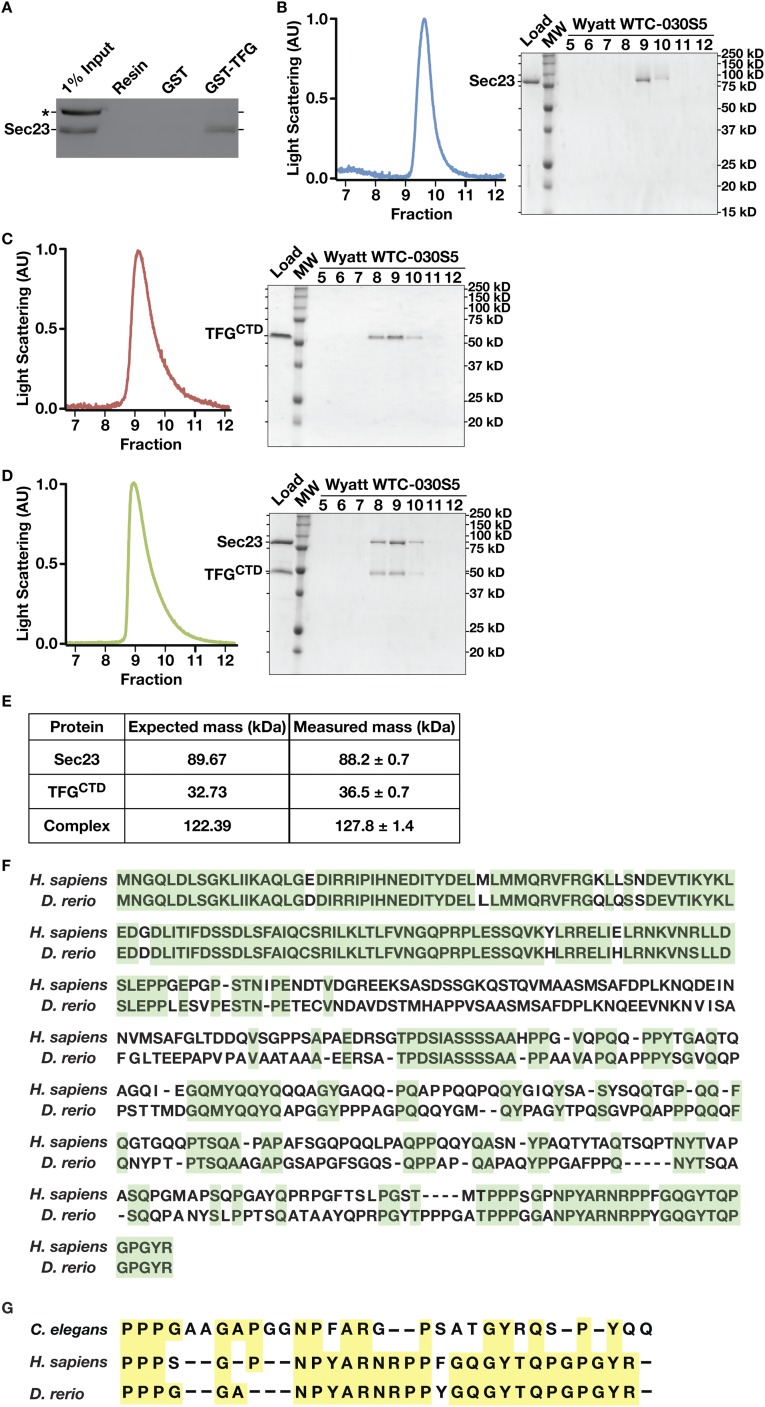
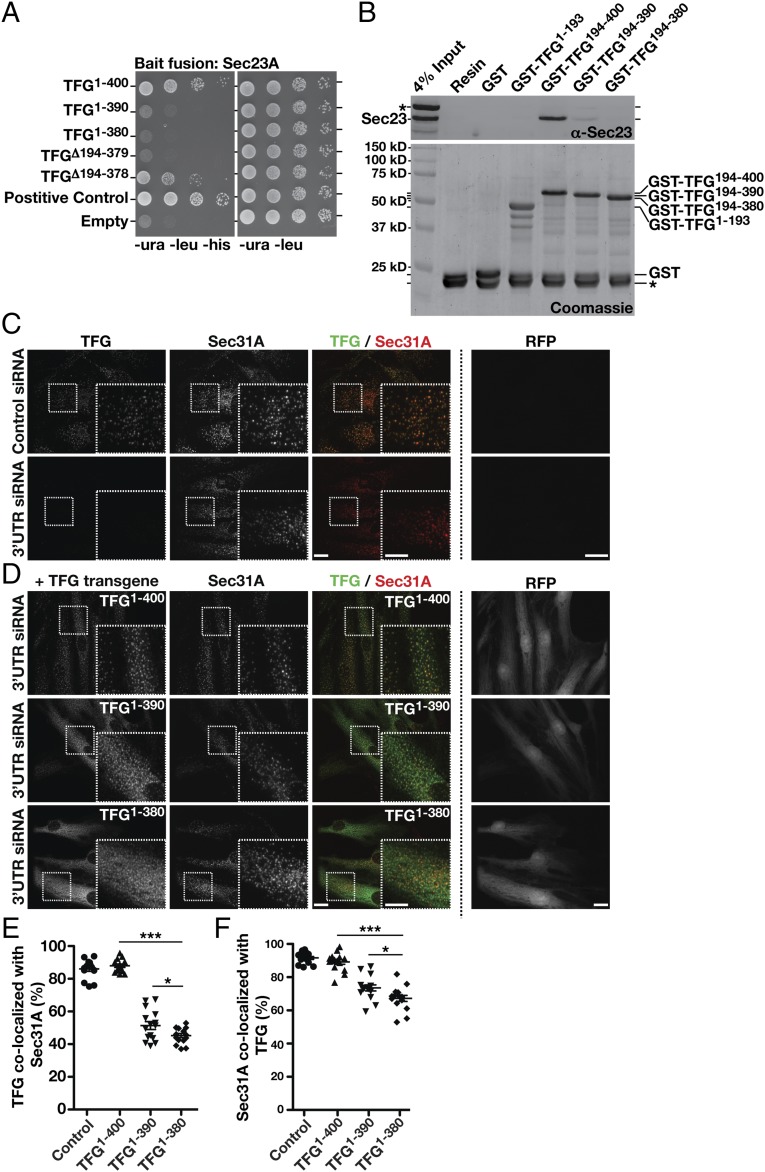
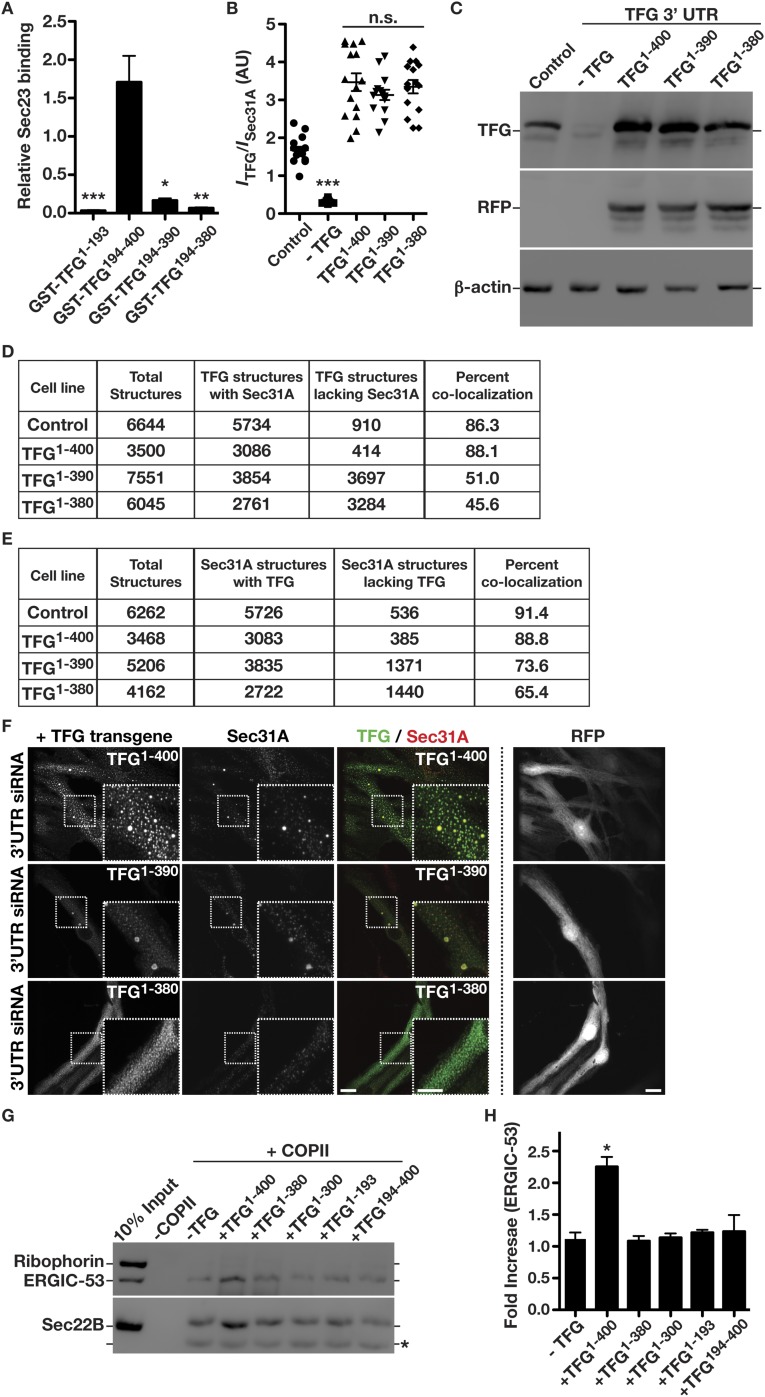
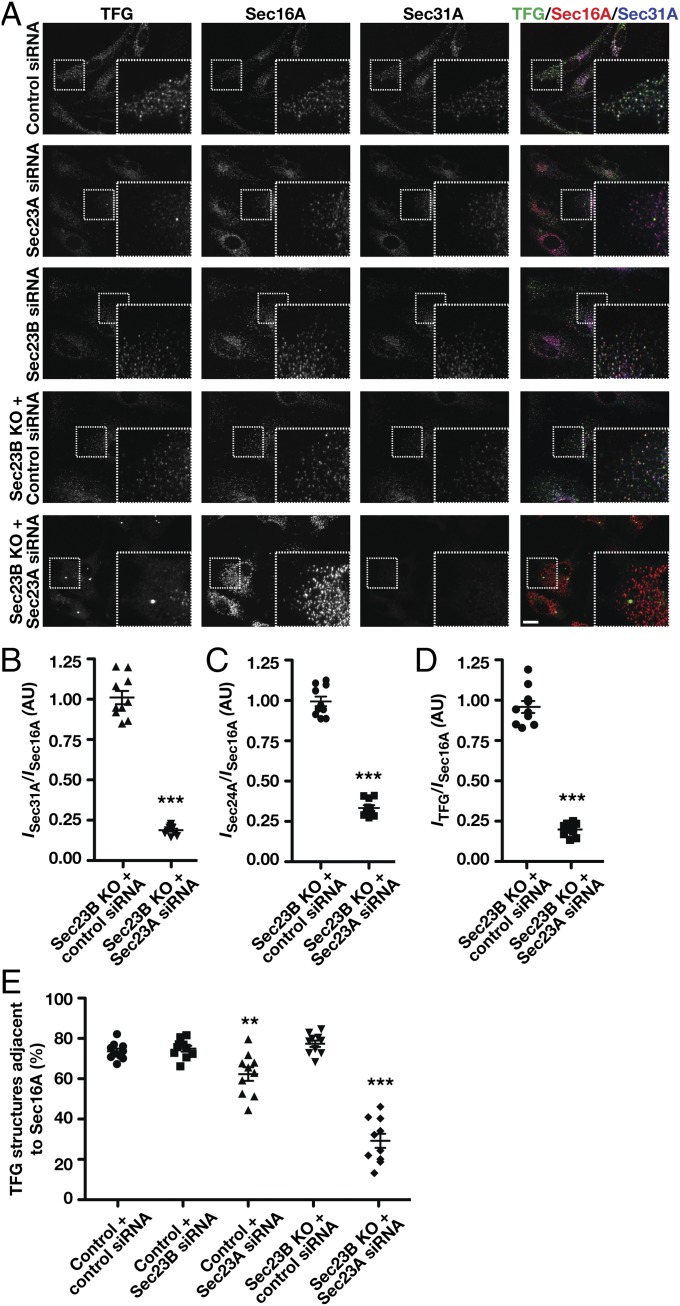
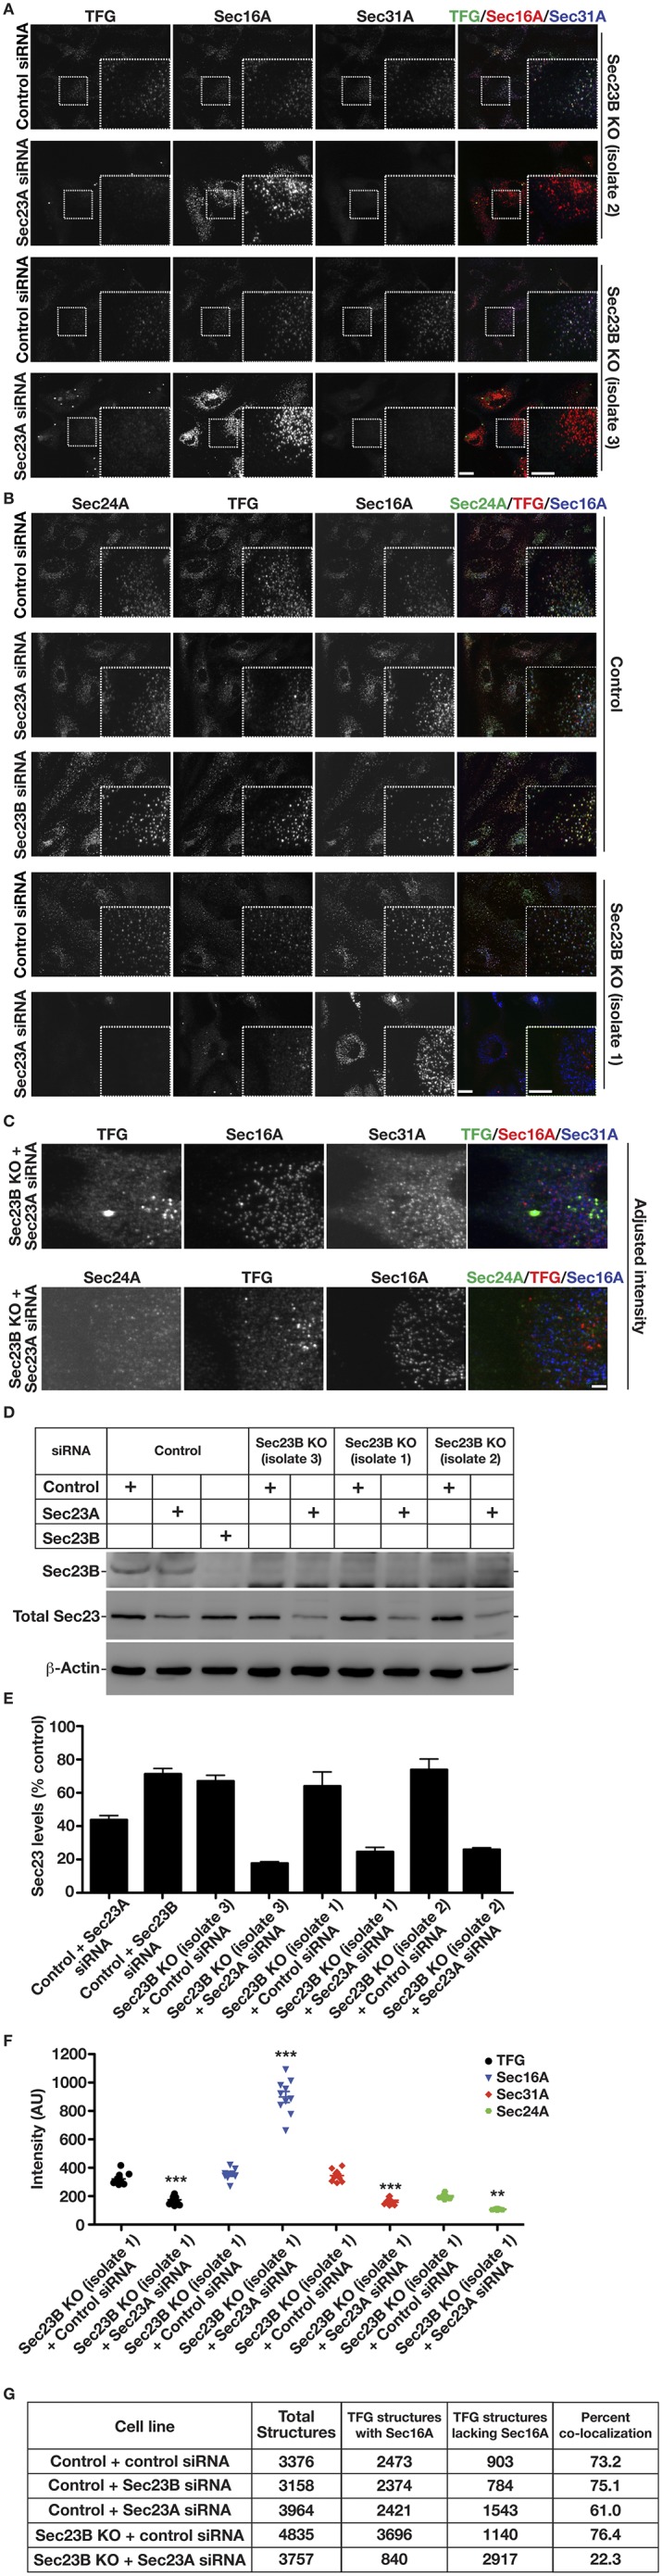
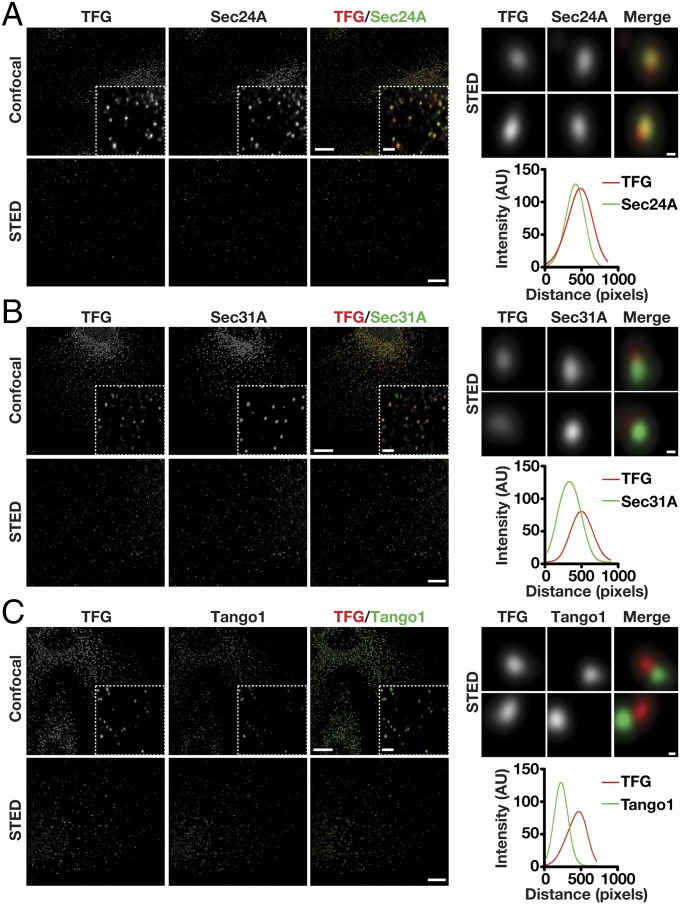
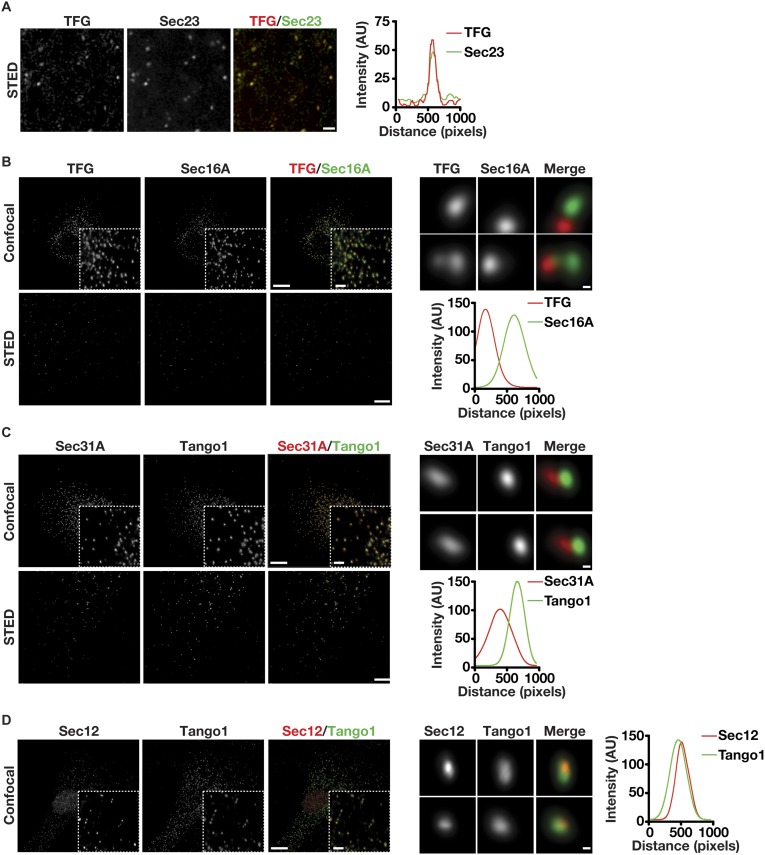
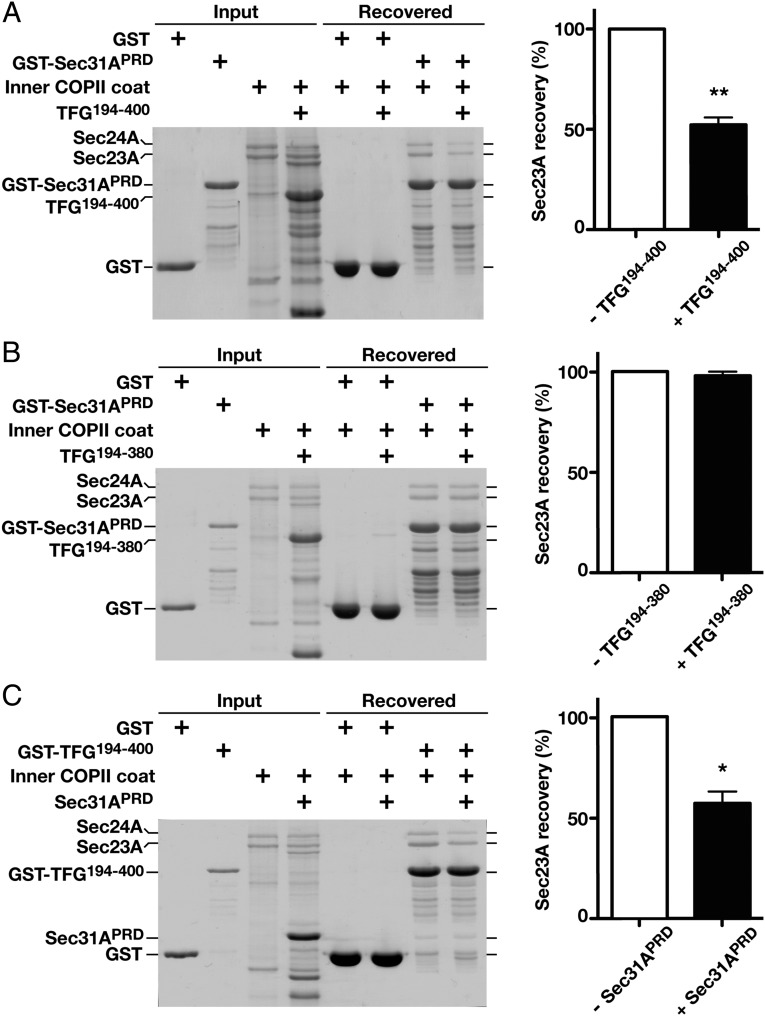
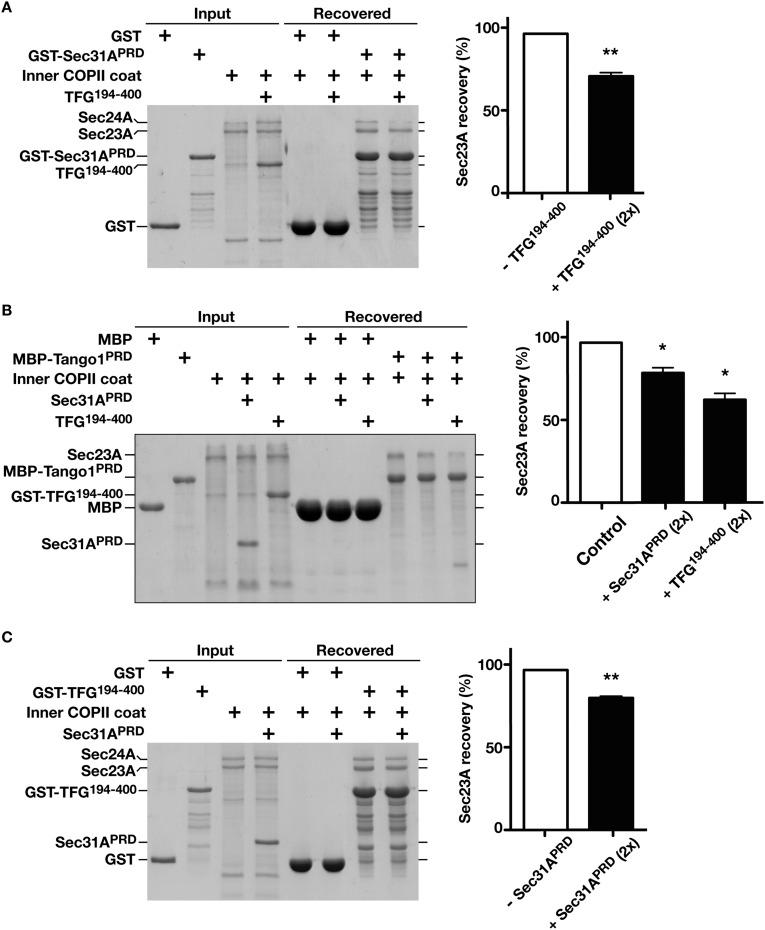
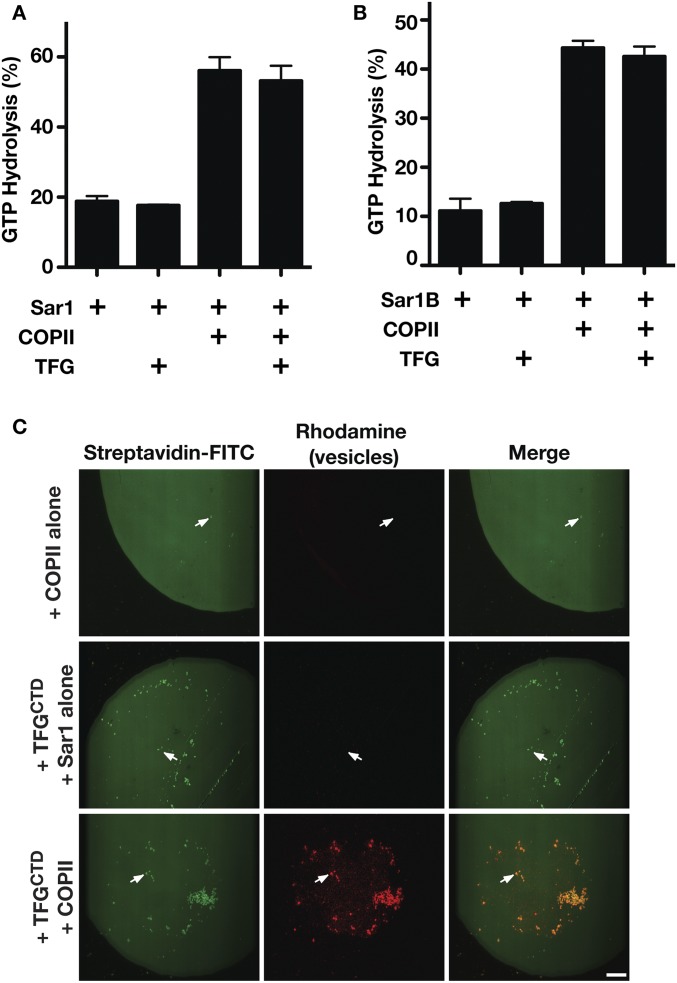
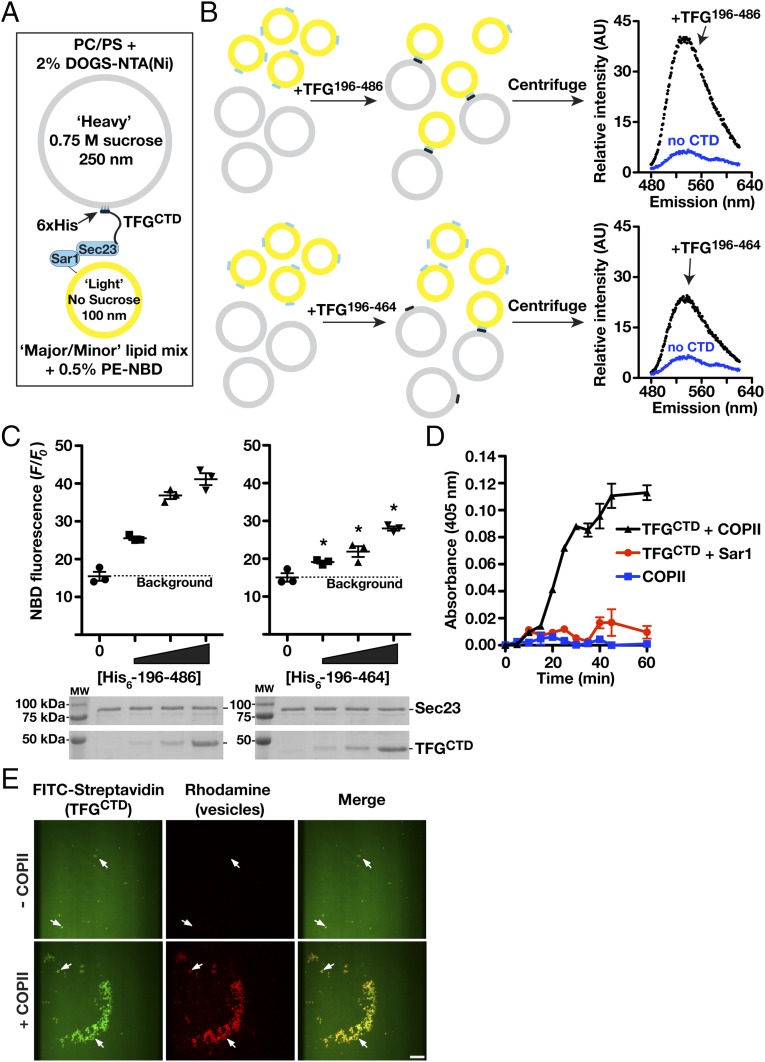
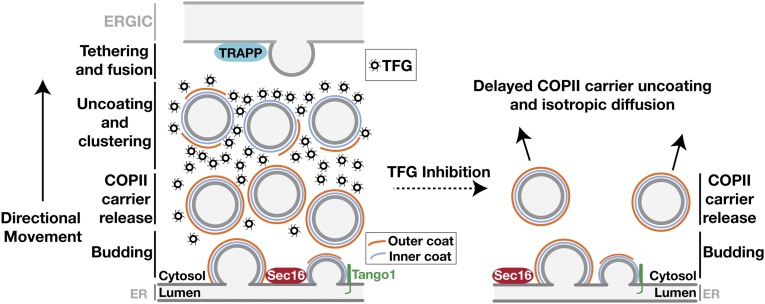
The conserved coat protein complex II (COPII) mediates the initial steps of secretory protein trafficking by assembling onto subdomains of the endoplasmic reticulum (ER) in two layers to generate cargo-laden transport carriers that ultimately fuse with an adjacent ER-Golgi intermediate compartment (ERGIC). Here, we demonstrate that Trk-fused gene (TFG) binds directly to the inner layer of the COPII coat. Specifically, the TFG C terminus interacts with Sec23 through a shared interface with the outer COPII coat and the cargo receptor Tango1/cTAGE5. Our findings indicate that TFG binding to Sec23 outcompetes these other associations in a concentration-dependent manner and ultimately promotes outer coat dissociation. Additionally, we demonstrate that TFG tethers vesicles harboring the inner COPII coat, which contributes to their clustering between the ER and ERGIC in cells. Together, our studies define a mechanism by which COPII transport carriers are retained locally at the ER/ERGIC interface after outer coat disassembly, which is a prerequisite for fusion with ERGIC membranes.

Keywords: COPII; Trk-fused gene; coat disassembly; endoplasmic reticulum; tether.


Conflict of interest statement

The authors declare no conflict of interest.

Figures

Fig. 1.
Fig. 1.
TFG regulates the transport of conventional COPII carriers. (A) Representative immunoblot of recovered COPII transport carriers isolated following budding reactions performed in the presence or absence of TFG using antibodies directed against ribophorin (Top), ERGIC-53 (Top), Sec22B (Middle), and procollagen (Bottom). (B) Quantification of the relative amounts of procollagen present in COPII transport carriers, comparing budding reactions performed in the presence and absence of TFG (n = 3). Unlike the addition of cytosol (49), recombinant TFG fails to stimulate the formation of COPII carriers containing procollagen. n.s., not significant. (C) Representative immunoblots conducted using TFG antibodies of extracts from cells that were partially depleted (Left) or more fully depleted (Right) of TFG. Immunoblotting for actin was used as a load control to quantify levels of TFG depletion. (D) Control cells (mock transfected) and cells depleted of TFG for 36 h (partial depletion) or 60 h (penetrant depletion) were immunostained using antibodies directed against Sec24A and Sec16A and were imaged using STED microscopy. Representative deconvolved images are shown. Arrows highlight Sec24A-positive structures that do not stain with Sec16A antibodies (Bottom). (Scale bars, 4 μm.) (E) Quantification of the percentage of Sec24A-labeled structures that are juxtaposed to Sec16A under the conditions specified. Error bars represent mean ± SEM; n = at least 10 different cells per condition. **P < 0.01 (penetrant depletion compared with control), calculated using a paired t test.
Fig. S1.
Fig. S1.
Depletion of TFG disrupts early secretory pathway organization and the secretion of conventional cargoes. (A) Representative immunoblot of recovered COPII transport carriers isolated following budding reactions performed in the presence or absence of TFG using antibodies directed against ERGIC-53 (Upper), ribophorin (Upper), and Sec22B (Lower). An asterisk highlights a nonspecific band recognized by the Sec22B antibody. (B) Quantification of the relative amounts of ERGIC-53 present in COPII transport carriers, comparing budding reactions performed in the presence or absence of TFG (n = 3). *P < 0.05, calculated using a paired t test. (C) Relative fluorescence intensity (I) of Sec24A juxtaposed to Sec16A-labeled structures in cells depleted of TFG to varying extents. *P < 0.05 (compared with control), calculated using a paired t test. (D) Control cells and cells depleted of TFG for 36 or 60 h were fixed and stained using antibodies directed against TFG and were imaged using confocal microscopy. Images shown are representative of at least 30 individual cells analyzed for each condition. Nonspecific staining within the nucleus is observed following penetrant depletion of TFG (60 h time point). (Scale bar, 10 μm.) (E) Control cells and cells depleted of TFG for 36 or 60 h were fixed and stained using antibodies directed against Sec16A and ERGIC-53 and were imaged using STED microscopy. (Scale bars, 4 μm; Inset, 0.5 μm.) Images shown are representative of at least 30 individual cells analyzed for each condition. (F) Quantification of the percentage of Sec16A-labeled structures that are juxtaposed to Sec24A under the conditions specified. (G) Localization of various integral membrane proteins within the C. elegans germline in control and TFG-depleted animals. Arrows highlight the aberrant accumulation of cargoes in the perinuclear ER. Images shown are representative of at least six different animals analyzed for each condition. (Scale bars, 5 μm.) (H) Sequence traces obtained from heterozygous animals (following TOPO cloning) harboring a 44-bp deletion mutation in the first coding exon of rat TFG. The deleted sequence is underlined in the wild-type trace (Upper), and nonnative amino acids encoded following a frame shift are highlighted in red.
Fig. 2.
Fig. 2.
TFG interacts directly with the inner COPII coat subunit Sec23. (A) Immunoprecipitations using IgG or antibodies directed against TFG were conducted using rat liver cytosol, separated by SDS/PAGE, and immunoblotted using the indicated antibodies (n = 3 in each condition). Asterisks highlight nonspecific bands recognized by Sec23 and Sec13 antibodies. (B) Yeast coexpressing plasmids encoding TFG (bait fusion) and several unique prey constructs were plated (10-fold dilutions, left to right) on either selective (−Ura, −Leu, −His) or histidine-supplemented medium for 48 h (n = 3). The GTPase-deficient form of Sar1B (H79G) was used in these experiments. (C) Yeast coexpressing plasmids encoding Sec23A (bait fusion) and prey constructs encoding distinct regions of TFG were plated as described in A (n = 3). Coexpression of bait and prey constructs encoding TFG fusions was used as a positive control, and an empty prey construct was used for a negative control. (D) Purified C. elegans Sec23 and TFG C-terminal domain (CTD), amino acids 196–486, were separated individually and as a mixture by gel filtration chromatography, and specific fractions were analyzed by SDS/PAGE followed by Coomassie staining (n = 3 in each condition). Stokes radii were calculated based on the elution profile of known standards. MW, molecular weight marker. (E) Retention times of C. elegans TFG (amino acids 196–486) and full-length Sec23 (individually and as a mixture) were plotted based on densitometry after gel filtration chromatography and SDS/PAGE analysis of fractions. AU, arbitrary units.
Fig. S2.
Fig. S2.
Sec23 and the TFG C terminus form a stable heterodimer in solution. (A) GST or a GST fusion to full-length human TFG was immobilized on glutathione resin and incubated with rat liver cytosol. The eluates were separated by SDS/PAGE and immunoblotted using antibodies directed against Sec23 (n = 3). An asterisk highlights a nonspecific band recognized by Sec23 antibodies in rat liver cytosol. (BD) Representative light-scattering profiles (Left) and Coomassie-stained SDS/PAGE gels (Right) following size-exclusion chromatography of purified C. elegans Sec23 (B), the TFG C terminus (amino acids 196–486) (C), and a mixture of the proteins (D). (E) Summary of the measured molecular masses of Sec23, TFG, and the Sec23-TFG complex, compared with the expected massed predicted by amino acid composition (n = 3, each condition). (F) Sequence alignment of human and zebrafish TFG, with identical amino acids highlighted in green. (G) Sequence alignment of human, zebrafish, and C. elegans TFG (the C-terminal peptide necessary for Sec23 binding), with identical amino acids highlighted in yellow.
Fig. 3.
Fig. 3.
An interaction with Sec23 is necessary for TFG localization at the ER/ERGIC interface. (A) Yeast coexpressing plasmids encoding Sec23A (bait fusion) and prey constructs encoding distinct regions of TFG were plated as described in Fig. 2A (n = 3). (B) Immobilized GST or GST fused to the C terminus of human TFG (amino acids 194–400) was incubated with rat liver cytosol, washed extensively, and eluted using glutathione. Recovered samples (15% total) were immunoblotted using Sec23 antibodies (Upper) or were Coomassie stained (Lower) following SDS/PAGE (n = 3, each condition). An asterisk highlights native rat glutathione S-transferases, which bind to the resin under all conditions. (C and D) Control cells (mock transfected) and cells depleted of TFG in the presence of doxycycline (3 ng/mL) to drive expression of various forms of TFG were immunostained using antibodies directed against TFG (green) and Sec31A (red) and were imaged using confocal microscopy. RFP fluorescence intensity was used to determine relative expression levels of each transgene. Images shown are projections of 3D datasets (4 μm in z). (Scale bars, 15 μm.) Higher-magnification views of the boxed regions are also shown in the lower right portion of each panel. (Inset scale bars, 5 μm.) Images shown are representative of at least 30 individual cells analyzed for each condition. (E and F) Quantification of the percentage of TFG-labeled structures that colocalize with Sec31A (E) and the percentage of Sec31A-labeled structures that colocalize with TFG (F) under the conditions specified. Error bars represent mean ± SEM; n = at least 15 different cells per condition. ***P < 0.001 [cells expressing full-length TFG compared with cells expressing truncated TFG (amino acids 1–390 and 1–380)], calculated using a paired t test. *P < 0.05 (comparing cells expressing each truncated form of TFG), calculated using a paired t test.
Fig. S3.
Fig. S3.
The TFG C terminus directs its localization in cells. (A) Quantification of relative Sec23 binding to various GST-TFG fusion proteins. *P < 0.05; **P < 0.01; ***P < 0.001 (compared with 4% load), calculated using a paired t test. (B) Relative fluorescence intensities of TFG and Sec31A were calculated under control conditions, TFG-depleted conditions, and conditions in which endogenous TFG is depleted and an exogenous isoform is expressed. ***P < 0.001 (compared with control), calculated using a paired t test; n.s., not significant. (C) Extracts from cells expressing various forms of TFG, following depletion of endogenous TFG, were immunoblotted using TFG (Top), RFP (Middle), and actin (load control) (Bottom) antibodies (n = 3). (D and E) Total number of TFG-labeled structures that colocalize with Sec31A (D) and the total number of Sec31A-labeled structures that colocalize with TFG (E) under control conditions and conditions under which endogenous TFG is depleted and an exogenous isoform is expressed. (F, Left) Inducible genome-edited cell lines depleted of endogenous TFG and treated with doxycycline to overexpress exogenous full-length TFG (amino acids 1–400) (Top), truncated TFG lacking the last 10 residues (amino acids 1–390) (Middle), and truncated TFG lacking the last 20 residues (amino acids 1–380) (Bottom) were fixed and stained using antibodies directed against TFG and Sec31A. (Right) RFP expression also induced by doxycycline is shown in each case. Images shown are representative of at least 30 individual cells analyzed for each condition. (Scale bar, 10 μm; Inset, 5 μm.) (G) Representative immunoblot of recovered COPII transport carriers isolated following budding reactions (n = 3) performed in the presence or absence of various TFG isoforms using antibodies directed against ERGIC-53 (Upper), ribophorin (Upper), and Sec22B (Lower). (H) Quantification of the relative amounts of ERGIC-53 present in COPII transport carriers, comparing budding reactions performed in the presence or absence of various isoforms of TFG. *P < 0.05 (compared with control), calculated using a paired t test.
Fig. 4.
Fig. 4.
COPII transport carriers are required for TFG to assemble at the ER/ERGIC interface. (A) Control cells and genome-edited cells lacking Sec23B were transfected with the indicated siRNA and immunostained using antibodies directed against TFG (green), Sec16A (red), and Sec31A (blue) and were imaged using confocal microscopy. Images shown are projections of 3D datasets (4 μm in z). (Scale bar, 15 μm.) Higher-magnification views of the boxed regions are also shown in the lower right portion of each panel. (Inset scale bar, 5 μm.) Images shown are representative of at least 30 individual cells analyzed for each condition. (BD) Fluorescence intensity (I) of Sec31A (B), Sec24A (C), or TFG (D) relative to juxtaposed Sec16A-labeled structures in cells lacking Sec23B following delivery of control siRNAs or siRNAs directed against Sec23A. ***P < 0.001 (compared with control), calculated using a paired t test. (E) Quantification of the percentage of TFG-labeled structures that are juxtaposed to Sec16A under specified conditions. Error bars represent mean ± SEM; n = at least 10 different cells per condition. **P < 0.01, ***P < 0.001 (compared with control), calculated using a paired t test.
Fig. S4.
Fig. S4.
Sec23 directs TFG localization in cells. (A) Independently isolated cell lines harboring deletion mutations in Sec23B were treated with control siRNAs or with siRNAs targeting Sec23A and were fixed and stained using antibodies against TFG (green), Sec16A (red), and Sec31A (blue). (Scale bar, 10 μm.) Higher-magnification views of the boxed regions are shown in the lower right portion of each panel. (Inset scale bar, 5 μm.) Images shown are representative of at least 30 individual cells analyzed for each condition. (B) Control cells and cells harboring a deletion mutation in Sec23B were treated with control siRNAs or with siRNAs targeting Sec23A and were fixed and stained using antibodies against TFG (red), Sec24A (green), and Sec16A (blue). (Scale bar, 10 μm.) Higher-magnification views of the boxed regions are shown in the lower right portion of each panel. (Inset scale bar, 5 μm.) Images shown are representative of at least 30 individual cells analyzed for each condition. (C) Genome-edited cells lacking Sec23B and depleted of Sec23A were fixed and stained using antibodies directed against TFG (green), Sec16A (red), and Sec31A (blue). The intensity of TFG and Sec24A staining was adjusted to highlight their lack of colocalization with Sec31A and Sec16A. (Scale bar, 5 μm.) (D) Extracts from control cells and cell lines lacking Sec23B, following treatment with various siRNAs, were immunoblotted (n = 3) using antibodies directed against Sec23B specifically (Top), both Sec23 isoforms (Middle), and actin (load control) (Bottom). (E) Quantification of Sec23 depletion, based on immunoblotting studies conducted in D. (F) Quantification of the relative fluorescence intensities of TFG (black), Sec16A (blue), Sec31A (red), and Sec24A (green) in cells lacking Sec23B and treated with control siRNAs or siRNAs targeting Sec23A. **P < 0.01, ***P < 0.001 (compared with control), calculated using a paired t test. (G) Total number of TFG-labeled structures that are juxtaposed to Sec16A and the total number of Sec16A-labeled structures that are juxtaposed to TFG under control conditions and conditions under which Sec23 expression is reduced.
Fig. 5.
Fig. 5.
TFG and the inner COPII subunit Sec24A exhibit overlapping distributions. Control RPE1 cells were fixed and stained with antibodies directed against TFG and Sec24A (A), Sec31A (B), or Tango1 (C) and were imaged using confocal and STED microscopy. [Scale bars, 10 μm (confocal) and 4 μm (STED).] Higher-magnification views (confocal) are shown in the lower right portion of each panel in the upper rows. (Inset scale bars, 2 μm.) Higher-magnification views (STED) are also shown for two sites harboring TFG (Right), and a representative linescan measurement is shown to highlight the relative distributions of labeled proteins. (Scale bars, 200 nm.) Images shown are representative of at least 30 individual cells analyzed for each condition.
Fig. S5.
Fig. S5.
Organization of the early secretory pathway components TFG, Sec16A, COPII subunits, and Tango1. (A, Left) Control C. elegans embryos were fixed and stained using antibodies directed against Sec23 and TFG and were imaged using STED microscopy (n = 6 embryos). (Scale bar, 1 μm.) (Right) A representative linescan measurement is shown to highlight the relative distributions of TFG and Sec23. (BD, Left) Control RPE1 cells were fixed and stained with antibodies directed against TFG and Sec16A (B), Sec31A and Tango1 (C), or Sec12 and Tango1 (D) and were imaged using confocal and STED microscopy. (Scale bars, 10 μm for confocal imaging; 4 μm for STED microscopy.) Higher-magnification views (confocal) are shown in the lower right portion in the top row of each panel. (Inset scale bar, 2 μm.) (Right) Higher-magnification views (STED) are also shown for sites labeled with the specified antibodies, and a representative linescan measurement is shown to highlight the relative distributions of labeled proteins. (Scale bars, 200 nm.) Images shown are representative of at least 30 individual cells analyzed for each condition.
Fig. 6.
Fig. 6.
TFG outcompetes Sec31A for Sec23A binding. (A, Left) Immobilized GST-Sec31A (PRD) was incubated with recombinant Sar1B-Sec23A-Sec24A in the presence or absence of the C terminus of human TFG (amino acids 194–400; 1:1:5 ratio), eluted using sample buffer, and separated by SDS/PAGE followed by Coomassie staining. (Right) The amount of Sec23A recovered in each case is quantified (n = 3) relative to GST-Sec31A. (B, Left) Immobilized GST-Sec31A (PRD) was incubated with recombinant Sar1B-Sec23A-Sec24A in the presence or absence of a truncated form of the TFG C terminus (amino acids 194–380; 1:1:5 ratio), eluted using sample buffer, and separated by SDS/PAGE followed by Coomassie staining. (Right) The amount of Sec23A recovered in each case is quantified (n = 3), relative to GST-Sec31A). (C, Left) Immobilized GST-TFG (amino acids 194–400) was incubated with recombinant Sar1B-Sec23A-Sec24A in the presence or absence of Sec31A (PRD; 1:1:5 ratio), eluted using sample buffer, and separated by SDS/PAGE followed by Coomassie staining. (Right) The amount of Sec23A recovered in each case is quantified (n = 3) relative to GST-TFG. In all cases, error bars represent mean ± SEM. **P < 0.01; *P < 0.05, calculated using a paired t test.
Fig. S6.
Fig. S6.
TFG competes with Sec31A and Tango1 for Sec23 association. (A, Left) Immobilized GST-Sec31A (PRD) was incubated with recombinant Sar1B-Sec23A-Sec24A in a 1:1:2 ratio in the presence or absence of the C terminus of human TFG (amino acids 194–400), eluted using sample buffer, and separated by SDS/PAGE followed by Coomassie staining. (Right) The amount of Sec23A recovered in each case is quantified (n = 3) relative to GST-Sec31A. (B, Left) Immobilized MBP-Tango1 (amino acids 1,800–1,907) was incubated with recombinant Sar1B-Sec23A-Sec24A in the presence or absence of Sec31A (PRD) (1:1:2 ratio) or TFG (amino acids 194–400) (1:1:2 ratio), eluted using sample buffer, and separated by SDS/PAGE followed by Coomassie staining. (Right) The amount of Sec23A recovered in each case is quantified (n = 3) relative to MBP-Tango1. (C, Left) Immobilized GST-TFG (amino acids 194–400) was incubated with recombinant Sar1B-Sec23A-Sec24A in the presence or absence of Sec31A (PRD) (1:1:2 ratio), eluted using sample buffer, and separated by SDS/PAGE followed by Coomassie staining. (Right) The amount of Sec23A recovered in each case is quantified (n = 3) relative to GST-TFG. In all cases, error bars represent the mean ± SEM. **P < 0.01; *P < 0.05, calculated using a paired t test.
Fig. S7.
Fig. S7.
The TFG C terminus does not promote Sec23-mediated GAP activity on Sar1 but is capable of tethering COPII-coated liposomes. (A) C. elegans TFG (amino acids 196–486) was incubated with Sar1 loaded with GTP in the presence or absence of Sec23-Sec24, and the extent of GTP hydrolysis was measured (n = 3). (B) Human TFG (amino acids 194–400) was incubated with Sar1B loaded with GTP in the presence or absence of Sec23A-Sec24A, and the extent of GTP hydrolysis was measured (n = 3). (C) Microcontact printing was used to generate biotinylated surfaces to which FITC-streptavidin was bound. Incubations in the presence or absence of the C. elegans TFG C terminus (amino acids 196–486) fused to the streptavidin-binding peptide and liposomes containing rhodamine-PE that were coated either with Sar1GTP and Sec23 (COPII) or with Sar1GTP alone were conducted. Surfaces were inverted onto glass coverslips and imaged using confocal microscopy (n = 3). Arrows highlight streptavidin-labeled structures, which only localize with rhodamine-labeled vesicles in the presence of TFG and COPII. (Scale bar, 25 μm.)
Fig. 7.
Fig. 7.
TFG tethers COPII-coated liposomes. (A) Diagram depicting the liposome-tethering assay highlighting the presence of C. elegans TFG (amino acids 196–486, harboring a polyhistidine tag) on heavy liposomes containing DOGS-NTA(Ni) (gray) and COPII components (C. elegans Sar1GTP and Sec23) bound to light liposomes (yellow). (B, Left) Light liposomes harboring COPII (Sar1GTP, 2 μM; Sec23, 250 nM) were mixed with heavy liposomes (1:1 ratio, 1 mM total lipids), bound to varying amounts (0, 10, 30, and 100 nM) of full-length TFG C terminus (amino acids 196–486) or truncated TFG C terminus (amino acids 196–464), and centrifuged. (Right) The liposome pellet was resuspended with buffer containing 0.2% Triton X-100, and nitrobenzoxadiazole (NBD) fluorescence was quantified to determine the degree of tethering. AU, arbitrary units. (C, Upper) Quantification of NBD fluorescence (F) obtained from sedimented liposomes in the presence of different concentrations of the full-length or truncated TFG C terminus (graphical plots; n = 3). *P < 0.05 (compared with control), calculated using a paired t test. (Lower) The presence of Sec23 (10% total) and TFG (100% total) with sedimented liposomes was confirmed by SDS/PAGE analysis followed by Coomassie staining. (D) Liposome aggregation was measured (absorbance: 405 nm) over time. Light liposomes harboring Sar1GTP alone or Sar1GTP with Sec23 (COPII) were incubated with heavy liposomes in the presence or absence of TFG (30 nM). Reactions (n = 3) were maintained at 4 °C, and samples were taken at the indicated time points. (E) Microcontact printing was used to generate biotinylated surfaces to which FITC-streptavidin was bound. The C. elegans TFG C terminus (amino acids 196–486) fused to the streptavidin-binding peptide was incubated with these regions and subsequently exposed to liposomes containing rhodamine-PE, which were coated with either Sar1GTP and Sec23 or Sar1GTP alone. Surfaces were inverted onto glass coverslips and imaged using confocal microscopy (n = 3). Arrows indicate TFG clusters that recruit COPII-coated liposomes. (Scale bar, 25 μm.)
Fig. 8.
Fig. 8.
Model depicting the organization of the early secretory pathway in the presence and absence of TFG. Initiation of COPII carrier formation occurs at ER subdomains harboring Sec16A and Tango1-like cargo receptors, which interact directly with Sec23. Full assembly of the outer COPII cage interferes with these interactions and facilitates the release of the transport carrier into the ER/ERGIC interface, where TFG competes with Sec31 for Sec23 binding. The outer coat is ultimately displaced by TFG, which clusters inner COPII-coated transport carriers until they tether and fuse with adjacent ERGIC membranes. In the absence of TFG, transport carriers harboring both the inner and outer layers of the COPII coat continue to form but diffuse away from the ER/ERGIC interface, slowing secretory transport of conventional COPII-dependent cargoes.

Similar articles

Cited by

References

    1. Hobman TC, Zhao B, Chan H, Farquhar MG. Immunoisolation and characterization of a subdomain of the endoplasmic reticulum that concentrates proteins involved in COPII vesicle biogenesis. Mol Biol Cell. 1998;9:1265–1278. - PMC - PubMed
    1. Venditti R, Wilson C, De Matteis MA. Exiting the ER: What we know and what we don’t. Trends Cell Biol. 2014;24:9–18. - PubMed
    1. Brandizzi F, Barlowe C. Organization of the ER-Golgi interface for membrane traffic control. Nat Rev Mol Cell Biol. 2013;14:382–392. - PMC - PubMed
    1. Appenzeller-Herzog C, Hauri H-P. The ER-Golgi intermediate compartment (ERGIC): In search of its identity and function. J Cell Sci. 2006;119:2173–2183. - PubMed
    1. Martínez-Menárguez JA, Geuze HJ, Slot JW, Klumperman J. Vesicular tubular clusters between the ER and Golgi mediate concentration of soluble secretory proteins by exclusion from COPI-coated vesicles. Cell. 1999;98:81–90. - PubMed

Publication types

Substances