. 2017 Aug 29;8(1):382.
doi: 10.1038/s41467-017-00443-5.

Using ALoFT to determine the impact of putative loss-of-function variants in protein-coding genes

Affiliations

Using ALoFT to determine the impact of putative loss-of-function variants in protein-coding genes

Suganthi Balasubramanian et al. Nat Commun. .

Abstract

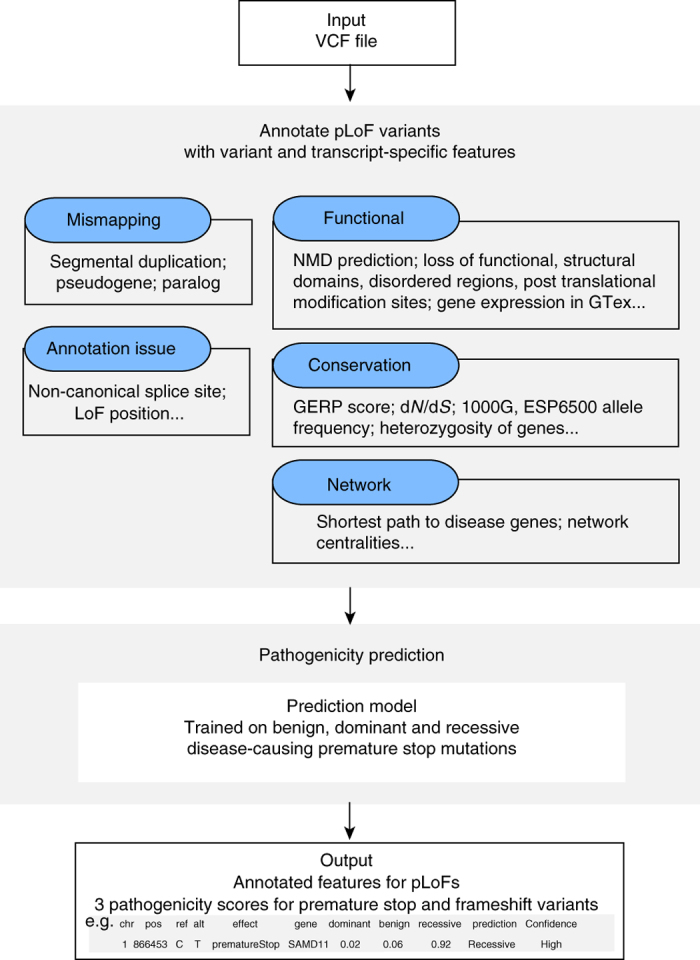
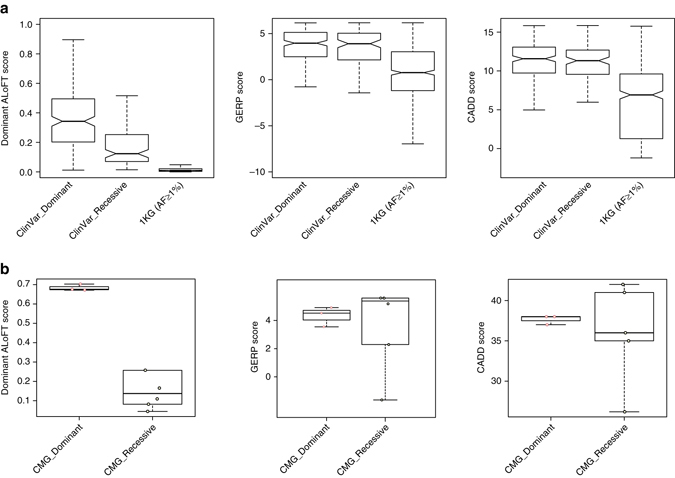
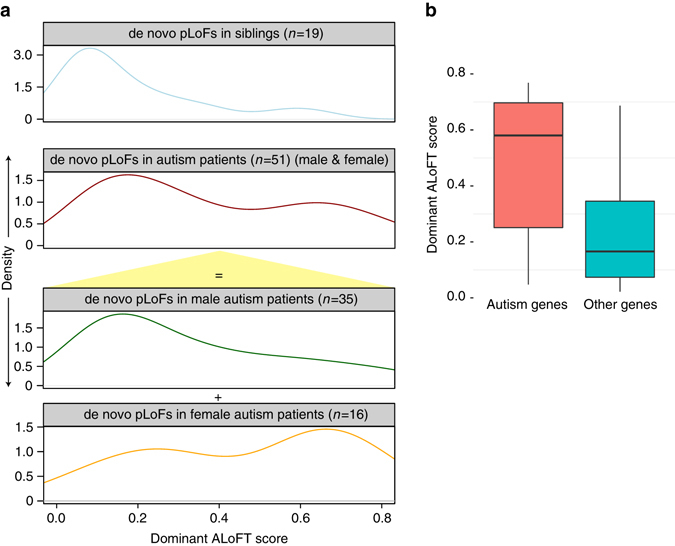
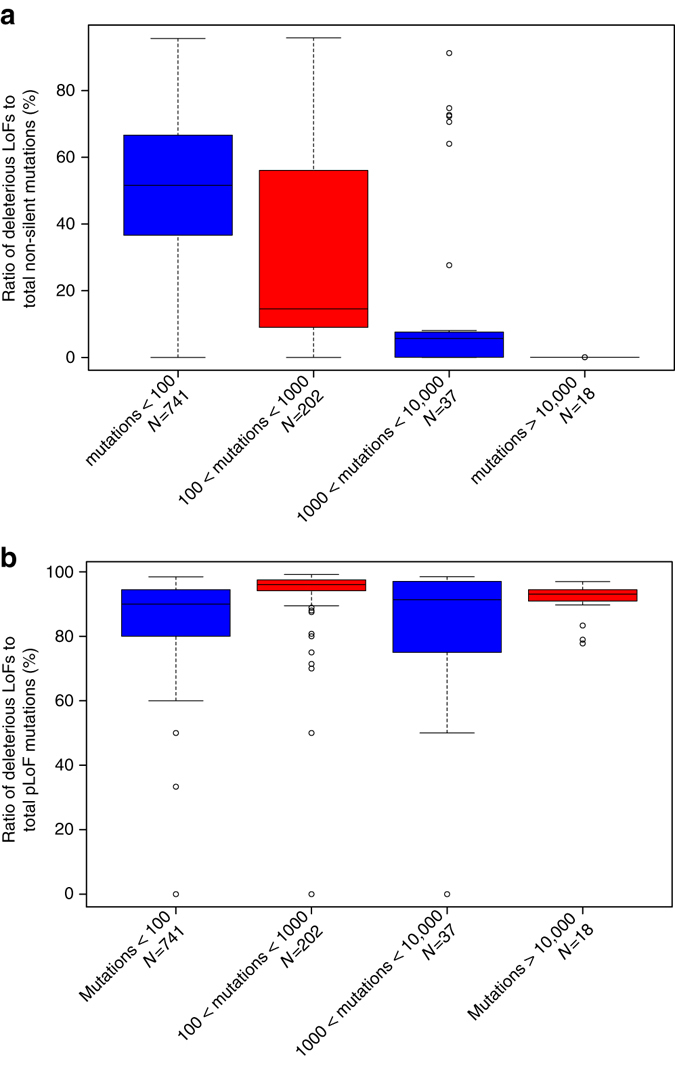
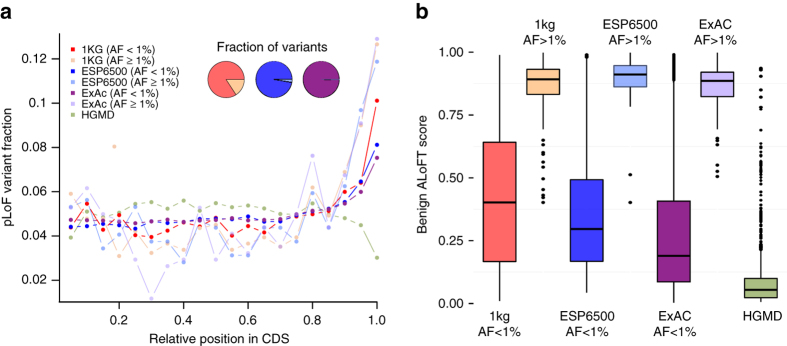
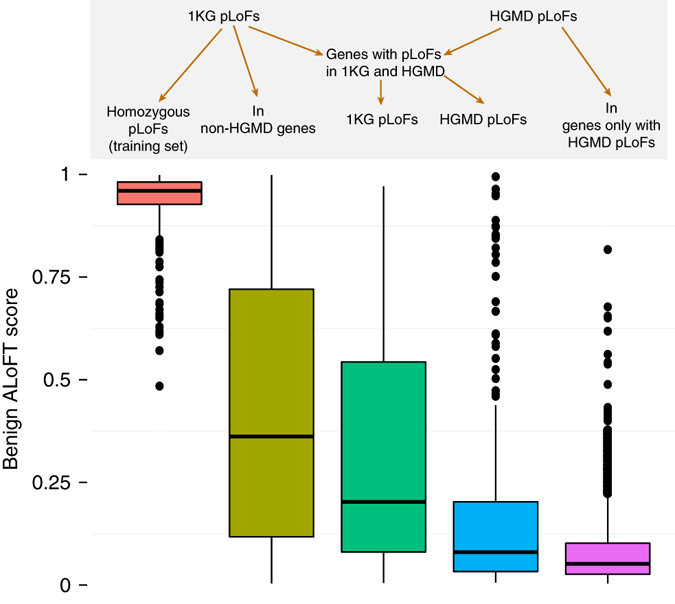
Variants predicted to result in the loss of function of human genes have attracted interest because of their clinical impact and surprising prevalence in healthy individuals. Here, we present ALoFT (annotation of loss-of-function transcripts), a method to annotate and predict the disease-causing potential of loss-of-function variants. Using data from Mendelian disease-gene discovery projects, we show that ALoFT can distinguish between loss-of-function variants that are deleterious as heterozygotes and those causing disease only in the homozygous state. Investigation of variants discovered in healthy populations suggests that each individual carries at least two heterozygous premature stop alleles that could potentially lead to disease if present as homozygotes. When applied to de novo putative loss-of-function variants in autism-affected families, ALoFT distinguishes between deleterious variants in patients and benign variants in unaffected siblings. Finally, analysis of somatic variants in >6500 cancer exomes shows that putative loss-of-function variants predicted to be deleterious by ALoFT are enriched in known driver genes.Variants causing loss of function (LoF) of human genes have clinical implications. Here, the authors present a method to predict disease-causing potential of LoF variants, ALoFT (annotation of Loss-of-Function Transcripts) and show its application to interpreting LoF variants in different contexts.


Conflict of interest statement

The authors declare no competing financial interests.

Figures

Fig. 1
Fig. 1
Schematic workflow. ALoFT uses a VCF file as input and annotates premature stop, frameshift-causing indel and canonical splice-site mutations with functional, conservation, and network features. ALoFT also flags potential mismapping and annotation errors. Using the annotation features, ALoFT predicts the pathogenicity (as either benign, recessive, or dominant disease-causing) of premature stop and frameshift mutations based on a model trained on known data. ALoFT can also take as input a five-column tab-delimited file containing chromosome, position, variant ID, reference allele, and alternate allele as its columns
Fig. 2
Fig. 2
ALoFT classification of pathogenic premature stop variants from Mendelian disease studies. a Dominant ALoFT, GERP, and CADD scores for ClinVar and 1KG common (AF ⩾ 1%) variants. All training variants are excluded. Average benign ALoFT scores are 0.097 and 0.115, respectively, for ClinVar dominant and recessive data sets. AF denotes Allele Frequency. 1KG stands for 1000 Genomes Phase1 data. b Dominant ALoFT, GERP, and CADD scores for pathogenic variants from the CMG studies. In these plots, the center line represents the median value of the data, the box goes from the first quartile to the third quartile. The lower whisker goes from Q1 to the smallest non-outlier in the data set, and the upper whisker goes from Q3 to the largest non-outlier in the data set. In addition, the data points are also plotted as open circles
Fig. 3
Fig. 3
ALoFT classification of de novo premature stop variants from autism studies. a The top two panels show the ALoFT dominant scores of de novo premature stop mutations in autism patients and siblings; mutations in patients are further separated by gender, as shown in the bottom two panels. b ALoFT dominant prediction scores for autism de novo pLoFs in confident risk genes. In this plot, the center line represents the median value of the data, the box goes from the first quartile to the third quartile. The lower whisker goes from Q1 to the smallest non-outlier in the data set, and the upper whisker goes from Q3 to the largest non-outlier in the data set
Fig. 4
Fig. 4
ALoFT classification of somatic premature stop variants. The fraction of mutations occurring in various gene categories (Y axis) as a function of predicted diseasing-causing score for cancer somatic premature stop variants (X axis). Disease-causing score is calculated as (1—predicted benign ALoFT score). We calculated the fraction of somatic premature stop mutations in 504 known cancer driver genes and 504 randomly selected genes. To ensure that the cancer driver genes and the randomly selected genes have similar length distributions, the 504 random genes were selected from genes with matched length. Similarly, we compared the fraction of somatic premature stop mutations in 397 LoF-tolerant genes and 397 randomly selected genes with similar length distribution. LoF-tolerant genes are genes that have at least one homozygous LoF variant in at least one individual in the 1KG cohort
Fig. 5
Fig. 5
Accumulation of deleterious LoF variants. a The top panel depicts the accumulation of deleterious LoF variants vs. total non-silent variants. For this analysis, following four different intervals were defined based on mutation burden: <100 mutations (N = 741 samples), 100–1000 mutations (N = 202 samples), 1000–10,000 mutations (N = 37 samples), and >10,000 mutations (N = 18). Non-silent variants include missense variants and putative loss-of-function (pLoF) variants. b The bottom panel depicts the accumulation of deleterious LoF variants vs. total pLoF variants. In both box plots, the center line represents the median value of the data, the box goes from the first quartile to the third quartile. The lower whisker goes from Q1 to the smallest non-outlier in the data set, and the upper whisker goes from Q3 to the largest non-outlier in the data set. Outliers are indicated by the plotted points
Fig. 6
Fig. 6
Proportion of deleterious LoFs in tumor suppressor genes. Tumor suppressor genes were identified using Vogelstein’s 20/20 rule. Samples containing at least 20 somatic mutations were included in this analysis. In the box plots, the center line represents the median value of the data, the box goes from the first quartile to the third quartile. The lower whisker goes from Q1 to the smallest non-outlier in the data set, and the upper whisker goes from Q3 to the largest non-outlier in the data set. Outliers are indicated by the plotted points
Fig. 7
Fig. 7
pLoFs in last exons. a Position of premature stop variants in coding transcripts. Compared to HGMD variants, both common and rare 1KG, ESP6500, and ExAC variants are enriched in the last 5% of the coding sequence. AF, allele frequency, pLoF, putative loss-of-function variant, and CDS, coding sequence. Variants at allele frequency <1% are considered to be rare variants. Variants with at least 1% allele frequency are considered common. b Predicted benign scores for premature stop variants in the last coding exons. In the box plots, the center line represents the median value of the data, the box goes from the first quartile to the third quartile. The lower whisker goes from Q1 to the smallest non-outlier in the data set, and the upper whisker goes from Q3 to the largest non-outlier in the data set. Outliers are indicated by the plotted points. Training variants are excluded in this plot
Fig. 8
Fig. 8
ALoFT classification of 1000 Genomes and HGMD variants. Benign scores for premature stop variants in 1KG and HGMD. For this plot, we randomly selected one variant per gene. The “Benign pLoFs” set includes homozygous premature stop variants discovered in 1KG. The third (dark green) box plot pertains to premature stop variants in healthy 1KG individuals occurring in disease-causing genes obtained from HGMD. The fourth (blue) box plot pertains to pLoF variants in the subset of HGMD genes where 1KG pLoFs are also seen. “1KG pLoFs in non-HGMD genes” include 1KG variants not in HGMD genes, i.e., non-disease genes. “In genes only with HGMD pLoFs” includes HGMD variants in only those disease genes where 1KG pLoFs are not seen. In the box plots, the center line represents the median value of the data, the box goes from the first quartile to the third quartile. The lower whisker goes from Q1 to the smallest non-outlier in the data set, and the upper whisker goes from Q3 to the largest non-outlier in the data set. Outliers are indicated by the plotted points

Similar articles

Cited by

References

    1. Balasubramanian S, et al. Gene inactivation and its implications for annotation in the era of personal genomics. Genes Dev. 2011;25:1–10. doi: 10.1101/gad.1968411. - DOI - PMC - PubMed
    1. MacArthur DG, et al. A systematic survey of loss-of-function variants in human protein-coding genes. Science (80-.) 2012;335:823–828. doi: 10.1126/science.1215040. - DOI - PMC - PubMed
    1. McVean GA, et al. An integrated map of genetic variation from 1,092 human genomes. Nature. 2012;491:56–65. doi: 10.1038/nature11632. - DOI - PMC - PubMed
    1. 1000 Genomes Project Consortium et al. A global reference for human genetic variation. Nature. 2015;526:68–74. doi: 10.1038/nature15393. - DOI - PMC - PubMed
    1. Sulem P, et al. Identification of a large set of rare complete human knockouts. Nat. Genet. 2015;47:448–452. doi: 10.1038/ng.3243. - DOI - PubMed

Publication types

LinkOut - more resources